

TL;DR #
At 38.46% relative eccentricity, 2D FEA models overestimate contact stress at maximum compression by 1.46% and underestimate it at minimum compression by 6.08% — and for small-diameter O-rings (14 mm), the minimum-compression error reaches −8.83%, which is enough to cause a seal design to pass on paper while leaking in service. If you are qualifying O-ring seals for pumps or valve stems where shaft runout or bore misalignment is expected, you cannot trust 2D simulation results from your Chinese supplier without knowing their correction methodology. Ask for 3D FEA contact stress data or, at minimum, a documented error-correction formula calibrated against 3D results.
Overview #
Most procurement engineers never look past durometer, compound specification, and cross-section diameter when qualifying O-ring seals. That approach works fine for static face seals assembled with zero shaft offset — but it misses one of the most common real-world failure drivers: eccentricity. When an O-ring is installed with any degree of radial offset between the shaft and bore, the compression load is no longer uniform around the ring, and every simulation or design calculation that assumes axial symmetry is, by definition, wrong.
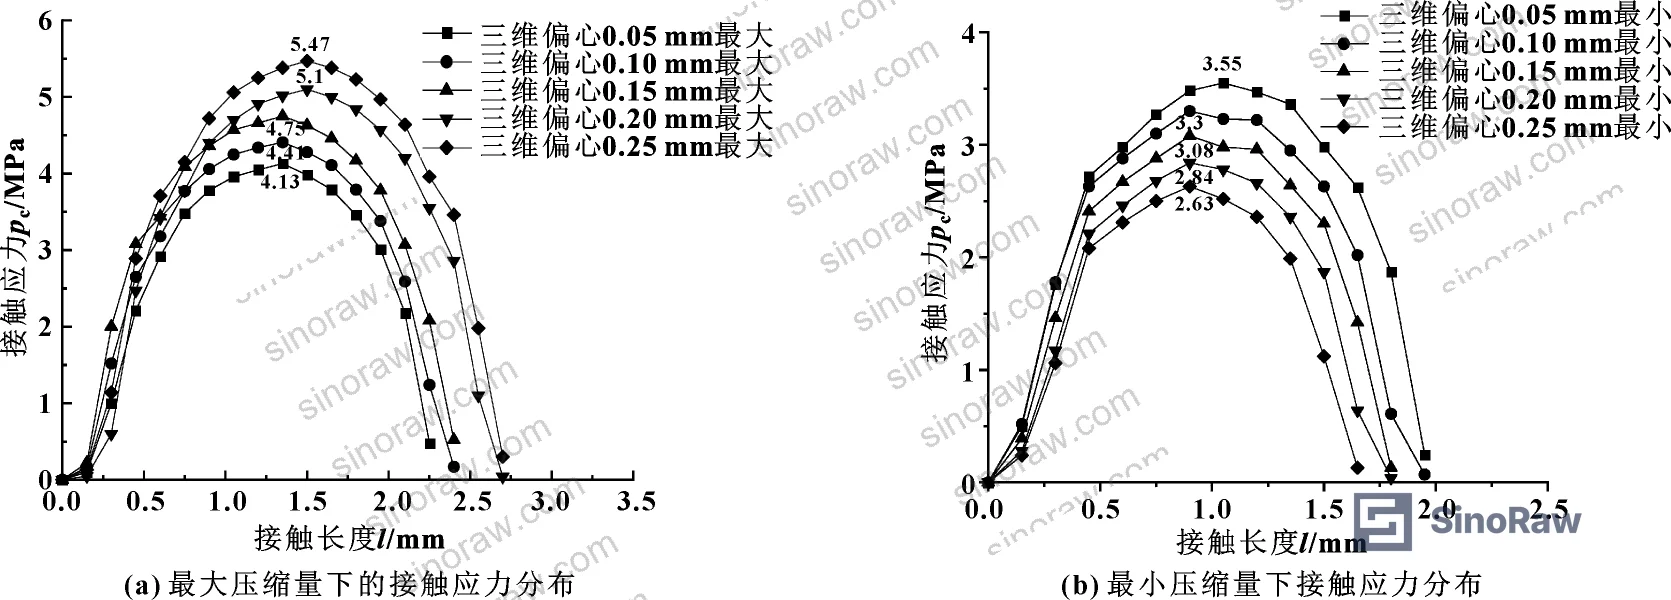
The data underlying this analysis comes from finite element simulation work conducted by a materials engineering team at a major South China university in collaboration with a Guangzhou-based mechanical engineering research institute — an institution that routinely develops sealing standards and test protocols for the Chinese industrial sector. Using ABAQUS software, researchers ran both 2D and 3D numerical models across five eccentricity levels (0.05 mm to 0.25 mm) and four O-ring diameters (14 mm to 60 mm), with a fixed cross-section diameter of 3.55 mm and nominal pre-compression of 0.65 mm. The Mooney-Rivlin hyperelastic constitutive model was used to represent the NBR rubber material, with experimentally fitted parameters C₁₀ = 1.4063 MPa and C₀₁ = 0.1713 MPa. The simulation results are directly applicable to the kind of pump shaft seals and valve stem O-rings that procurement teams source in volume.
For buyers sourcing pump and valve seals from Chinese manufacturers, this data provides a concrete basis for evaluating whether a supplier’s design validation process is credible — or whether they are handing you 2D simulation outputs dressed up as full qualification data.
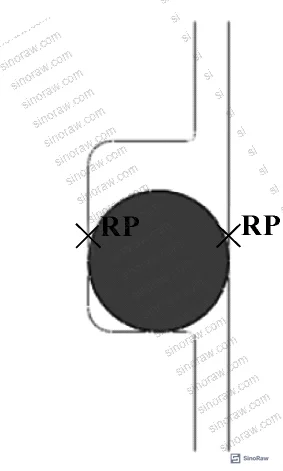
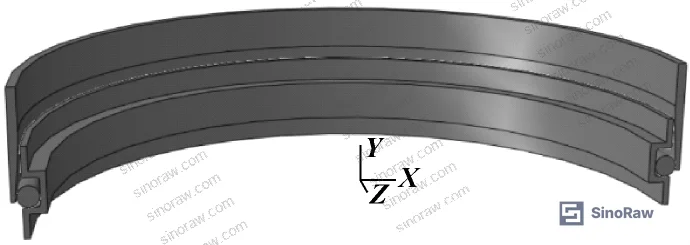
How O-Ring Eccentricity Distorts Contact Stress Predictions #
When an O-ring sits perfectly centered, the 2D axisymmetric model is legitimate. The contact stress is uniform around the ring, and the 2D simplification introduces negligible error. The simulation data confirms this directly: at zero eccentricity, the 2D and 3D models produce virtually identical contact stress distributions for a 50 mm diameter ring at 0.65 mm pre-compression, with maximum stress values that differ by less than the model’s mesh resolution tolerance.
The moment you introduce eccentricity, that equivalence breaks down — and it breaks down in a directionally predictable, asymmetric way.
At the side of maximum compression, the 2D model overestimates contact stress relative to the 3D result. At the side of minimum compression, the 2D model underestimates it. This is not a minor modeling artifact. It has direct consequences: the overestimate on the high side gives a false sense of adequate sealing margin, while the underestimate on the low side obscures the real leakage risk — which sits precisely at the minimum-compression zone.
The researchers fitted error prediction formulas against the 3D reference data:
- At maximum compression: y₁ = 0.0364x (where x is relative eccentricity, expressed as %)
- At minimum compression: y₂ = −0.144x
The asymmetry matters. The error growth rate at minimum compression is nearly four times faster than at maximum compression as eccentricity increases. That means the dangerous side — the low-contact-stress, high-leakage-risk zone — is precisely where the 2D model becomes least reliable.
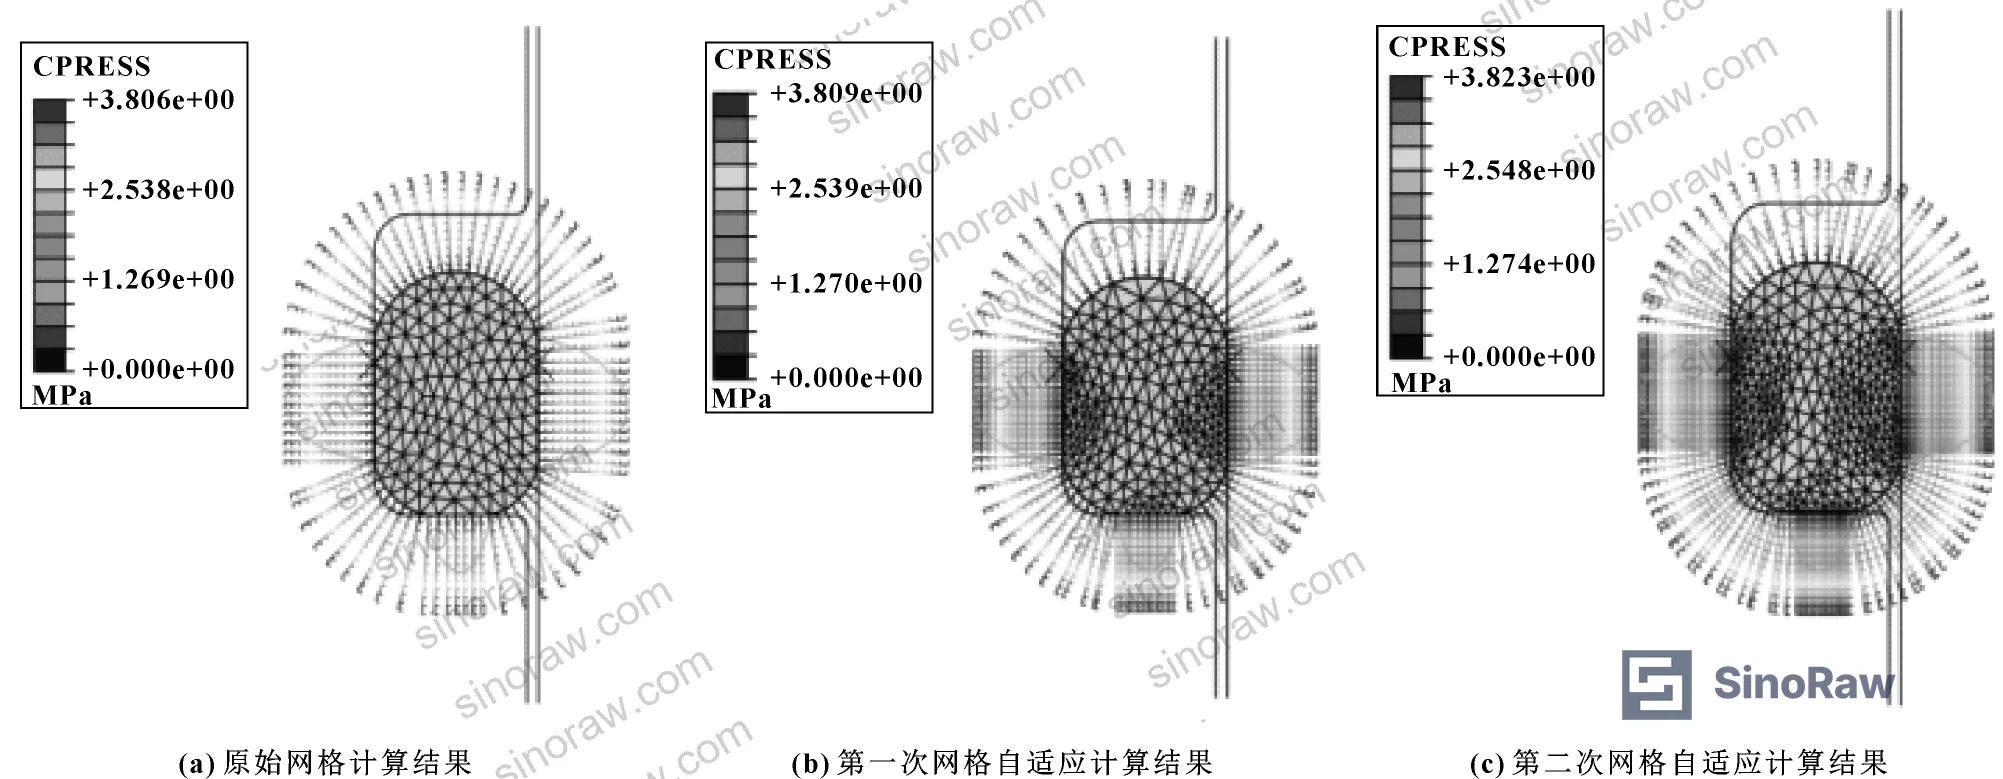
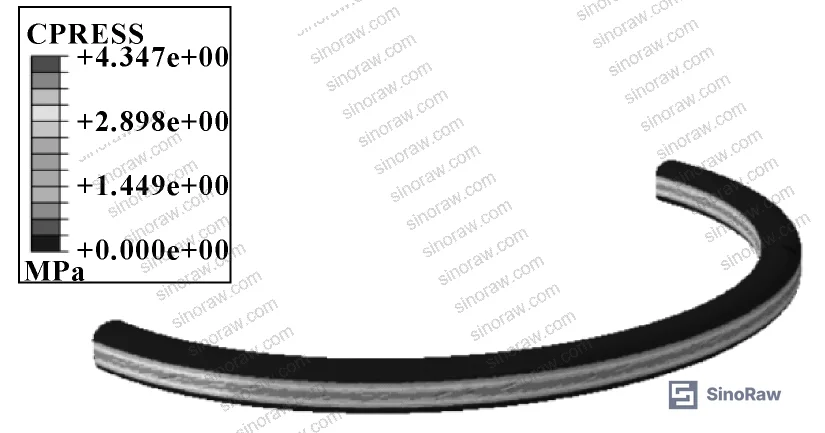
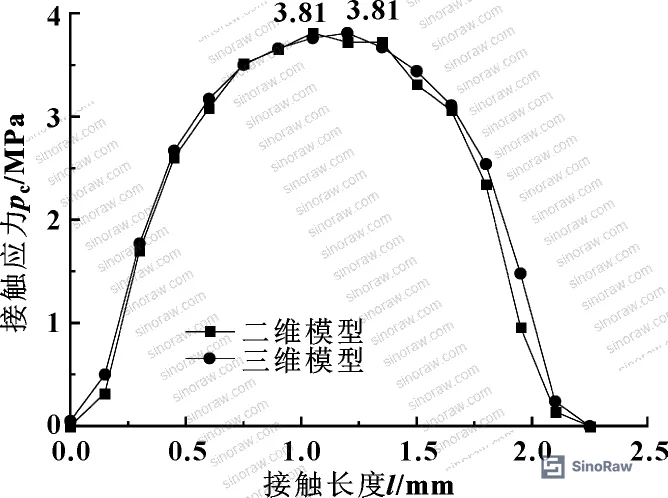
The table below summarizes the full eccentricity dataset. These are the numbers every sealing engineer working with eccentric installations should have on their desk.
| Eccentricity e (mm) | Relative Eccentricity x (%) | 2D Max Compression p₁ (MPa) | 3D Max Compression p₂ (MPa) | 2D Error y₁ (%) | 2D Min Compression p₃ (MPa) | 3D Min Compression p₄ (MPa) | 2D Error y₂ (%) |
|---|---|---|---|---|---|---|---|
| 0 | 0 | 3.81 | 3.81 | 0 | 3.81 | 3.81 | 0 |
| 0.05 | 7.69 | 4.15 | 4.13 | +0.48 | 3.52 | 3.55 | −0.85 |
| 0.10 | 15.38 | 4.45 | 4.41 | +0.91 | 3.25 | 3.30 | −1.52 |
| 0.15 | 23.08 | 4.78 | 4.75 | +0.63 | 2.98 | 3.08 | −3.25 |
| 0.20 | 30.77 | 5.15 | 5.10 | +0.98 | 2.72 | 2.84 | −4.22 |
| 0.25 | 38.46 | 5.55 | 5.47 | +1.46 | 2.47 | 2.63 | −6.08 |
All test conditions: cross-section diameter 3.55 mm, O-ring diameter 50 mm, nominal pre-compression 0.65 mm.
Honestly, most buyers over-specify the compound hardness and under-interrogate the eccentricity tolerance in their installation design. A supplier who can quote you a Shore A value to the decimal but cannot explain their 3D contact stress validation methodology is telling you something important about the depth of their engineering capability.
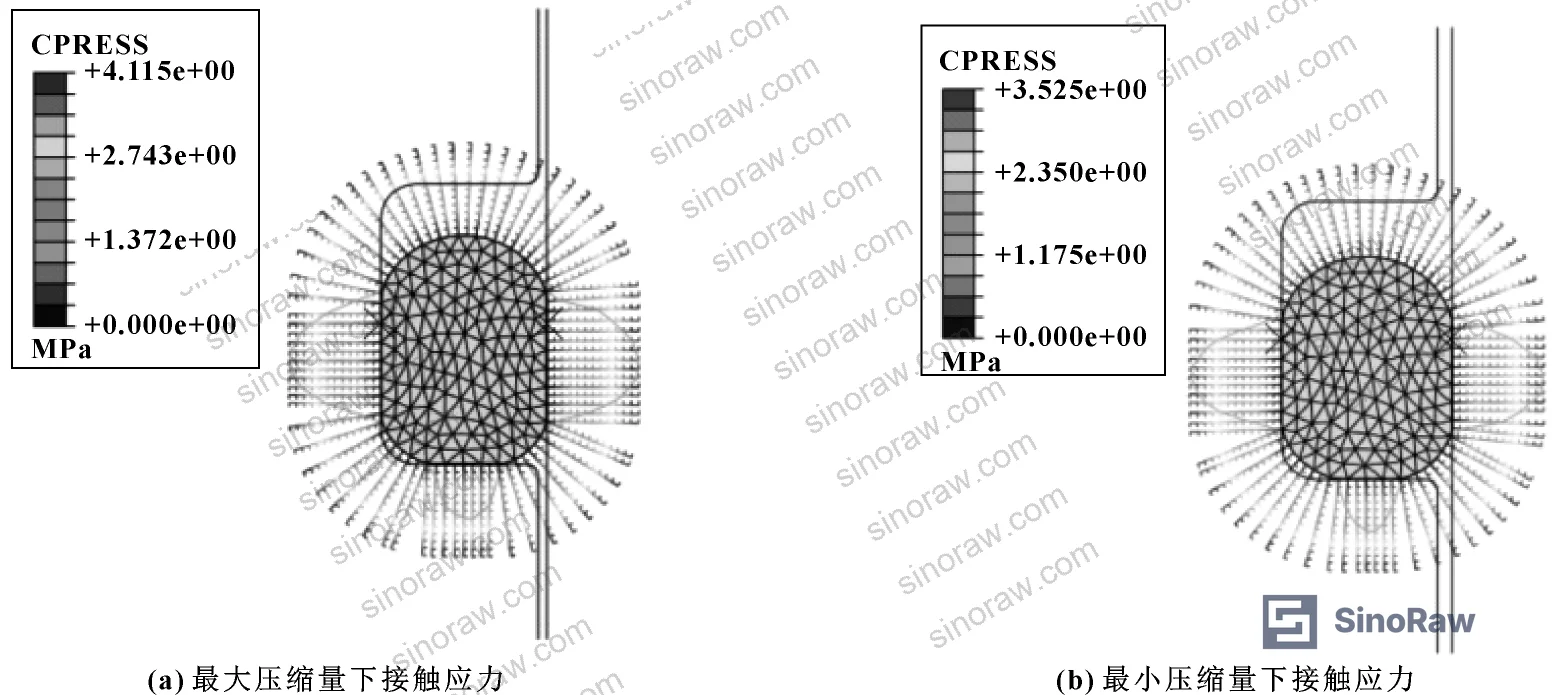
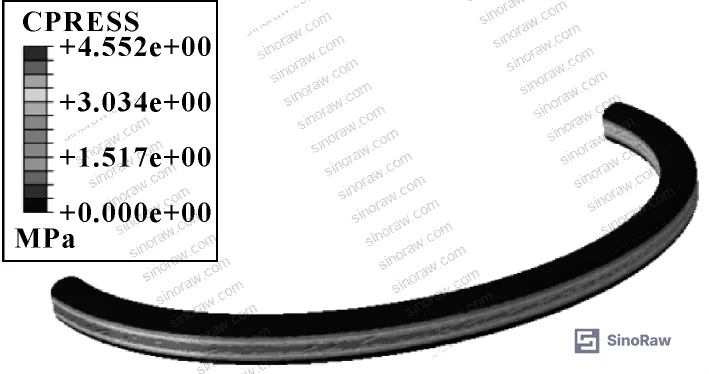
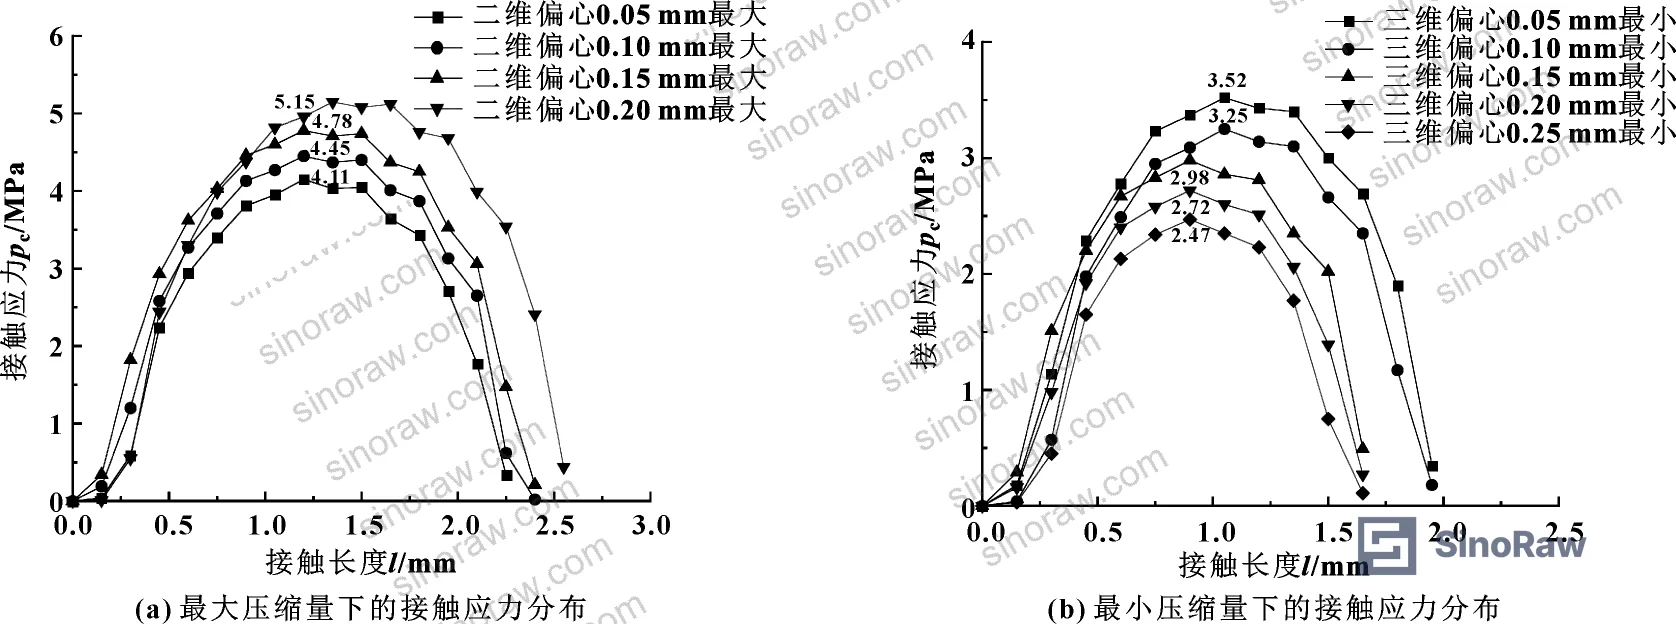
For buyers who need to understand how seal performance links to downstream fluid containment requirements, the IEC 62619:2022 Safety requirements for secondary lithium cells and batteries framework provides useful parallels for thinking about sealing performance standards in energy storage enclosures — a sector where O-ring eccentricity failures have caused costly field incidents.
O-Ring Diameter Effect on 2D Model Accuracy #
The eccentricity effect does not operate in isolation. Ring diameter is the second major variable, and it compounds the problem in a way that directly affects the most common small-bore pump and valve configurations.
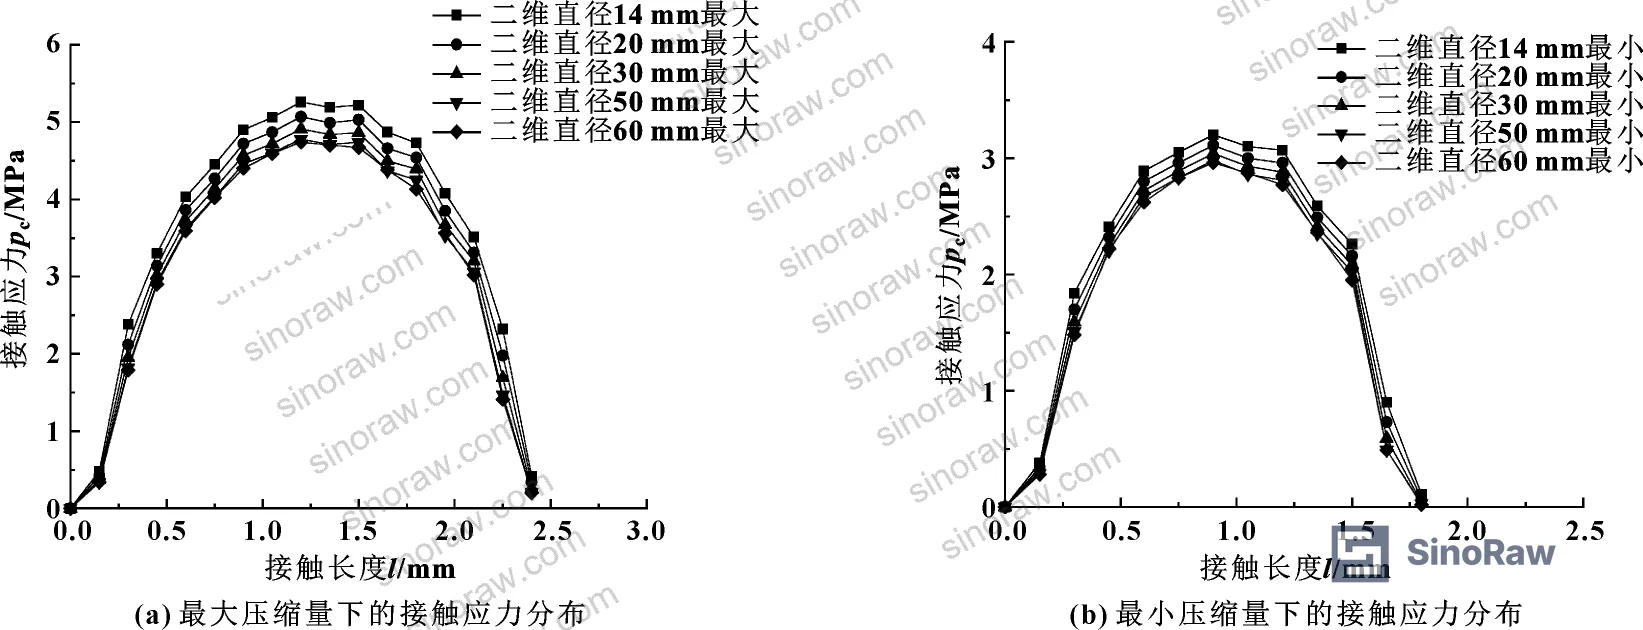
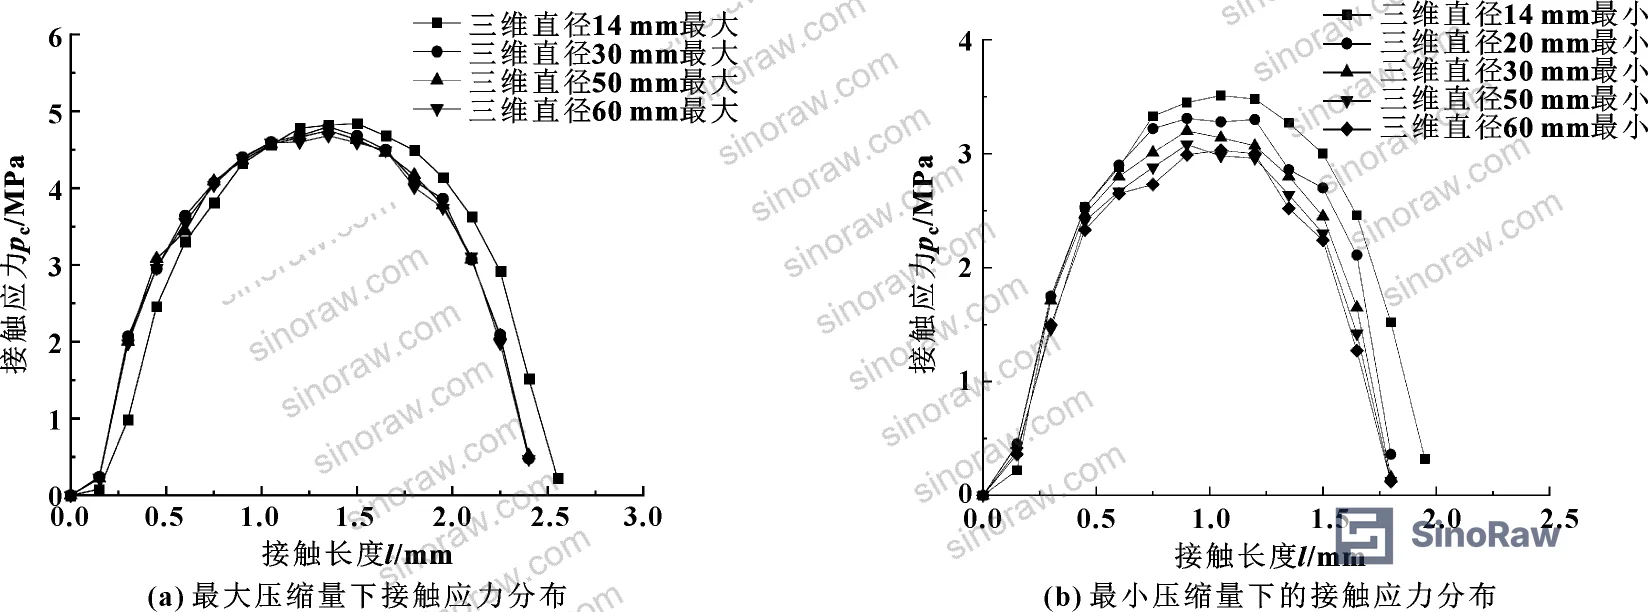
The simulation tested diameters of 14, 30, 50, and 60 mm, all at fixed cross-section 3.55 mm, pre-compression 0.65 mm, and eccentricity 0.15 mm. The results are unambiguous: as ring diameter decreases, 2D model error increases sharply — in both directions.
| O-Ring Diameter (mm) | 2D Max Compression p₁ (MPa) | 3D Max Compression p₂ (MPa) | Error y₁ (%) | 2D Min Compression p₃ (MPa) | 3D Min Compression p₄ (MPa) | Error y₂ (%) |
|---|---|---|---|---|---|---|
| 14 | 5.26 | 4.84 | +10.7 | 3.20 | 3.51 | −8.83 |
| 30 | 4.91 | 4.80 | +4.0 | 3.04 | 3.20 | −5.0 |
| 50 | 4.78 | 4.75 | +0.63 | 2.98 | 3.08 | −3.25 |
| 60 | 4.74 | 4.68 | +1.28 | 2.96 | 3.03 | −2.31 |
Fixed conditions: cross-section diameter 3.55 mm, eccentricity 0.15 mm, pre-compression 0.65 mm.
A 14 mm O-ring at 0.15 mm eccentricity produces a 2D minimum-compression error of −8.83%. To put that in physical terms: the 2D model says the low-compression zone of the ring is applying 3.20 MPa of contact stress. The 3D model — the more accurate representation — says it is actually 3.51 MPa. That inversion is counterintuitive but critical: it means the real ring is actually maintaining better contact than the 2D model predicts at the low side, which sounds reassuring until you realize the 2D model is also simultaneously overestimating by +10.7% on the high side. The ring is seeing a much more uneven stress distribution than any 2D analysis would suggest.
The power-law error correction formulas for the diameter effect:
- At maximum compression: y₁ = 1885.63 × x⁻¹·⁹⁶⁴
- At minimum compression: y₂ = −78.04 × x⁻⁰·⁸²⁶
where x is the O-ring diameter in mm.
In supplier qualification, we have seen multiple cases where a Chinese manufacturer submitted 2D FEA contact stress data for 14–20 mm O-rings intended for small-bore hydraulic valve bodies — and those results were presented without any eccentricity correction or 3D validation. Three of the five samples from one audit batch showed leakage in functional testing at operating pressures where the 2D simulation predicted adequate sealing margin. The error was not in the rubber compound; it was in the design validation model.
Most procurement teams don’t realize that the standard guidance documents most Chinese O-ring manufacturers reference for FEA validation were written assuming axisymmetric installation — which is never strictly true in dynamic valve or pump applications. The IEC 61960-3 standard for secondary lithium cells and related sealing performance requirements for enclosures have pushed some sectors to demand 3D simulation output, but this has not yet become a universal procurement requirement in fluid sealing. It should be.
For applications involving industrial electrical enclosures, cable entry seals, and connector O-rings — where bore concentricity tolerances are often loose — the diameter-eccentricity interaction documented here represents a genuine qualification risk.
Practical Guidance for Buyers #
If you are sourcing O-ring seals for pump housings, valve stems, or any rotating/reciprocating shaft application, the single most important question to add to your supplier qualification checklist is: how did you validate contact stress under eccentric installation conditions?
A supplier who answers with 2D FEA output only is not necessarily incompetent — but they are giving you an incomplete picture. The data above shows that for small-diameter rings (14–20 mm) at realistic eccentricity levels, 2D models can misrepresent contact stress by 8–10% at the critical low-compression zone. That margin directly determines whether your seal holds or weeps.
Specifically, look for suppliers who either run full 3D FEA for eccentric cases, or who apply a documented, calibrated error-correction formula to their 2D outputs. The correction formulas derived from the 3D comparison — y₁ = 0.0364x and y₂ = −0.144x for eccentricity, and the power-law forms for diameter effects — give a technically defensible path to correcting 2D results. A supplier who knows these formulas exists, and can apply them, has real design engineering depth.
At Sinoraw, we work as a Guangzhou-based B2B sourcing service connecting overseas buyers with verified Chinese manufacturers — our role is to help you identify, evaluate, and filter suppliers before you issue an RFQ, not after you receive a batch of leaking parts. When it comes to sealing components, the gap between a manufacturer with genuine FEA capability and one with a copy of ABAQUS and no validation methodology is invisible from a product catalog — but it becomes very visible in the field.
For applications requiring traceable dimensional and performance standards, also refer to UN 38.3 lithium battery transport testing which sets sealing performance precedents for pressurized enclosures relevant to how contact stress standards are interpreted across sectors.
Need help identifying qualified suppliers for eccentric-duty O-ring seals and valve packing components? Talk to our sourcing team →
Supplier Qualification Questions #
- For O-ring diameters below 30 mm used in eccentric installation conditions, can you provide 3D FEA contact stress results from ABAQUS or equivalent software — not just 2D axisymmetric output — showing contact stress distribution at both maximum and minimum compression zones?
- At a relative eccentricity of 23.08% (eccentricity 0.15 mm against pre-compression 0.65 mm), what is the maximum contact stress your model predicts at the low-compression zone, and how does that compare to your 3D reference calculation for the same geometry?
- What Mooney-Rivlin material constants (C₁₀ and C₀₁) do you use in your FEA model for NBR O-rings, and are these derived from your own tensile/biaxial test data or taken from generic material databases?
- For a 14 mm O-ring with 0.15 mm eccentricity, your 2D model will overestimate contact stress at maximum compression by approximately 10.7% relative to 3D results — what correction methodology does your design team apply to account for this systematic error before issuing a design release?
- What is the maximum relative eccentricity (eccentricity divided by nominal pre-compression, expressed as a percentage) that your standard O-ring groove designs are qualified to accommodate, and do you have FEA data showing contact stress remains above leakage threshold at that eccentricity limit?
Sourcing Checklist #
- ☐ Supplier provides 3D FEA contact stress validation data (not 2D-only) for O-ring diameters ≤30 mm in eccentric service
- ☐ FEA rubber material model uses Mooney-Rivlin parameters experimentally fitted to the actual compound, with C₁₀ and C₀₁ values documented in the design package
- ☐ Contact stress at minimum compression zone ≥ minimum sealing pressure threshold under worst-case eccentricity (≥0.15 mm or relative eccentricity ≥23%) as verified by 3D model output
- ☐ Supplier can demonstrate that 2D model error at maximum compression does not exceed +10.7% for any ring diameter in their product range, per the diameter-correction formula y₁ = 1885.63 × d⁻¹·⁹⁶⁴
- ☐ O-ring groove tolerances specified to limit installed eccentricity to ≤38.46% relative eccentricity (≤0.25 mm for 0.65 mm pre-compression) — the upper limit of validated simulation data
- ☐ Batch-release test includes dimensional check confirming O-ring diameter within ±0.1 mm of nominal to maintain model accuracy
- ☐ Supplier references a recognized sealing standard (ISO, DIN, or GB/T equivalent) for groove geometry design, not only internal specifications
- ☐ Sample evaluation includes functional leakage test at operating pressure with confirmed shaft/bore eccentricity equal to or exceeding the design specification value
Key Specifications Table #
| Parameter | Recommended Value | Verification Method |
|---|---|---|
| Maximum allowable relative eccentricity (eccentricity / pre-compression) | ≤38.46% (0.25 mm eccentricity at 0.65 mm pre-compression) | 3D FEA model; dimensional CMM measurement of installed assembly |
| Minimum contact stress at low-compression zone under worst-case eccentricity | ≥2.47 MPa (3D-corrected value at 38.46% relative eccentricity) | 3D FEA simulation; functional leakage test at rated pressure |
| 2D model error correction — maximum compression | y₁ = 0.0364x (x = relative eccentricity %) | Cross-check against 3D ABAQUS output; error should not exceed +1.46% at x = 38.46% |
| 2D model error correction — minimum compression | y₂ = −0.144x (x = relative eccentricity %) | Cross-check against 3D ABAQUS output; error should not exceed −6.08% at x = 38.46% |
| O-ring diameter threshold for 3D FEA requirement | ≤30 mm (2D error >4% at diameter 30 mm) | Mandatory 3D model submission for rings ≤30 mm diameter in eccentric service |
| Mooney-Rivlin material constants (NBR) | C₁₀ = 1.4063 MPa, C₀₁ = 0.1713 MPa (or supplier-fitted equivalent) | Tensile and biaxial rubber test data; FEA convergence validation |
Can’t find a supplier meeting these specs? Submit your requirements and we’ll match you within 48 hours.
References #
Data source: Contact Stress Analysis of Eccentric O-Ring Seals Using Two-Dimensional and Three-Dimensional Finite Element Models, B. Kong et al., Tribology Transactions, 2025
Frequently Asked Questions #
Why does a small amount of eccentricity cause such a large simulation error for small O-rings?
For a small-diameter ring, the same absolute eccentricity represents a proportionally larger fraction of the ring’s geometry. At 14 mm diameter with 0.15 mm eccentricity, the circumferential variation in compression is large relative to the ring’s total cross-section path — the 3D stress gradient around the ring is steep, and a 2D model cannot capture that gradient at all. The 2D model is forced to calculate with a single, uniform compression value, which increasingly misrepresents the actual stress state as diameter decreases.
What is the practical difference between 2D and 3D FEA for O-ring qualification?
2D FEA treats the O-ring as a cross-section problem with perfect rotational symmetry — fast to solve, widely used, and accurate only when that symmetry assumption holds. 3D FEA models the full ring geometry including circumferential variation in compression. The 3D approach is computationally heavier but captures what actually happens in an eccentric installation: different zones of the ring carry different loads simultaneously.
Is the Mooney-Rivlin model adequate for all O-ring compounds, or only NBR?
Mooney-Rivlin is widely applicable to rubbers in the moderate strain range typical of O-ring pre-compression, and it is the industry default for this type of analysis. It is not ideal for compounds that undergo significant stress relaxation or exhibit strong Mullins effect. For highly specialized compounds — FFKM, silicone at extreme temperatures, or EPDM in steam service — the material constants must be re-fitted from actual test data; published generic constants introduce an additional error layer on top of the eccentricity modeling errors described here.
What level of eccentricity is typical in real pump and valve installations?
Shaft runout in standard industrial pumps is commonly in the 0.05–0.15 mm range for well-maintained equipment; worn bearings or loose bore tolerances can push this toward 0.25 mm or beyond. At 0.15 mm eccentricity (23.08% relative eccentricity for a 0.65 mm pre-compression ring), the 2D minimum-compression error is already −3.25% for a 50 mm ring and −5.0% for a 30 mm ring. This is not a rare edge case — it is a normal operating condition that most standard qualification procedures fail to address.
Can I use the error-correction formulas directly to adjust a supplier’s 2D simulation data?
Yes, with two caveats. The formulas y₁ = 0.0364x and y₂ = −0.144x (eccentricity effect) and y₁ = 1885.63 × d⁻¹·⁹⁶⁴ and y₂ = −78.04 × d⁻⁰·⁸²⁶ (diameter effect) were derived for a specific geometry: cross-section diameter 3.55 mm, pre-compression 0.65 mm, NBR compound with the stated Mooney-Rivlin parameters. Applying them to significantly different cross-section sizes or compound types without re-validation introduces its own uncertainty. Use them as a screening tool to flag whether a supplier’s 2D results are likely materially wrong — not as a substitute for requesting proper 3D validation data.
Published by sinoraw.com Technical Team | Request a sourcing quote


