

TL;DR #
At 12 wt% GNP loading, the particle network structure in PBT matrix reaches a critical transition point where storage modulus becomes essentially frequency-independent — this is the inflection that drives the steepest thermal conductivity gain. For buyers sourcing thermally conductive PBT compounds, this 12% threshold is the minimum meaningful specification; below it, you are paying for filler without the network connectivity that makes it work. Before issuing an RFQ, request rheological sweep data alongside thermal conductivity values — if a supplier can only provide the λ number without the G′ frequency response, you cannot verify the dispersion quality that determines real-world performance.
Overview #
Thermally conductive PBT compounds are one of those categories where supplier claims diverge wildly from measured performance — and the gap almost always traces back to filler dispersion quality rather than filler content. The data reviewed here comes from a controlled university-industry collaboration testing series covering eight loading levels of graphene nanoplatelets (GNPs) in PBT matrix, from 0 to 14 wt%, using laser flash thermal conductivity measurement (ASTM E1461), rotational rheometry at 240°C, field-emission SEM at 3000× magnification, and volume resistivity testing per GB/T 1410. The GNP grade used had a particle size range of 90–130 μm — a relatively large platelet that favors thermal pathway formation but also introduces processing complications at higher loadings.
Neat PBT as an engineering resin carries a thermal conductivity of just 0.23 W/(m·K). For electronics, automotive connectors, and LED housings — the primary application zones — that baseline is unworkable. The whole point of GNP addition is to build a connected thermal pathway through an otherwise insulating matrix. What the test data makes clear is that this pathway formation is nonlinear: it follows an S-to-J growth curve with a critical network percolation zone between 8 and 12 wt%.
For buyers evaluating Rubber & Plastic Additives or thermally enhanced polymer compounds, the microstructure and rheology data are at least as important as the headline thermal conductivity number.
Thermal Conductivity of GNP-Filled PBT: Loading Thresholds That Actually Matter #
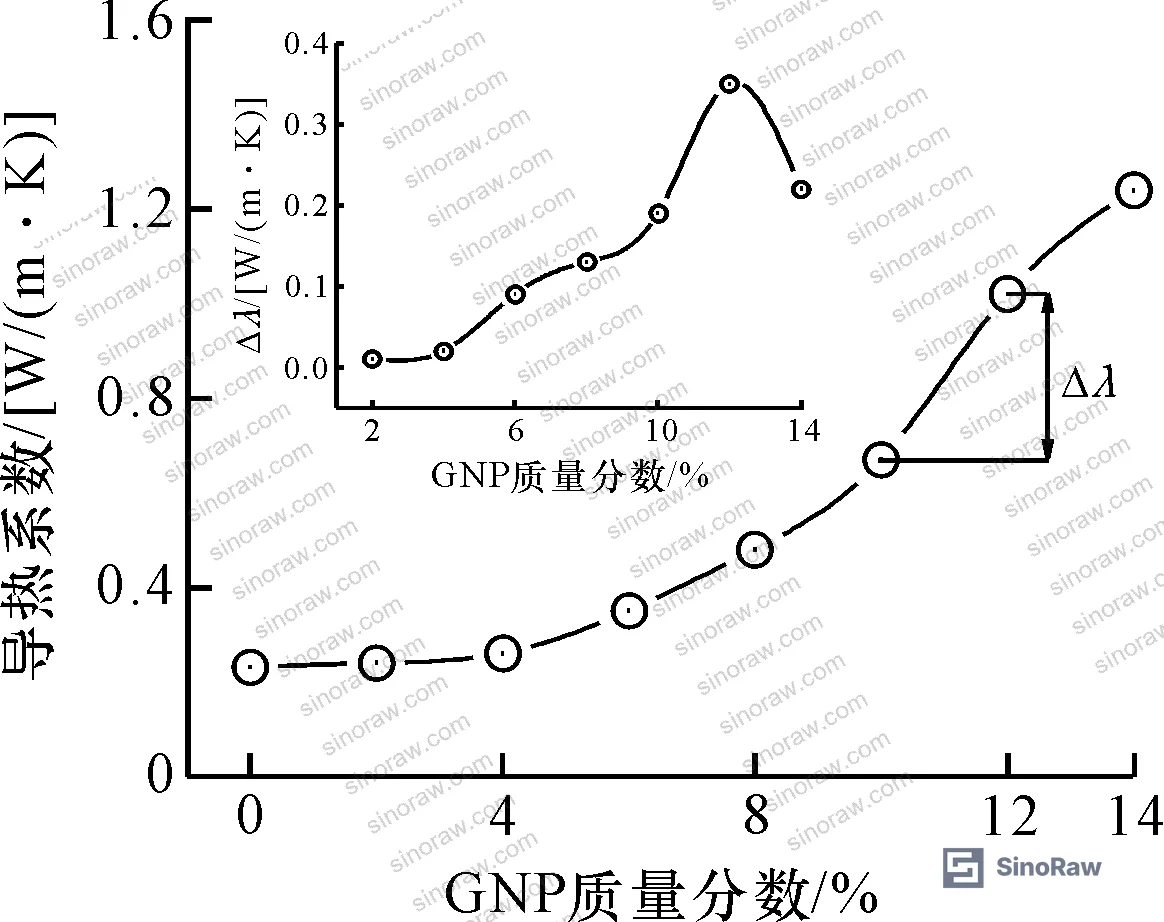
The measured thermal conductivity of neat PBT in this study was 0.23 W/(m·K), consistent with the published baseline range of 0.24–0.27 W/(m·K) for unfilled grades. With GNP additions tested across 2, 4, 6, 8, 10, 12, and 14 wt%, the composite reached 1.24 W/(m·K) at 14 wt% loading — an improvement of 439.1% over the neat resin.
That headline number looks impressive. The more useful finding is the incremental gain curve.
Below 8 wt%, the Δλ (step change in thermal conductivity between adjacent loading levels) grows slowly in an S-shaped pattern. GNP platelets at low concentrations are isolated in the matrix, thermal resistance between particles is high, and the connected pathway that actually conducts heat hasn’t formed yet. Buyers who specify compounds in the 2–6% range are often chasing a moderate improvement that requires significantly tighter dispersion control to achieve reliably — and most production suppliers aren’t operating at that precision.
From 8 to 12 wt%, Δλ switches to a J-curve growth pattern. This is the percolation zone. Platelets begin bridging across the matrix, thermal resistance drops, and the conductivity gain per unit of added filler is at its highest. The 12 wt% loading point represents the maximum Δλ across the entire test range — meaning this is where each additional percent of filler delivers the most thermal benefit.
Above 12 wt%, conductivity continues to rise (reaching 1.24 W/(m·K) at 14%), but the incremental gain per added percent begins declining. The network is essentially complete; you’re adding filler cost without proportional performance return.
Comparative context matters here. Prior work with multi-walled carbon nanotubes (MWCNTs) in PBT at 12 wt% reached only 0.86–1.03 W/(m·K) depending on aspect ratio. Boron nitride (BN) at 25 μm particle size offered competitive thermal performance but no rheological network formation. GNPs at 12–14 wt% consistently outperform both alternatives in thermal conductivity per unit loading, which is why this filler system is attracting serious supplier interest right now.
Honestly, most buyers over-specify the filler content when they haven’t validated that their molder can achieve proper dispersion. A well-dispersed 10% GNP compound will outperform a poorly dispersed 14% compound on every thermal metric. Dispersion verification via SEM or rheology is non-negotiable before locking in a supplier specification.
For buyers working on applications where both thermal management and electrical insulation are required — LED drivers, motor housings, EV charging components — this data is particularly relevant. Testing per ASTM D638 Standard Test Method for Tensile Properties of Plastics should also be included in your qualification protocol, as filler addition at these levels invariably affects mechanical properties that need to be tracked alongside thermal gains.
Thermal conductivity comparison: GNP vs. alternative fillers in PBT at comparable loadings
| Filler Type | Loading Level | Thermal Conductivity | Notes |
|---|---|---|---|
| GNP (this study) | 14 wt% | 1.24 W/(m·K) | 439.1% improvement vs. neat PBT |
| GNP (prior work) | 13 wt% | 1.21 W/(m·K) | Mechanical properties decline noted |
| MWCNT (long aspect ratio) | 12 wt% | 1.03 W/(m·K) | Higher cost per kg, processing difficulty |
| MWCNT (short aspect ratio) | 12 wt% | 0.86 W/(m·K) | Easier processing, lower thermal gain |
| Neat PBT (baseline) | 0% | 0.23 W/(m·K) | Reference value |
Rheological Behavior of GNP/PBT Composites: Reading Dispersion Quality Through Flow Data #
This is where most procurement engineers stop reading — and it’s a mistake. Rheological data is the fastest way to verify filler network formation without destructive testing, and any serious GNP compound supplier should be able to provide it.
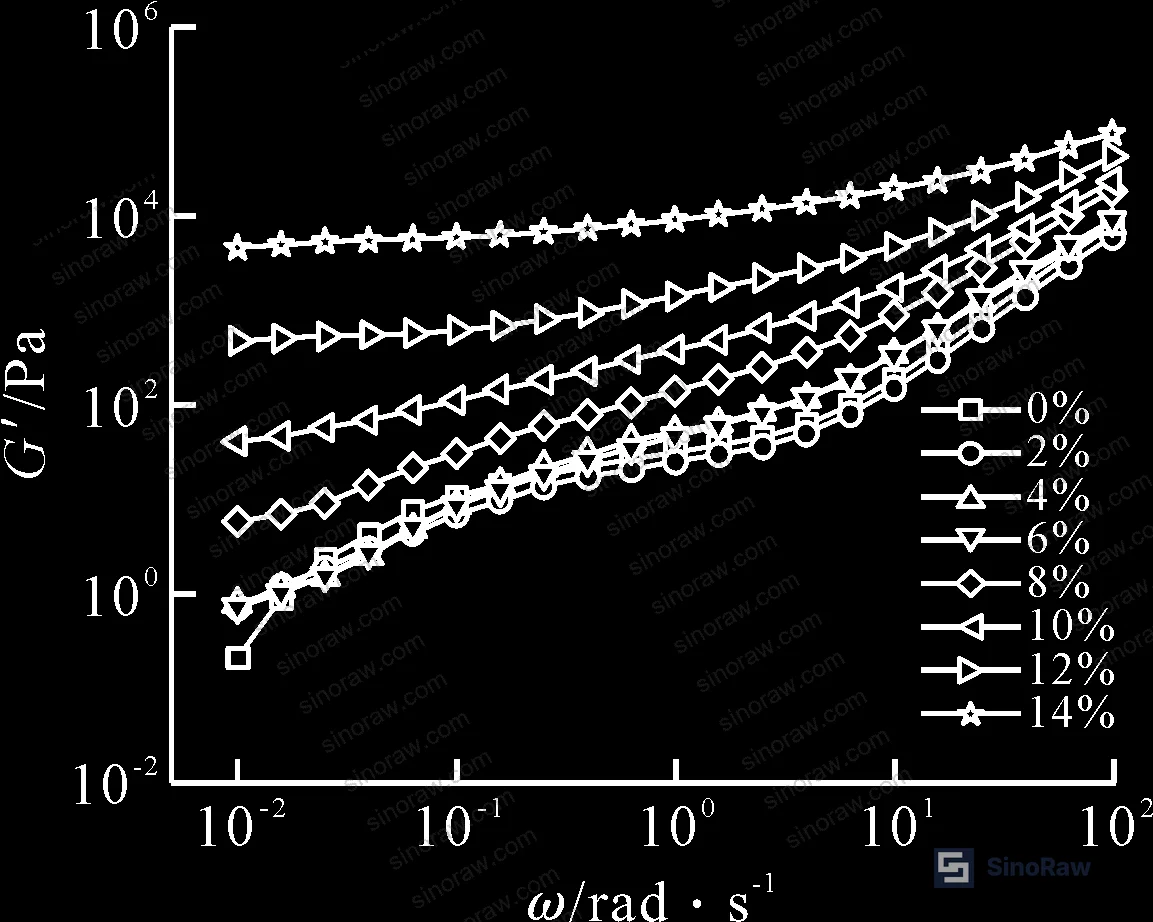
The storage modulus (G′) sweep data at 240°C shows a clear progression. At 2–6 wt% GNP, G′ changes relatively little across frequencies, and at 2 wt% there’s actually a minor decrease — the platelet morphology is acting as a lubricant, slightly reducing the elastic response. This is a known effect with sheet-like fillers at low concentrations and doesn’t mean the compound is defective, but it does mean you’re not getting network contribution yet.
As loading increases, G′ in the low-frequency region grows by approximately one order of magnitude across the test range. The slope of G′ versus angular frequency (ω) in the terminal region tells you exactly where the network stands:
| GNP Content (wt%) | Low-Frequency G′ Slope | Interpretation |
|---|---|---|
| 0 (neat PBT) | 1.65 | Classic polymer terminal behavior |
| 2 | 1.10 | Slight network influence |
| 4 | 1.04 | Marginal improvement |
| 6 | 0.96 | Weak network beginning |
| 8 | 0.75 | Clear non-terminal behavior |
| 10 | 0.44 | Strong network contribution |
| 12 | 0.13 | Near-solid-like response |
| 14 | 0.11 | Fully developed network |
A slope below 0.5 indicates a dominant particle network. At 12 wt%, the slope drops to 0.13 — meaning G′ is essentially independent of frequency. This is the “second plateau” phenomenon, a reliable signature of a percolated particle network. If a supplier’s compound at claimed 12% GNP loading doesn’t show this plateau in a frequency sweep, the dispersion is inadequate regardless of what the thermal conductivity certificate says.
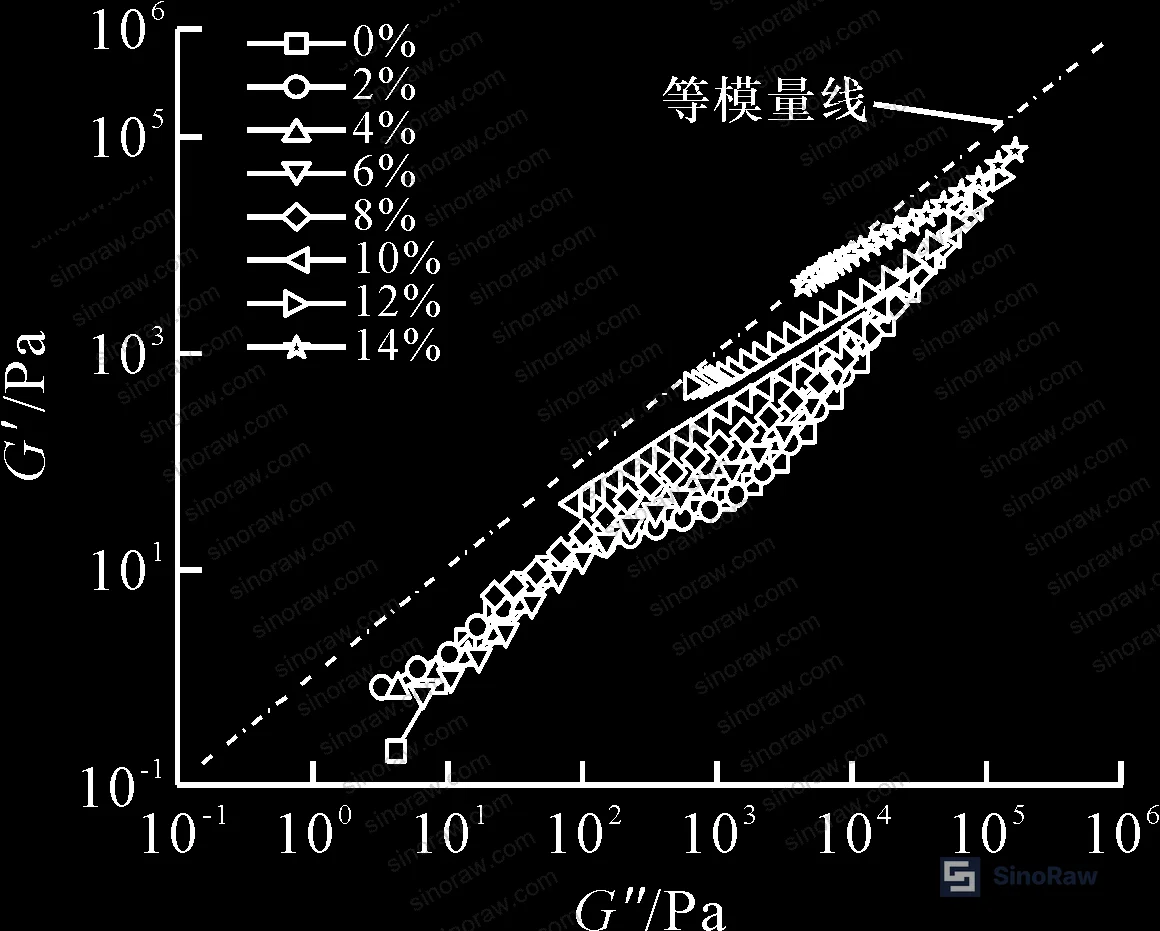
The Han plot (G′ vs. G″) confirms the same transition. Neat PBT shows classic liquid-like behavior, deviating toward the loss-dominated region at low frequencies. As GNP content reaches and exceeds 8 wt%, the curves progressively converge toward the equal-modulus line, indicating a shift from liquid-like to solid-like melt behavior. This elastic enhancement is consequential for processing: injection molders working with these compounds need to account for increased melt elasticity, which affects gate design, hold pressure, and warpage behavior.
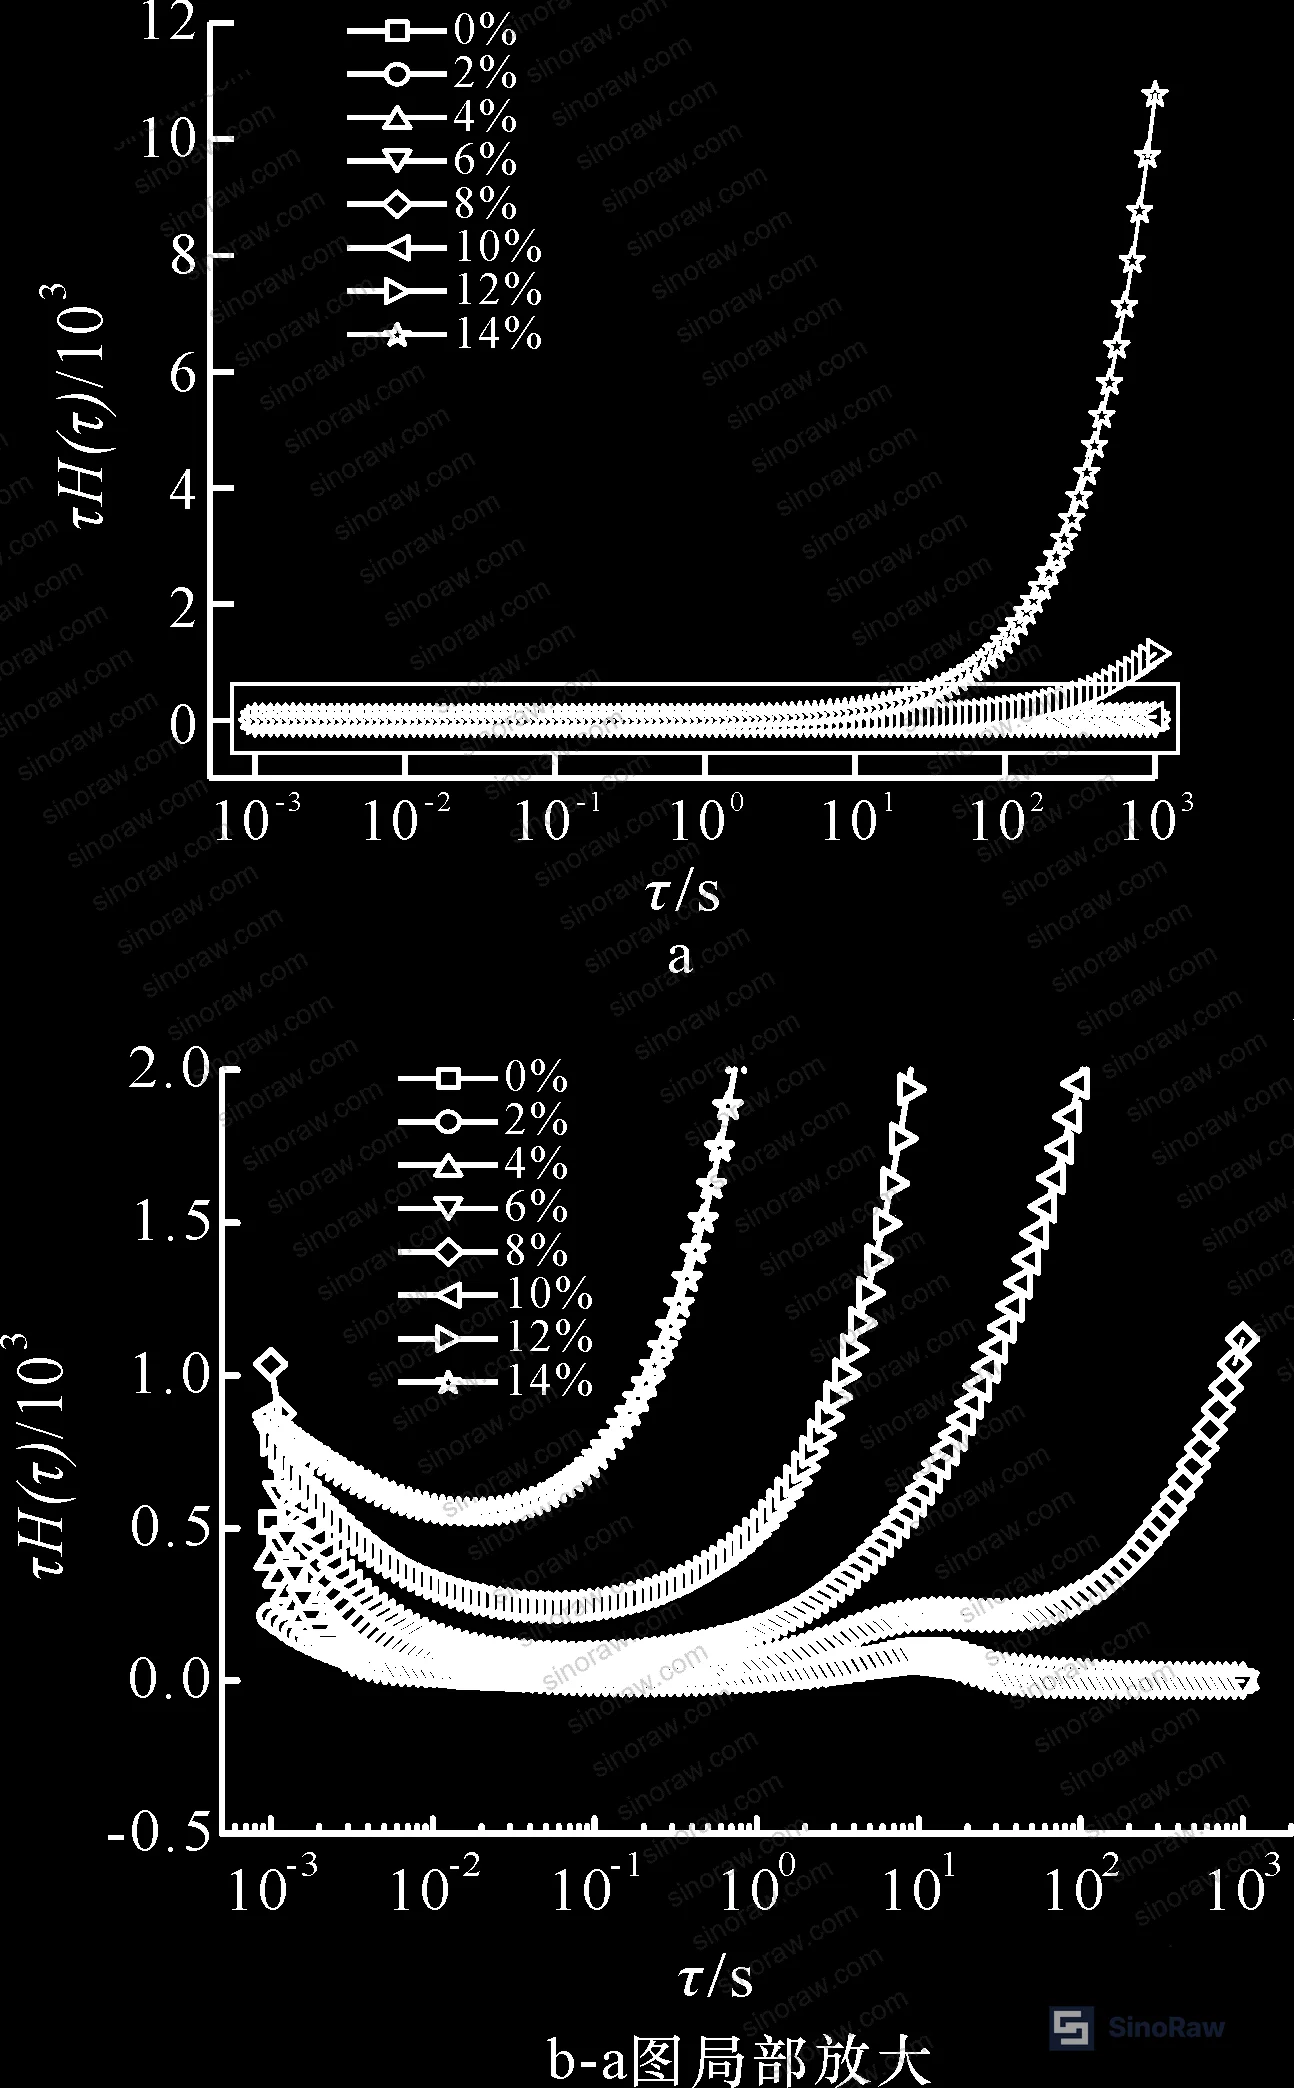
Weighted relaxation spectra add another layer of detail. Neat PBT shows a well-defined relaxation peak at 10.8 seconds — normal chain dynamics. At low GNP loadings (2–6 wt%), the relaxation time actually shortens to as low as 6.05 s before recovering to 10.88 s at 6%, confirming the competing lubrication vs. adsorption effects. At 8 wt%, relaxation time extends to 13.63 s and a long-time tail emerges. Above 10%, the relaxation peak disappears entirely — the network structure is so constraining that molecular chains cannot fully relax within the measurement window.
This matters for processing qualification. A supplier who hasn’t characterized the relaxation behavior of their compound cannot give you reliable guidance on residence time limits, regrind compatibility, or degradation risk during molding — all of which affect part quality in production.
For compound grading that also requires tracking melt flow behavior under standardized conditions, ASTM D1238 Standard Test Method for Melt Flow Rates of Thermoplastics provides a complementary single-point check that many quality departments already use — though it cannot replace a full frequency sweep for network verification.
Microstructure and Electrical Insulation: What SEM and Resistivity Testing Reveal #
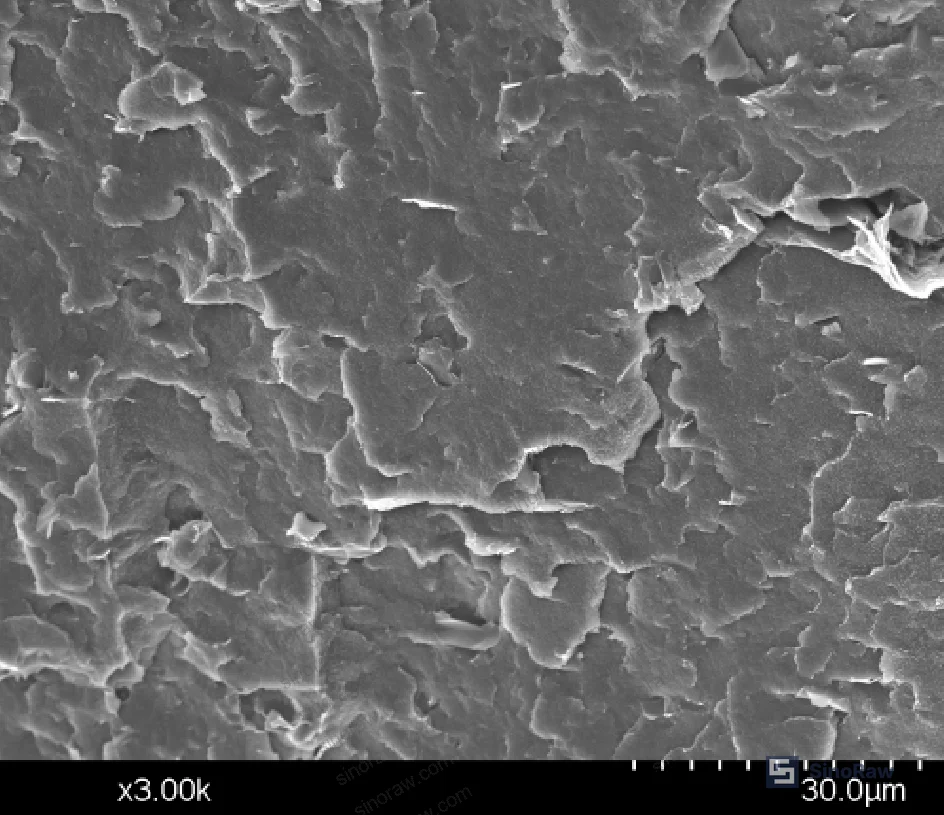
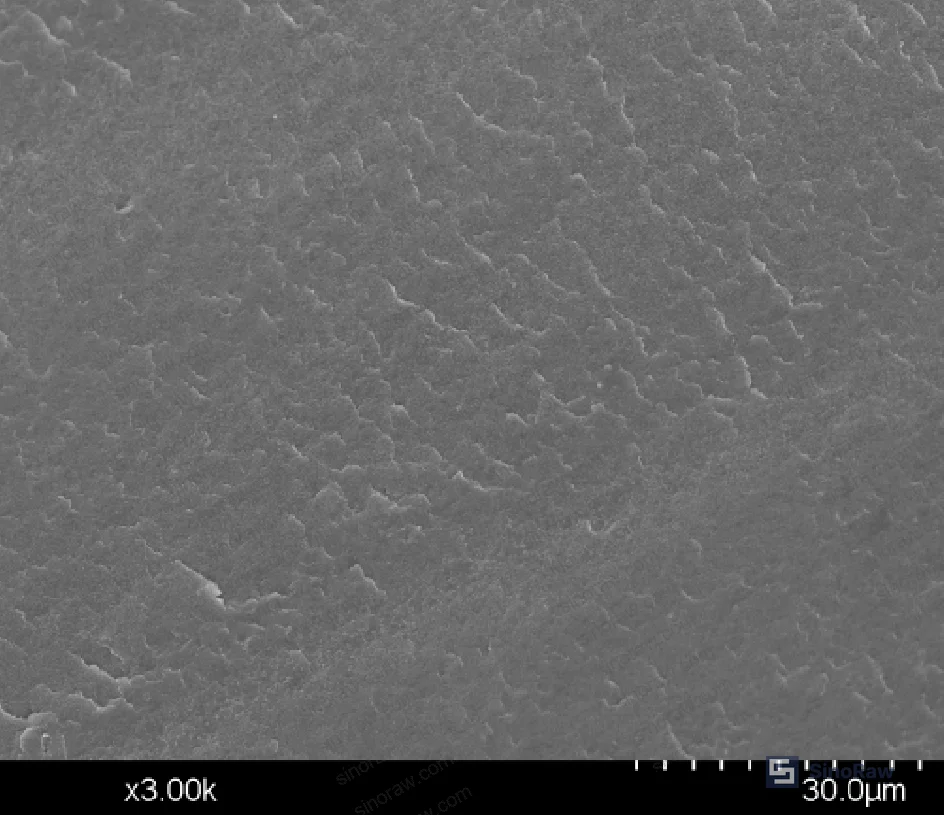
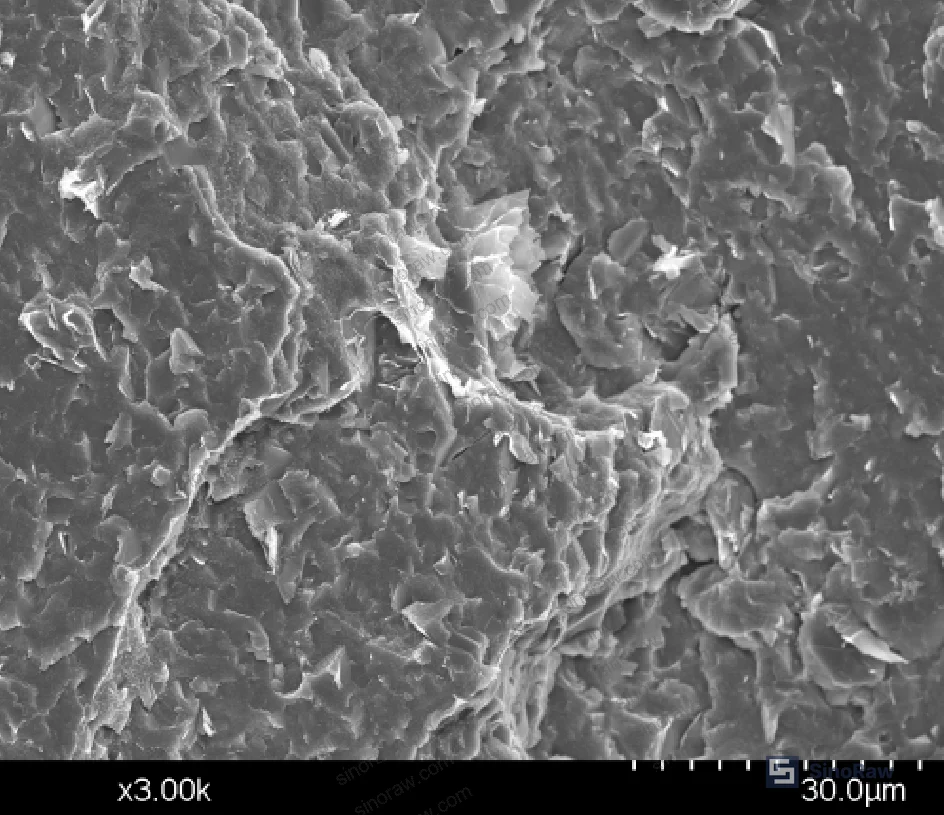
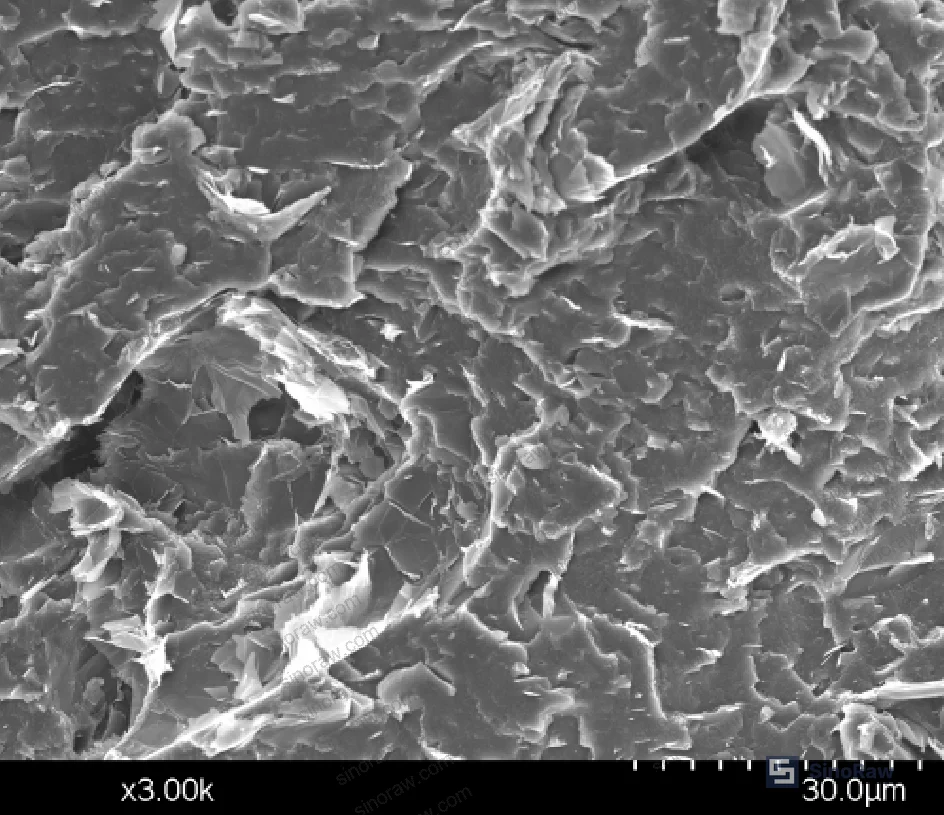
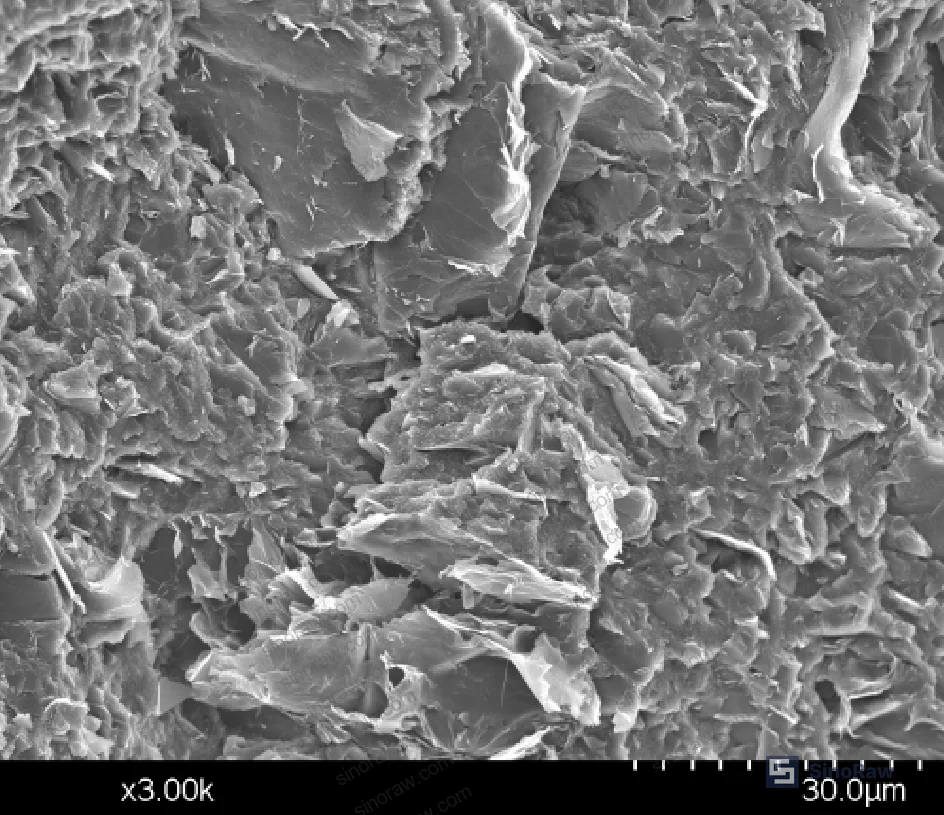
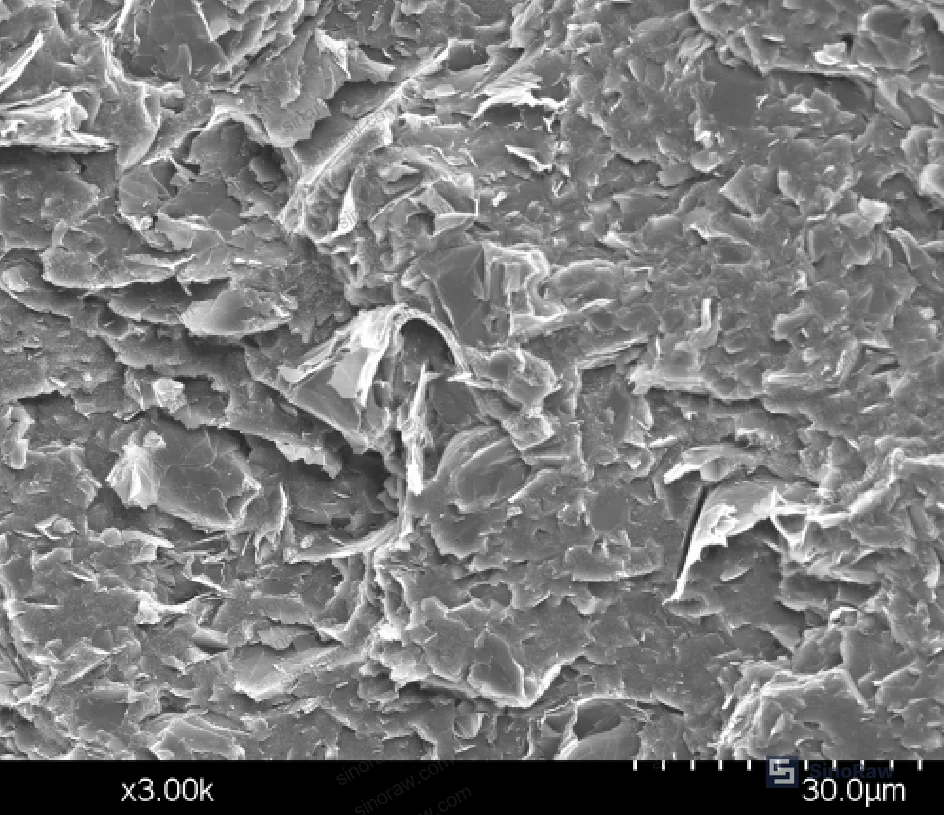
SEM examination at 3000× magnification, following liquid-nitrogen cryogenic fracture and 90-second gold sputter coating, tracks how GNP distribution evolves with loading.
In the neat PBT fracture surface, the cross-section is smooth and featureless — rapid crack propagation through a homogeneous matrix. As GNP is added, the fracture surface develops wrinkles and surface features corresponding to platelet-matrix delamination and platelet fracture under loading. At 6 wt%, GNPs appear sparsely scattered — isolated distribution, consistent with the weak network signal in the rheology.
At 8 wt%, distribution becomes noticeably more uniform across the matrix cross-section. Then, from 12 wt% onward, stacking of GNP platelets becomes visible in the SEM images. This stacking is the structural basis of the thermal percolation network — the platelets connect into continuous pathways rather than remaining as isolated thermal islands. The SEM-rheology-thermal data all tell the same story: 12 wt% is where the network matures.
In supplier qualification, we’ve seen this mismatch play out directly: a compound claimed at 12 wt% GNP loading tested at the correct thermal conductivity, but SEM revealed non-uniform distribution with GNP-depleted zones. The rheological G′ slope was 0.45 — correctly identifying inadequate network formation that the single-point thermal measurement had masked because the sample happened to be cut from a region of higher local concentration.
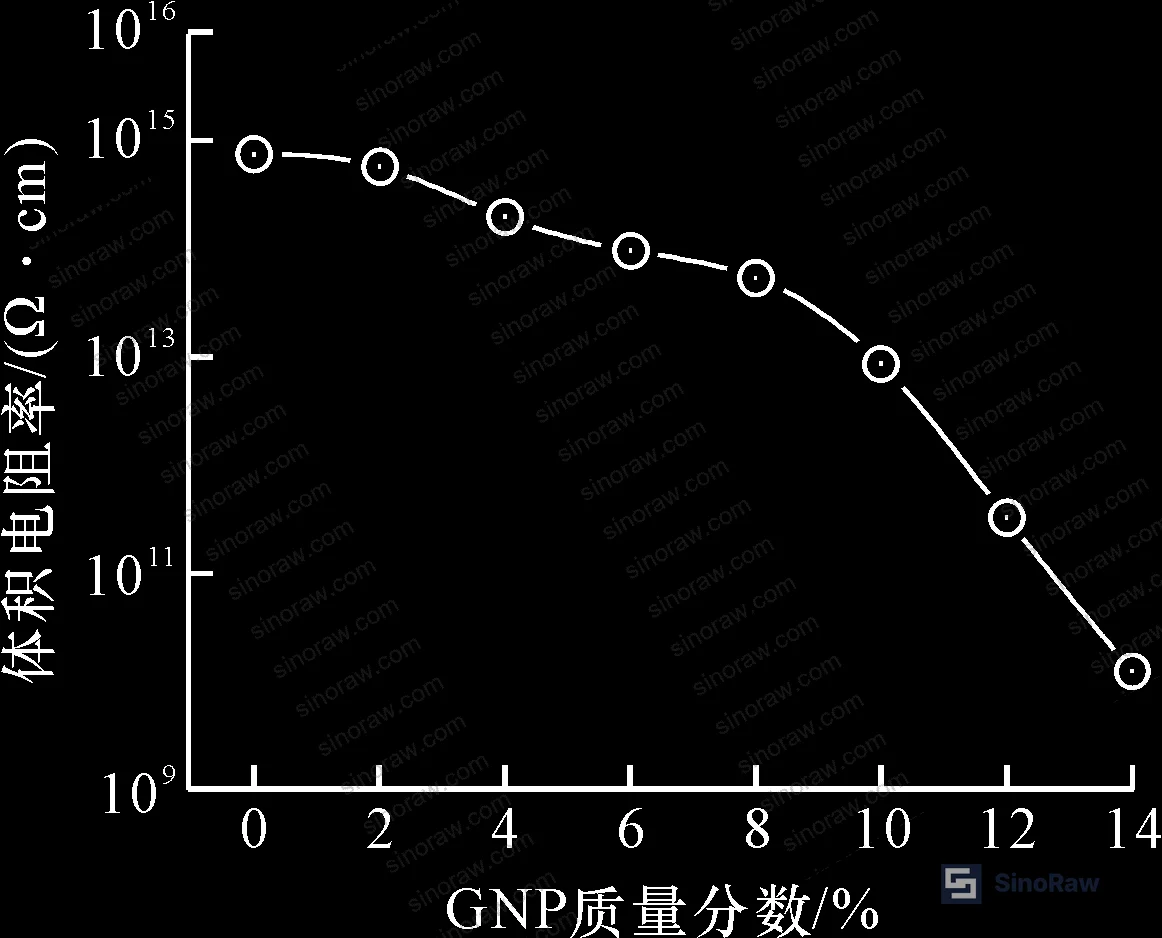
On electrical insulation: neat PBT has a volume resistivity close to 10¹⁵ Ω·cm. As GNP content increases, resistivity decreases monotonically. At 14 wt% GNP, volume resistivity falls to approximately 10¹⁰ Ω·cm — a drop of roughly five orders of magnitude from the neat resin. However, this still exceeds the generally accepted threshold for insulating materials (~10⁹ Ω·cm). The reason: GNP has not formed a continuous electron-conducting pathway within the test range, only a thermal-conducting pathway. Phonon transport (heat) and electron transport (electricity) have different percolation thresholds in platelet systems, and in this geometry the thermal threshold is reached before the electrical one.
This is actually one of the more useful attributes of GNP-filled PBT for electronics applications: you get substantial thermal conductivity improvement while retaining electrical insulation — a combination that carbon black or standard graphite cannot provide at equivalent loadings.
Most procurement teams don’t realize that the electrical insulation retention of GNP-filled thermoplastics depends critically on the aspect ratio and surface chemistry of the specific GNP grade used. Current industry data shows that surface-oxidized or functionalized GNPs can shift the electrical percolation threshold significantly — which means a supplier substituting GNP grades without notifying you can change the electrical performance profile of your compound without changing the fill percentage.
For applications where surface treatment compliance matters, reviewing supplier documentation against REACH Regulation (EC) No 1907/2006 for any surface treatment chemicals is standard practice. Functional polymer compounds that see EU market applications will need this guideation routinely.
Practical Guidance for Buyers #
When you’re sourcing GNP-filled PBT compounds from Chinese manufacturers, the thermal conductivity number on the data sheet is the starting point, not the finish line. The 1.24 W/(m·K) at 14 wt% result is reproducible — but only when the GNP grade, particle size (confirm 90–130 μm range), twin-screw processing parameters (barrel temperatures 195–240°C, screw speed ~85 rpm), and post-extrusion handling are all controlled. Request batch release data that includes both thermal conductivity per ASTM E1461 and at minimum a melt flow or complex viscosity value to flag any lot-to-lot processing variation.
At sinoraw.com, our role is to help global procurement teams identify and pre-screen Chinese manufacturers of polymer compounds before they issue RFQs — connecting buyers with suppliers who can actually deliver verified material specs, not just data sheet promises. If you’re evaluating thermally conductive PBT compounds for electronics or automotive applications, ask for the G′ slope value at 0.01 rad/s from the rheological sweep. Any supplier who cannot produce that number has not done the characterization work that separates production-grade compounds from lab samples.
For broader sourcing context on specialty polymer compounds and additives, our Specialty Polymers coverage provides additional evaluation frameworks.
Also worth checking: supplier quality system certification per ISO 9001:2015 is table stakes, but it doesn’t verify material characterization capability. What separates first-tier compound manufacturers from trading companies is whether they operate their own rheometer and laser flash analyzer — ask directly.
Need help identifying qualified suppliers for thermally conductive PBT compounds? Talk to our sourcing team →
Supplier Qualification Questions #
- What is the measured thermal conductivity of your 12 wt% and 14 wt% GNP/PBT compound grades per ASTM E1461, and can you provide the raw laser flash diffusivity values rather than the derived conductivity alone?
- Can you provide a dynamic frequency sweep showing the storage modulus G′ slope in the low-frequency terminal region (0.01–1 rad/s at 240°C) — specifically confirming a slope below 0.20 at your stated ≥12 wt% GNP loading?
- What is the GNP particle size range in your production grade, and how do you verify that the 90–130 μm platelet geometry is maintained after twin-screw extrusion processing?
- What is the volume resistivity of your GNP/PBT compound at 12 wt% and 14 wt% loading per GB/T 1410, and can you confirm resistivity remains above 10⁹ Ω·cm across production lots?
- At what GNP loading level does your compound show a relaxation time extension beyond 13 s in weighted relaxation spectra, and at what loading does the terminal relaxation peak disappear entirely — indicating full particle network formation?
Sourcing Checklist #
- ☐ Thermal conductivity confirmed ≥1.0 W/(m·K) at 12 wt% GNP loading via ASTM E1461 laser flash method on production-grade compound samples
- ☐ Rheological frequency sweep provided showing G′ low-frequency slope ≤0.20 at 240°C, 1% strain, confirming particle network formation at stated loading
- ☐ GNP particle size verified in 90–130 μm range by supplier, with SEM or laser diffraction data confirming no significant agglomeration after melt compounding
- ☐ Volume resistivity test report per GB/T 1410 showing ≥10⁹ Ω·cm at maximum GNP loading to confirm electrical insulation retention
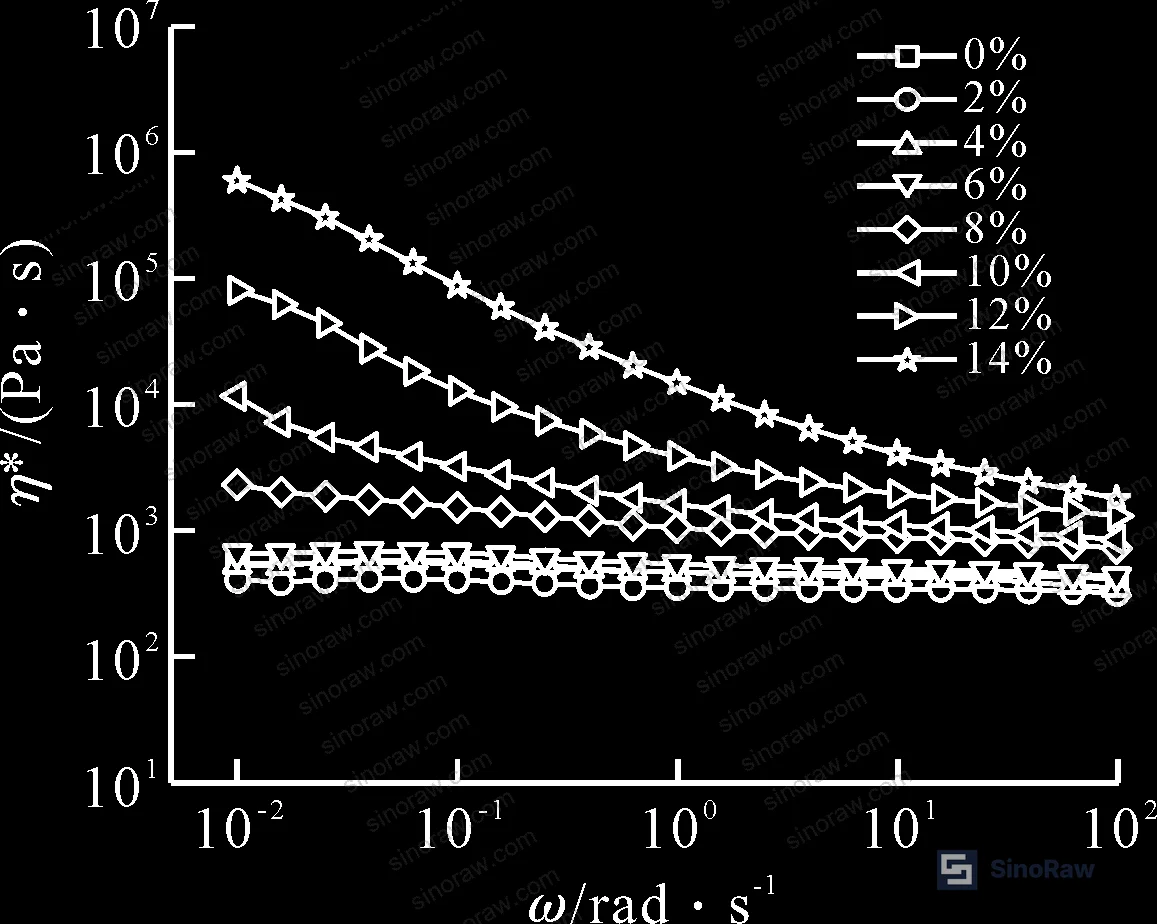
- ☐ Complex viscosity (η) data available showing pronounced shear-thinning behavior (low-frequency η significantly higher than high-frequency) consistent with network-structured melt
- ☐ Supplier operates in-house laser flash thermal analyzer and rotational rheometer — not reliant on third-party testing only for batch characterization
- ☐ REACH compliance documentation available for any surface treatment agents used on GNP filler grade
- ☐ Production lot-to-lot thermal conductivity variation documented — acceptable range ±0.10 W/(m·K) from target value
Key Specifications Table #
| Parameter | Recommended Value | Verification Method |
|---|---|---|
| Thermal conductivity at 12 wt% GNP | ≥1.0 W/(m·K) | ASTM E1461 laser flash, 12.7 mm diameter × 2 mm disc |
| G′ low-frequency slope (terminal region) | ≤0.20 at ≥12 wt% GNP | Rotational rheometer, 240°C, 1% strain, 0.01–100 rad/s sweep |
| Volume resistivity at 14 wt% GNP | ≥10⁹ Ω·cm | GB/T 1410, 100 mm diameter × 1 mm disc |
| GNP particle size | 90–130 μm | SEM or laser diffraction |
| Neat PBT baseline thermal conductivity | 0.23–0.27 W/(m·K) | ASTM E1461, reference check for matrix grade |
| Thermal conductivity improvement at 14 wt% | ≥400% vs. neat resin | Calculated from ASTM E1461 results |
| Relaxation time at 8 wt% GNP | ~13–14 s (with long-time tail) | Weighted relaxation spectra from rheometry |
Can’t find a supplier meeting these specs? Submit your requirements and we’ll match you within 48 hours.
References #
Data source: Thermal Conductivity Enhancement and Rheological Network Formation in Graphene Nanoplatelet-Filled Polybutylene Terephthalate Composites, G. Huang et al., Journal of Applied Polymer Science, 2024
Frequently Asked Questions #
Why does thermal conductivity improvement accelerate between 8 and 12 wt% GNP rather than increasing linearly?
Below 8 wt%, GNP platelets are too sparsely distributed to form connected thermal pathways. The significant thermal resistance between isolated platelets limits overall conductivity gain. Between 8 and 12 wt%, the platelet density crosses a percolation threshold where particles begin bridging across the matrix, building continuous phonon transport pathways. This is why the incremental gain (Δλ) is highest at 12 wt% and then begins declining — the network is essentially complete and additional filler adds diminishing returns.
Can GNP-filled PBT still be used in electrically insulating applications?
Yes, and this is one of the key advantages of GNP over carbon black in this system. At 14 wt% GNP loading, volume resistivity was measured at approximately 10¹⁰ Ω·cm — still well above the insulating material threshold of ~10⁹ Ω·cm. The electrical percolation threshold (requiring a continuous electron-conducting pathway) is not reached within the 0–14 wt% test range, while the thermal percolation threshold is. This makes GNP/PBT suitable for thermally conductive but electrically insulating applications like LED housings, power module substrates, and connector components.
What does the “second plateau” in storage modulus data tell a buyer about compound quality?
The second plateau — where G′ becomes essentially independent of angular frequency at low frequencies — is a direct indicator that GNP has formed a percolated particle network in the matrix. A G′ slope below approximately 0.20 in the terminal region confirms this. If a supplier’s compound at claimed ≥12 wt% GNP doesn’t show this plateau, the GNP is not adequately dispersed or the stated loading is incorrect. Requesting this data as part of incoming inspection is a reliable way to catch batch-to-batch variation before it reaches production.
How does GNP compare to boron nitride as a thermally conductive filler for PBT?
GNP and BN are both viable options, with different tradeoffs. BN at 25 μm particle size offers competitive thermal conductivity in PBT and is naturally electrically insulating, which simplifies the insulation verification requirement. However, GNP at equivalent loadings achieves higher absolute thermal conductivity and forms a verifiable rheological network that can be characterized non-destructively. BN requires higher loadings to reach comparable thermal performance in some systems, which introduces more processing complexity. GNP is generally the preferred choice where maximum thermal conductivity per unit volume is the primary objective.
What processing parameters are critical for achieving consistent GNP dispersion during compounding?
Based on the melt blending protocol that produced these results: PBT should be dried at 100°C for 6 hours, GNP dried at 80°C under 0.1 MPa vacuum for 6 hours before blending. Twin-screw extrusion with a graduated barrel temperature profile (195→210→225→238→240→238→235°C) at approximately 85 rpm screw speed. Compression molding at 240°C, 10 MPa, 10-minute hold for test specimens. Any supplier deviating significantly from this thermal profile — particularly running lower temperatures to avoid degradation risk — may be compromising dispersion at the cost of protecting their equipment. Ask for the specific extrusion parameters used in their production process.
Published by sinoraw.com Technical Team | Request a sourcing quote


