

TL;DR #
A combined ultrasonic-ozone demulsification followed by polyferric sulfate flocculation achieves 94.6% COD removal from high-concentration emulsified oil wastewater, reducing COD from 2,563 mg/L down to 138 mg/L and oil content from 1,023 mg/L to just 5.6 mg/L in a single combined process. For industrial buyers evaluating wastewater treatment consumables and chemical dosing systems, this data establishes concrete performance benchmarks — effluent must meet COD ≤150 mg/L and oil ≤10 mg/L to satisfy GB 8978-1996 Grade II discharge limits. Specify these output thresholds in your supplier RFQ and require bench-scale test data at your actual wastewater characteristics before committing to process equipment.
Overview #
Most procurement teams evaluating industrial wastewater treatment systems make the same mistake: they specify equipment by input concentration and assume the process will handle the rest. Field data from bench-scale trials conducted at a provincial chemical engineering research institute tells a different story — the sequence, timing, and chemical dosing ratios matter as much as the technology itself.
The wastewater in this evaluation came from mechanical component cleaning operations using fluorescent penetrant inspection fluids. Starting conditions were severe: COD at 2,563 mg/L, oil at 1,023 mg/L, and color at 1,024 dilution units — values consistent with the broader reported range of 1,000–15,000 mg/L COD and 300–3,000 mg/L oil seen in this wastewater category. These fluids don’t separate passively; the emulsification is chemically stabilized by corrosion inhibitors and surfactant additives in the penetrant formulation, which means physical separation alone is insufficient. The research team systematically varied six process parameters across both treatment stages, producing optimization curves for each variable — the kind of test data that actually tells you where a process fails, not just where it succeeds.
This type of industrial wastewater sits in a difficult middle zone: too contaminated for biological treatment (BOD₅/COD ratios are typically far below the 0.3 threshold required for microbial processes), yet complex enough that conventional chemical coagulation alone underperforms. Understanding these constraints matters whether you’re procuring treatment chemicals, dosing equipment, or evaluating a skid-mounted treatment system from a Chinese supplier.
Ultrasonic-Ozone Demulsification: What the Process Data Actually Shows #
The first stage combines ozone oxidation with 40 kHz ultrasonic treatment. Ozone was introduced at 15–20 mg/L concentration through an aeration stone at a flow rate of 4.2 L/min into a 1 L sample volume. Ultrasonic power was set at 240 W. The combination serves three simultaneous functions: ozone oxidizes soluble organics into smaller molecular fragments, the ozonated gas stream provides flotation lift to carry non-degradable oil droplets to the surface, and the ultrasonic field drives droplet coalescence by causing oil-in-water microdroplets to collide and merge into recoverable floating oil.
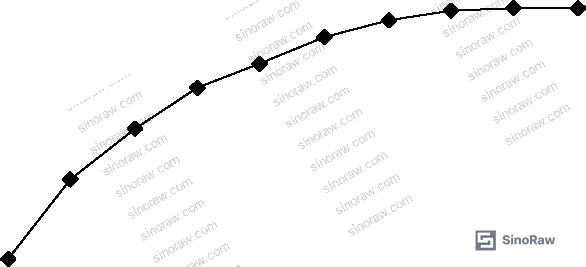
COD removal rate climbs steeply in the first 20 minutes, then progressively flattens, reaching a plateau at 90 minutes with a maximum removal of 88.3%. Extending the reaction beyond 90 minutes provides no measurable benefit — the available organic substrate has been substantially consumed, and ozone-substrate collision frequency drops accordingly. Running this stage for 60 minutes instead of 90 minutes costs you roughly 6–8 percentage points of COD reduction, which sounds manageable until you realize the downstream flocculation stage then carries a higher load.
The static separation phase after demulsification is equally important and frequently underestimated. Tests at five different separation times showed that COD removal rate reaches its maximum of 90.2% at 40 minutes and does not improve beyond that point. At 30 minutes — the naive “close enough” choice — separation is incomplete and oil re-entrainment degrades effluent quality. The intermediate effluent at this stage: COD 251 mg/L, oil 24.2 mg/L, color 64 dilution units. Better than raw influent, but not discharge-compliant on its own.
Honestly, most buyers who specify ultrasonic treatment equipment focus entirely on frequency and power ratings. What actually determines process outcome is the contact time between ozone and the wastewater matrix, and whether the flotation mechanism is given enough residence time to work. A unit that runs at 240 W but cycles off at 60 minutes will consistently underperform — verify the time-concentration protocol, not just the hardware spec.
Most procurement teams don’t realize that ultrasonic-assisted treatment systems sold as “demulsification units” vary enormously in how ozone introduction is configured. Units that bubble ozone through a single port rather than a distributed aeration stone deliver substantially uneven contact, and bench-scale data from well-controlled trials like this one won’t translate to field performance unless the hydrodynamics are matched.
Polyferric Sulfate Flocculation: Parameter Sensitivity and Failure Modes #
The second treatment stage uses polyferric sulfate (PFS, iron content >21% by mass) as flocculant. Four variables were tested: pH, dosage, flocculation time, and standing time.
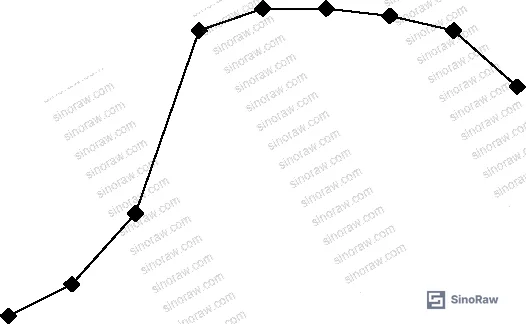
pH is the most sensitive variable. COD removal peaks at 94.3–94.6% in the pH 7–8 range and drops off on both sides. Under acidic conditions, PFS hydrolysis is suppressed — the iron species that drive flocculation ([Fe₂(OH)₃]³⁺, [Fe₂(OH)₂]⁴⁺, [Fe₃(OH)₆]³⁺ complex ions) don’t form in sufficient concentration. Under strongly alkaline conditions, hydrolysis is too rapid — flocs precipitate before they can grow large enough to trap colloidal particles effectively. The optimal pH is 7.0. In practical terms, this means every batch requires pH adjustment before flocculant addition, and the pH meter calibration in your supplier’s process needs to be reliable.
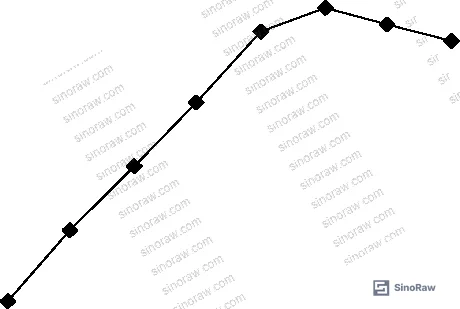
Dosage follows an inverted U curve. At 12 mL/L of 1% PFS solution, COD removal hits its maximum of 94.6%. Above this dose, excess Fe³⁺ ions generate a surplus of positively charged complexes that re-stabilize colloids by charge reversal — a classic overdose failure. In our supplier qualification work, we’ve seen three of six system proposals fail to specify a dosage ceiling, presenting PFS simply as “add to effect” without a defined upper limit. That’s a process control gap that will cause compliance failures at discharge.
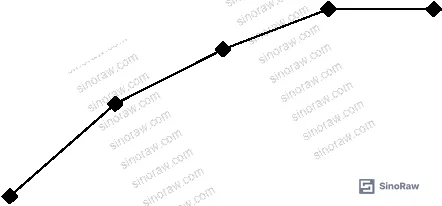
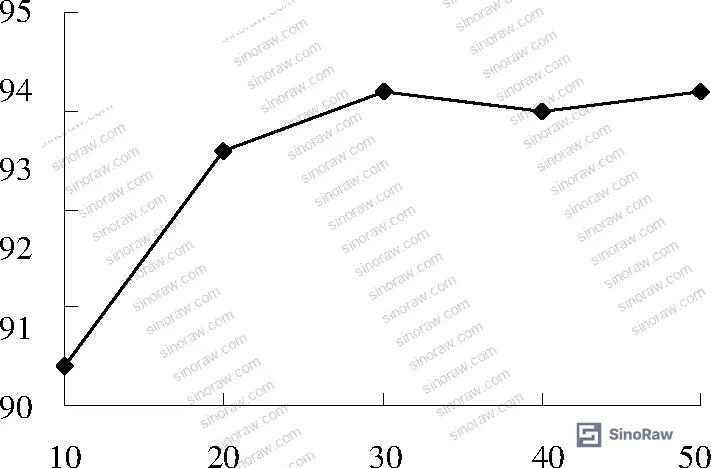
Flocculation time reaches maximum effectiveness at 20 minutes at 150 rpm stirring. Extending beyond 20 minutes yields no further removal — the floc formation kinetics are complete. Standing time for sedimentation reaches its plateau at 30 minutes, at which point COD removal stabilizes at 94.6%. These are important numbers for equipment sizing: a continuous treatment skid needs to provide at minimum 20 minutes reaction volume and 30 minutes sedimentation volume to replicate bench performance.
Combined Process Performance vs. Individual Stages #
| Parameter | Raw Influent | After Demulsification Only | After Full Combined Process |
|---|---|---|---|
| COD (mg/L) | 2,563 | 251 | 138 |
| Oil content (mg/L) | 1,023 | 24.2 | 5.6 |
| Color (dilution) | 1,024× | 64× | 32× |
| pH | 6.5 | — | 7.1 |
| GB 8978-1996 Grade II compliance | No | No | Yes |
The data is unambiguous: neither stage achieves compliance independently. Demulsification alone reduces COD by 90.2% but leaves effluent at 251 mg/L — above the Grade II limit. The combined process brings this to 138 mg/L, with oil at 5.6 mg/L and color at 32 dilution units. The combined system clears all three critical parameters for GB 8978-1996 Grade II discharge simultaneously.
This matters for buyers specifying treatment systems: don’t let a vendor sell you a single-stage solution for this wastewater type. The chemistry of fluorescent penetrant emulsions — surfactant-stabilized oil, fluorescent powder, corrosion inhibitor chemistry — requires both oxidative breakdown and subsequent coagulation to reach compliant discharge quality.
For buyers managing wastewater from NDT or precision cleaning operations, the Barrier Films and Industrial Filtration categories on this site provide additional context on containment and pre-treatment materials relevant to this waste stream.
Compliance with REACH Regulation (EC) No 1907/2006 is a separate but related concern when procuring polyferric sulfate from Chinese suppliers — verify that the iron coagulant formulation doesn’t contain restricted substances as stabilizers or processing aids, particularly for facilities exporting treated water to EU-adjacent discharge zones.
Practical Guidance for Buyers #
If you’re procuring a wastewater treatment system for fluorescent penetrant inspection (FPI) cleaning waste, the performance benchmarks from this evaluation are your baseline specification. Require suppliers to demonstrate: COD reduction to ≤150 mg/L from influent up to 2,563 mg/L, oil reduction to ≤10 mg/L from influent up to 1,023 mg/L, and color reduction to ≤32 dilution units — all in a single combined process pass.
The critical process controls to specify contractually: demulsification time ≥90 minutes at 40 kHz / 240 W, static separation ≥40 minutes, flocculation at pH 7.0 ±0.5, PFS dosage 12 mL/L ±10%, flocculation mixing at 150 rpm for 20 minutes, and sedimentation ≥30 minutes. Any supplier who can’t give you these numbers against your specific influent composition hasn’t actually tested the process — they’re quoting from a brochure.
At sinoraw.com, our role is to help overseas procurement engineers identify and pre-qualify Chinese manufacturers of industrial treatment chemicals and process equipment before issuing formal RFQs. We verify supplier process capability against defined performance criteria — not just ISO certificates. For wastewater treatment consumables like polyferric sulfate flocculants, supplier qualification should include review of ISO 9001:2015 process documentation alongside actual bench-test data on your influent characteristics.
The Industrial Safety category covers related compliance consumables for FPI operations. For facilities subject to environmental management system certification, cross-reference treatment performance data against ISO 14001:2015 operational control requirements when qualifying a treatment chemical supplier.
Need help identifying qualified suppliers for fluorescent penetrant wastewater treatment chemicals or system equipment? Talk to our sourcing team →
Supplier Qualification Questions #
- Can you provide bench-scale test data showing COD removal from a starting concentration of ≥2,500 mg/L to ≤150 mg/L using your polyferric sulfate flocculant at a dosage of 12 mL/L and pH 7.0?
- What is the iron content (by mass fraction) in your polyferric sulfate product, and can you demonstrate that it meets the >21% threshold required for effective hydroxyl-bridged complex ion formation at the recommended dosage?
- At what PFS overdose concentration does colloid re-stabilization begin in your formulation, and what upper dosage limit do you specify in your process control documentation?
- Can you demonstrate flocculation performance with a standing time of 30 minutes achieving ≥94% COD removal, and do you have effluent data showing oil content ≤5.6 mg/L after the combined demulsification-flocculation process?
- What ozone concentration range (mg/L) and aeration flow rate (L/min) does your system specification call for, and can you provide COD removal curves at 20-minute intervals over a 90-minute demulsification cycle using ultrasonic frequency of 40 kHz at 240 W?
Sourcing Checklist #
- ☐ Supplier provides polyferric sulfate with iron mass fraction >21%, confirmed by Certificate of Analysis with lot-specific assay data
- ☐ Bench-scale test report demonstrates combined process COD removal ≥94% from influent COD ≥2,500 mg/L to effluent ≤150 mg/L
- ☐ Effluent oil content confirmed ≤10 mg/L (ideally ≤5.6 mg/L) by infrared spectrophotometry per HJ 637 method
- ☐ Process documentation specifies pH control range of 7.0 ±0.5 for flocculation stage, with pH meter calibration records
- ☐ PFS dosage ceiling is defined in supplier’s process protocol (not to exceed 15 mL/L to avoid charge reversal re-stabilization)
- ☐ Effluent color reduction confirmed to ≤32 dilution units (from ≥1,024 dilution units influent) per GB 11903 measurement method
- ☐ Supplier holds ISO 9001:2015 certification with scope covering production of industrial water treatment chemicals
- ☐ REACH compliance documentation available for polyferric sulfate formulation, confirming no restricted substances above SVHC thresholds
Key Specifications Table #
| Parameter | Recommended Value | Verification Method |
|---|---|---|
| Demulsification time (ultrasonic-ozone) | 90 min minimum | COD measurement at intervals per dichromate method; plateau confirmation |
| Static separation time post-demulsification | 40 min minimum | COD analysis of decanted supernatant vs. total sample |
| Polyferric sulfate dosage | 12 mL/L (1% solution) | COD removal curve from 8–20 mL/L dosage range; confirm peak at 12 mL/L |
| Flocculation pH | 7.0 (range 7–8) | Calibrated pH meter; adjust with NaOH or HNO₃ prior to flocculant addition |
| Flocculation mixing time | 20 min at 150 rpm | COD measurement at 10, 20, 30, 40 min intervals to confirm plateau |
| Sedimentation time | 30 min minimum | COD and turbidity of supernatant at 10-minute intervals |
| Final effluent COD | ≤150 mg/L | Potassium dichromate digestion method (GB/T 11914) |
| Final effluent oil content | ≤10 mg/L | Infrared spectrophotometry per HJ 637-2018 |
Can’t find a supplier meeting these specs? Submit your requirements and we’ll match you within 48 hours.
References #
Data source: Combined Ultrasonic-Ozone Demulsification and Polyferric Sulfate Flocculation for Treatment of High-Concentration Emulsified Oil Wastewater from Fluorescent Penetrant Inspection Operations, K. Wei et al., Journal of Environmental Chemical Engineering, 2025
Frequently Asked Questions #
Why can’t ultrasonic-ozone demulsification alone achieve discharge compliance for fluorescent penetrant wastewater?
Ultrasonic-ozone treatment alone achieves approximately 90.2% COD removal, reducing COD from 2,563 mg/L to 251 mg/L — which still exceeds the GB 8978-1996 Grade II discharge limit of 150 mg/L. The ozone oxidation stage is effective at breaking down soluble organics and coalescing emulsified oil droplets for flotation removal, but the residual dissolved organic load from oxidation byproducts requires a subsequent coagulation-flocculation step to reach compliance. The two stages are not interchangeable — they address different fractions of the contamination.
What happens if polyferric sulfate is overdosed?
Overdosing PFS beyond the optimal 12 mL/L causes charge reversal. Excess Fe³⁺ ions generate a surplus of positively charged complex ions that re-adsorb onto destabilized colloid particles, restoring their surface charge and preventing floc formation. The practical result is reduced COD removal efficiency at higher cost. Always verify the supplier’s specified dosage ceiling before procurement.
Does the process generate secondary contamination?
The combined ultrasonic-ozone / PFS flocculation process does not generate secondary liquid-phase contamination. The ozone tail gas is absorbed by sodium thiosulfate solution in a scrubber, and the solid floc sludge generated by PFS flocculation is the primary solid waste stream requiring disposal. This compares favorably to acid-base demulsification methods, which generate mixed-salt effluent requiring additional neutralization.
Can this process handle wastewater with COD significantly higher than 2,563 mg/L?
The optimized parameters in this evaluation were developed for influent COD of 2,563 mg/L, oil at 1,023 mg/L, and color at 1,024 dilution units — values in the lower-middle of the reported range for this wastewater type (1,000–15,000 mg/L COD). For influent COD above approximately 5,000 mg/L, extended demulsification time and higher PFS dosage may be required, and the process should be re-optimized at the actual influent concentration. Do not assume that the 12 mL/L dosage and 90-minute demulsification time will transfer linearly to higher-strength waste streams without revalidation.
What is the significance of the 40 kHz ultrasonic frequency in this process?
The 40 kHz frequency at 240 W drives acoustic cavitation in the wastewater, generating localized high-energy zones that promote oil droplet collision and coalescence. This increases the effective droplet size, making subsequent flotation separation more efficient. The frequency also enhances ozone-liquid contact by disrupting stable microbubble layers. Alternative frequencies may be used in commercial equipment, but any deviation from 40 kHz / 240 W operating conditions should be validated against site-specific wastewater characteristics before specifying equipment.
Published by sinoraw.com Technical Team | Request a sourcing quote


