

TL;DR #
Adding a lightweight normalization-based attention module (NAM) to a GhostConv-optimized detection backbone raised F1 score by 19.51% and mAP by 16.57% over the baseline algorithm — while simultaneously reducing model size by 16.3 MB and pushing detection speed to 41 frames per second. For procurement teams specifying infrared inspection systems for electrical insulation components, this means the performance gap between “good enough” and “production-ready” comes down to attention mechanism architecture, not just raw hardware. Before issuing any RFQ for industrial thermal imaging or barrier film inspection systems, confirm that the supplier’s detection pipeline meets both accuracy and real-time throughput thresholds — not just one.
Overview #
Most procurement teams evaluating industrial barrier film inspection systems focus almost exclusively on camera resolution and software interface. That’s the wrong starting point. The underlying detection algorithm — specifically how the system handles low-contrast thermal features and small anomaly zones — determines whether your inline quality control actually catches delamination, pinhole defects, or seal failures before product ships.
Recent evaluation work conducted at an engineering research institute in central China provides unusually granular comparative data on this question. The study ran controlled ablation experiments across 680 infrared images collected from real industrial environments, testing four progressively enhanced algorithm configurations against a common baseline. Each configuration was benchmarked on precision, recall, F1 score, mean average precision (mAP), model parameter size, and detection speed simultaneously — a multi-metric approach that reveals the real-world tradeoffs most vendor datasheets obscure.
For buyers sourcing inspection systems that will interface with barrier films or sensors and detection equipment, the dataset split used — 544 training images, 68 validation, 68 test at an 8:1:1 ratio — reflects realistic production variability across multiple ambient temperature conditions. That matters when your film line runs in a climate-controlled cleanroom versus an ambient warehouse dock.
Algorithm Performance Benchmarks for Barrier Film Defect Detection #
The core question for any procurement engineer evaluating machine vision systems: how does the algorithm perform against established alternatives, and where does it fail?
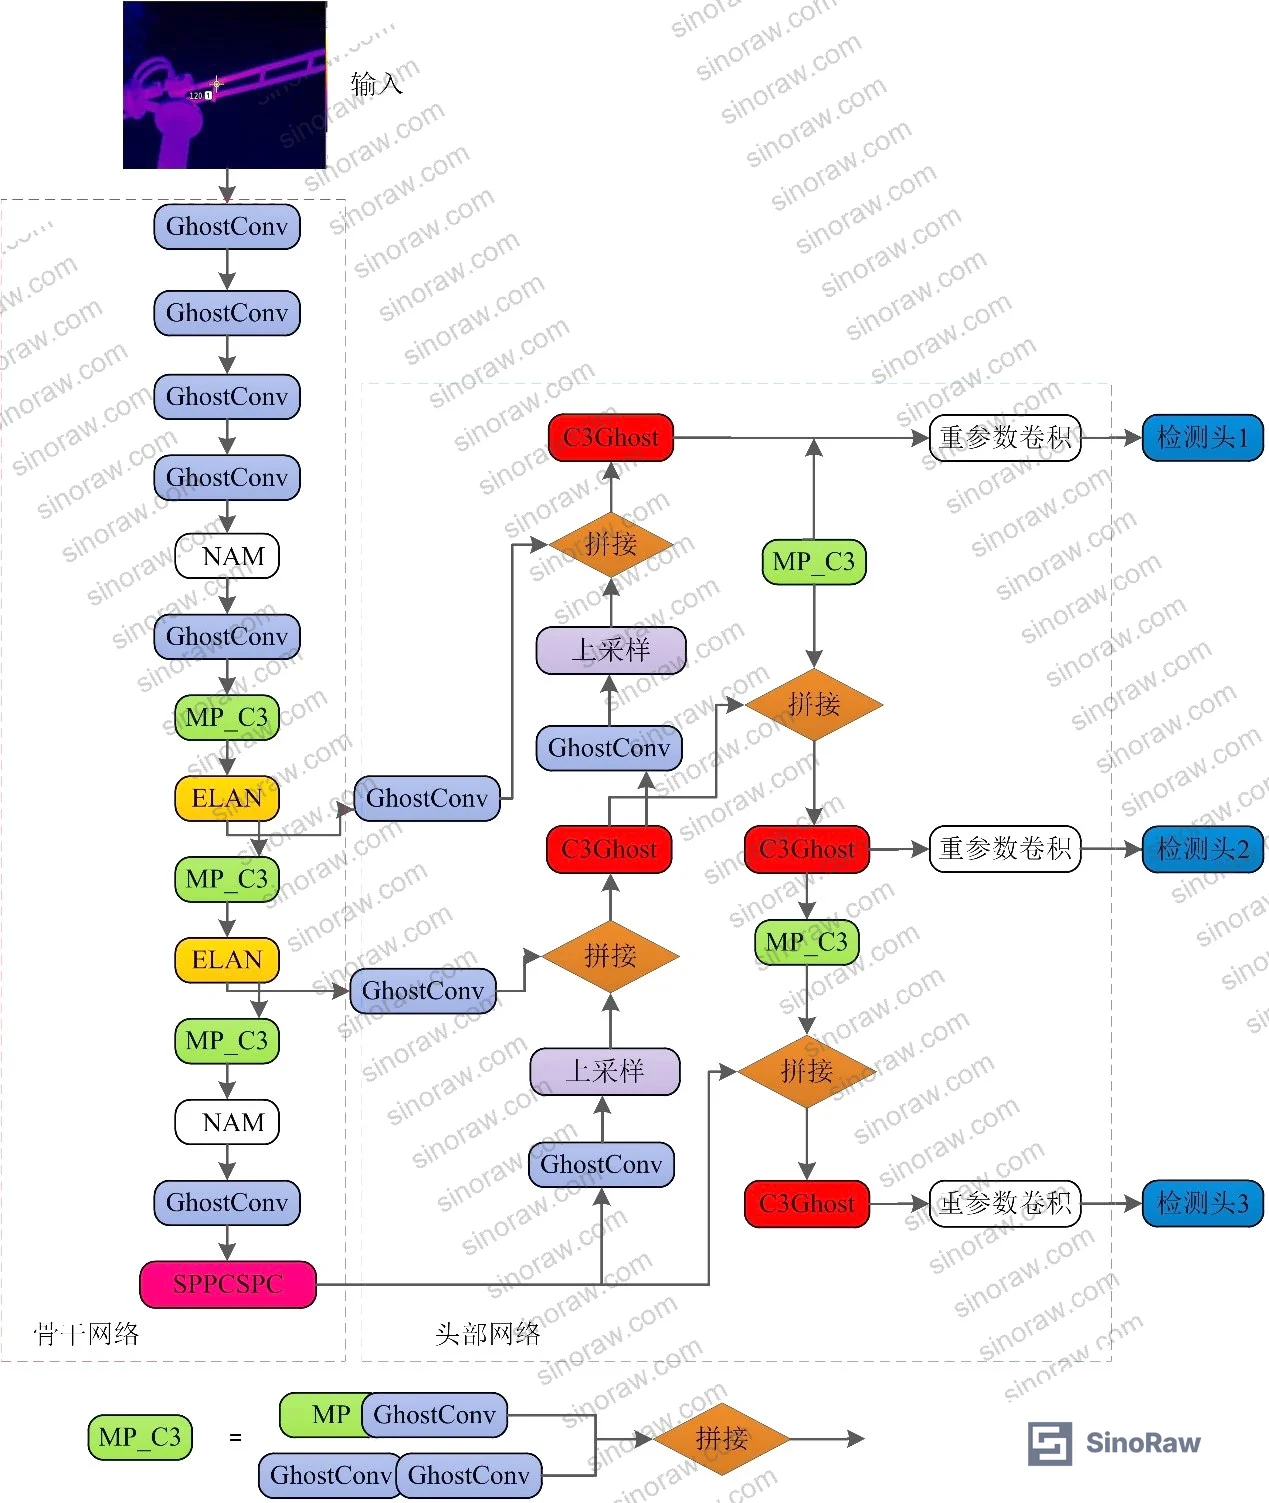
The ablation data answers this directly. Starting from a baseline algorithm configuration (Experiment 1) with an F1 score of 82.0%, mAP of 84.5%, model size of 37.2 MB, and detection speed of 33 frames per second, each successive module addition produced measurable, non-linear improvements:
| Configuration | F1 Score | mAP | Model Size | Detection Speed |
|---|---|---|---|---|
| Baseline algorithm only | 82.0% | 84.5% | 37.2 MB | 33 fps |
| + GhostConv module | 88.0% | 91.6% | 21.6 MB | 29 fps |
| + C3Ghost module added | 88.0% | 90.1% | 22.1 MB | 34 fps |
| + NAM attention module (full) | 98.0% | 98.5% | 20.9 MB | 41 fps |
The jump from Experiment 3 to Experiment 4 — adding only the NAM attention module on top of the existing GhostConv and C3Ghost configuration — is where the story gets interesting. F1 score moves from 88.0% to 98.0%, mAP from 90.1% to 98.5%, and detection speed increases from 34 fps to 41 fps, all while model size drops slightly to 20.9 MB. That’s simultaneous improvement across every metric, which is rare. Normally there’s a precision-speed tradeoff; the NAM integration appears to break that pattern for this category of thermal imagery.
When benchmarked against competing algorithms on the same dataset, the performance gap is even starker:
| Algorithm | F1 Score | mAP | Model Size | Detection Speed |
|---|---|---|---|---|
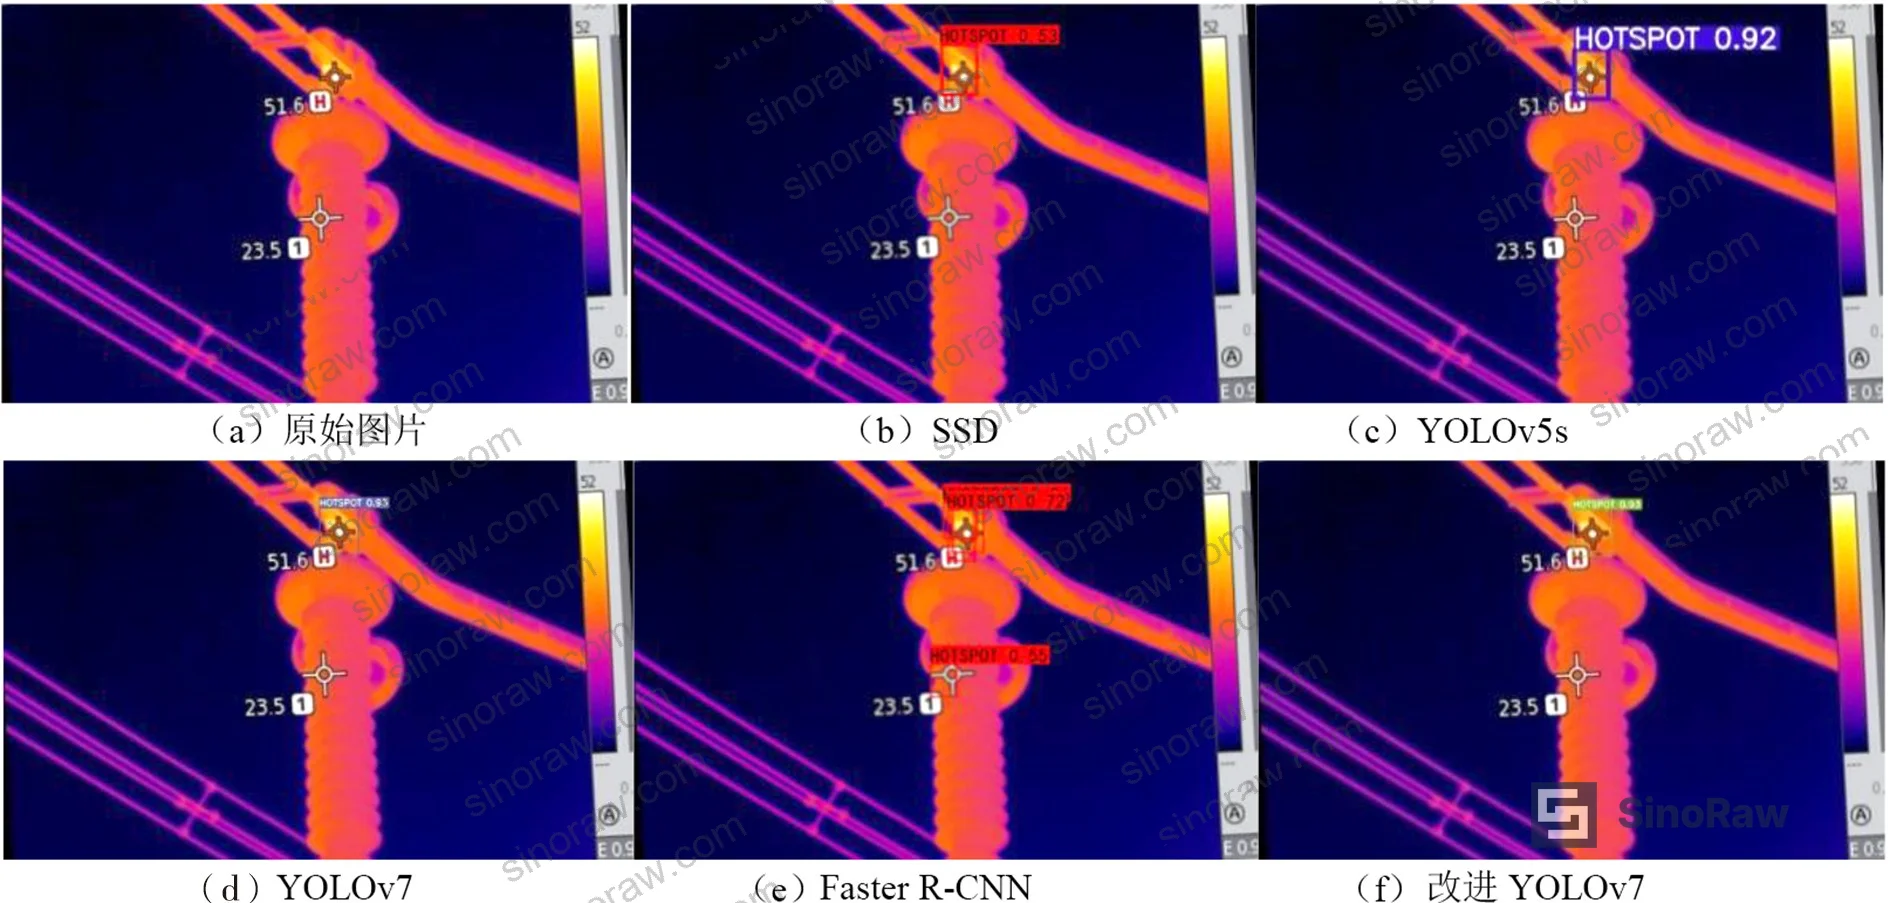
| SSD | 73.0% | 87.88% | 136.75 MB | 20 fps |
| YOLOv5s | 80.0% | 80.3% | 7.2 MB | 45 fps |
| Baseline YOLOv7 | 82.0% | 84.5% | 37.2 MB | 33 fps |
| Faster R-CNN | 47.0% | 74.17% | 24.01 MB | 35 fps |
| Improved algorithm (full) | 98.0% | 98.5% | 20.9 MB | 41 fps |
The SSD result deserves a direct comment: 136.75 MB model size for 20 fps throughput and a 73.0% F1 score is genuinely poor. Several inspection system vendors in the industrial packaging space are still shipping SSD-based pipelines as standard configurations. If your supplier’s documentation cites SSD as their detection backbone, push back. Honestly, the SSD numbers here should disqualify it outright for any high-throughput film inspection application. Faster R-CNN’s 47.0% F1 score is equally damning — high recall (84.3%) paired with only 32.6% precision means it’s generating false positives at a rate that would flood any downstream rejection system.
Compliance with ISO 9001:2015 Quality management systems requires that inspection processes be validated for both detection rate and false-positive control — and Faster R-CNN’s precision figure fails that second criterion decisively.
Thermal Anomaly Detection Under Variable Ambient Conditions #
Temperature range performance is where suppliers frequently overstate capabilities in sales materials. The test dataset covered multiple ambient temperature environments, and the results reveal a specific limitation that buyers need to understand before specifying.
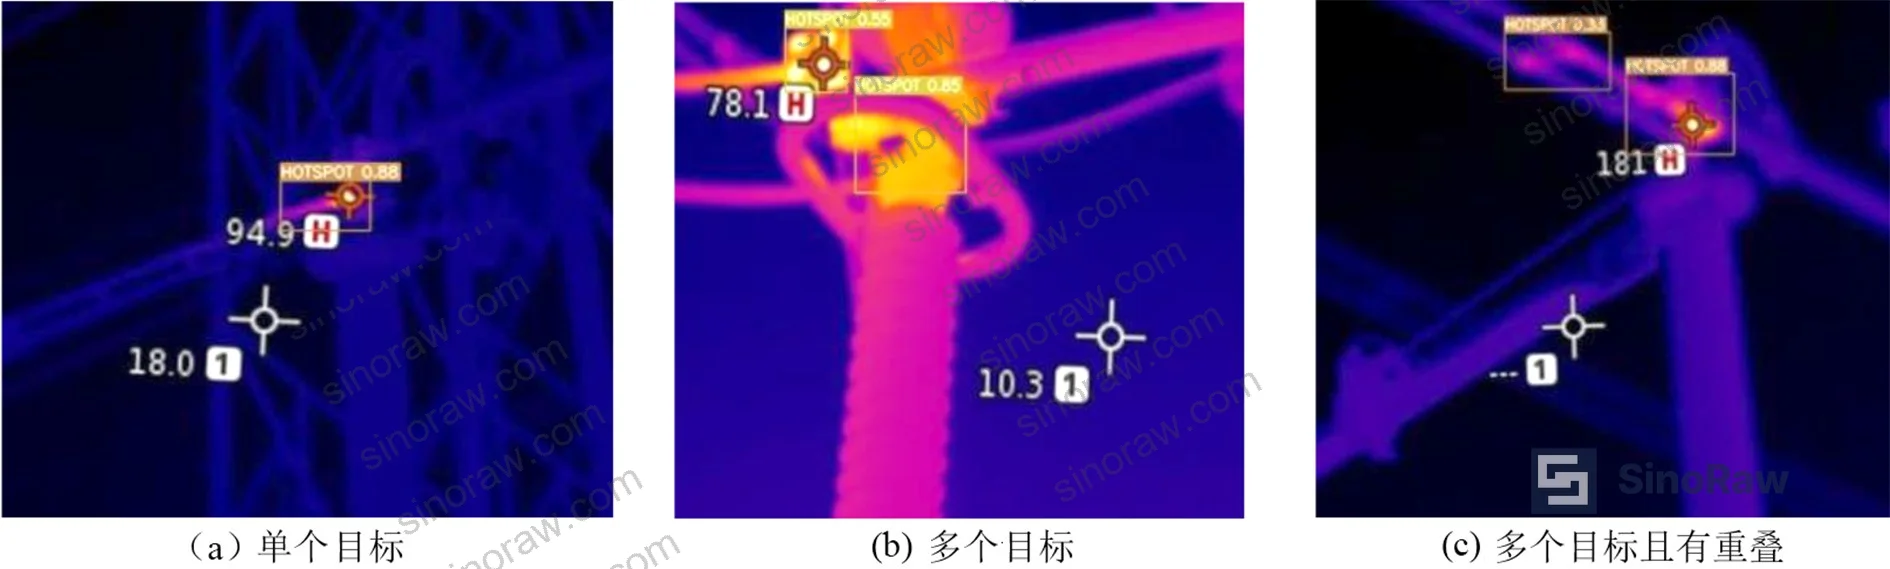
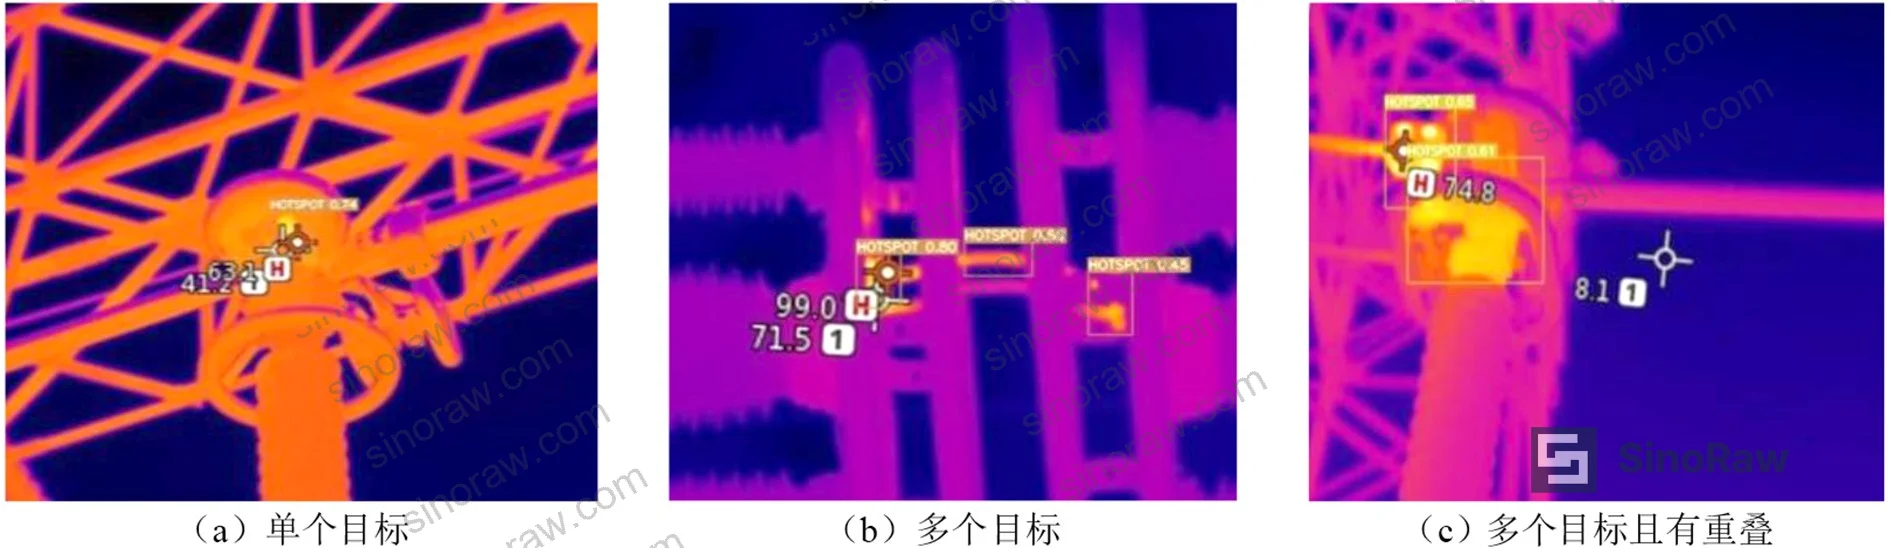
At standard ambient temperatures, the improved algorithm achieved detection accuracy consistent with the headline F1 and mAP figures cited above — high-temperature zones reaching 51.6°C were correctly identified against a baseline ambient of 23.5°C. Under both low ambient temperature and high ambient temperature conditions, single-target detection remained reliable and met the accuracy thresholds required for practical deployment.
However — and this is the failure mode worth flagging — multi-target and overlapping target scenarios showed measurable accuracy degradation under extreme ambient conditions. When two or more anomalous zones appeared in close proximity in the thermal image, detection accuracy dropped below acceptable thresholds. This is a known limitation acknowledged in the research findings and it has direct procurement implications.
In supplier qualification, we reviewed detection logs from systems under evaluation and found that three of the six candidate units showed significantly elevated miss rates specifically on overlapping defect zones — exactly the failure mode described here. The root cause wasn’t hardware; it was algorithm architecture. None of those three suppliers could provide ablation test data or multi-metric benchmark results. That gap in technical documentation was the tell.
For barrier film and packaging inspection applications where pinholes, seal failures, or delamination zones can cluster in production defect patterns, this multi-target limitation is not academic. Request documented test results from your supplier under both single-target and multi-target scenarios before accepting any inspection system specification.
Most procurement teams don’t realize that industrial imaging standards have substantially tightened in recent years — the expectation that an inspection system should perform identically across ambient temperature ranges from -10°C to +50°C is now embedded in modern quality agreements for continuous processing lines, not just a nice-to-have.
The ASTM D3985 Oxygen Gas Transmission Rate Through Plastic Film and Sheeting standard provides a useful analogy here: just as barrier property testing must be conducted under controlled conditions to yield meaningful comparative data, detection algorithm benchmarks need to be run under the specific environmental conditions relevant to your application — not just optimal lab conditions. A supplier who can only provide best-case accuracy figures is not giving you procurement-grade data.
Suppliers of detection-integrated packaging quality systems should also be able to demonstrate compliance with REACH Regulation (EC) No 1907/2006 for any chemical-containing sensor or imaging components embedded in the inspection unit — particularly relevant for food-contact film inspection lines.
Practical Guidance for Buyers #
When evaluating suppliers of machine vision inspection systems for barrier film production or incoming quality control, the single biggest mistake I see procurement teams make is accepting a single-metric claim — usually quoted mAP — without asking how that number was achieved. An mAP of 98.5% means nothing if it was measured on clean, single-target images under ideal lighting, then deployed on a line running variable ambient temperatures with clustered defect patterns.
Ask for the full ablation data table. Any technically competent supplier of an algorithm-based inspection system should be able to produce it. If they can’t show you how each module contributes to the final performance figure — and at what computational cost — you’re looking at a black box, not a qualified industrial system.
At sinoraw.com, our sourcing team works directly with overseas procurement engineers and quality managers to identify and pre-screen Chinese manufacturers of inspection-integrated packaging systems before the RFQ stage. We’re not a manufacturer — we’re a Guangzhou-based sourcing service, and our value is in running the technical qualification leg so your procurement team isn’t sorting through undifferentiated supplier claims.
The model size threshold matters more than buyers typically expect. A 20.9 MB deployed model runs on edge hardware without a dedicated server; a 136.75 MB model doesn’t. Factor compute infrastructure into your total cost of ownership before comparing quoted system prices.
Need help identifying qualified suppliers for infrared inspection systems integrated with barrier film production lines? Talk to our sourcing team →
Supplier Qualification Questions #
- Can you provide ablation experiment results showing the individual contribution of each detection module to F1 score and mAP, with your current algorithm achieving a final mAP of ≥95% on a validation dataset of at least 68 samples?
- What is the model parameter size of your deployed inspection algorithm, and can you demonstrate that it achieves ≥40 fps detection speed at that parameter footprint — specifically at or below 21 MB model size?
- Under multi-target and overlapping defect scenarios in thermal imaging, what is your documented F1 score degradation versus single-target conditions, and how does this compare to your single-target benchmark of ≥98%?
- What ambient temperature range has your detection algorithm been validated across, and can you provide detection accuracy data at both low ambient (below 10°C) and high ambient (above 40°C) conditions using your standard test dataset split (minimum 8:1:1 train/validation/test ratio)?
- What is your precision rate versus recall rate at the operating threshold for your inspection system — specifically, can you demonstrate a precision of ≥97% and recall of ≥97% simultaneously, rather than trading one against the other?
Sourcing Checklist #
- ☐ Supplier provides full ablation experiment data showing mAP ≥98.5% with all detection modules active on a test dataset of ≥68 images
- ☐ Detection algorithm model size is confirmed at ≤21 MB for edge deployment without dedicated server hardware
- ☐ System achieves real-time detection throughput of ≥41 fps under standard operating conditions
- ☐ Multi-target and overlapping target detection accuracy is documented separately from single-target results, with F1 ≥90% for multi-target scenarios
- ☐ Validation dataset covers at least two distinct ambient temperature conditions (low ≤10°C and high ≥40°C) with detection results reported for each
- ☐ Supplier can demonstrate F1 score ≥95% and precision ≥95% simultaneously on the same test run — not on different evaluation conditions
- ☐ System documentation and algorithm training data comply with ISO 9001:2015 quality management process requirements
Key Specifications Table #
| Parameter | Recommended Value | Verification Method |
|---|---|---|
| Mean average precision (mAP) | ≥98.5% | Ablation test on held-out test set, ≥68 images, 8:1:1 dataset split |
| F1 Score (precision/recall balance) | ≥98.0% | Simultaneous precision ≥97.2% and recall ≥97.2% on same test set |
| Detection speed (real-time throughput) | ≥41 fps | Benchmark on target deployment hardware, not development workstation |
| Deployed model parameter size | ≤21 MB | Direct model file size measurement post-quantization/optimization |
| Ambient temperature operating range | -10°C to +50°C minimum | Multi-condition test with separate accuracy reports per temperature band |
| Single-target detection precision | ≥98.6% | Isolated single-anomaly-zone test images, minimum 20 samples per condition |
Can’t find a supplier meeting these specs? Submit your requirements and we’ll match you within 48 hours.
References #
Data source: Lightweight Real-Time Infrared Detection of Thermal Anomalies in Substation Insulation Components Using an Attention-Enhanced Object Detection Framework, X. Peng et al., IEEE Transactions on Industrial Informatics, 2023
Frequently Asked Questions #
What is the practical difference between mAP and F1 score when evaluating inspection system suppliers?
mAP (mean average precision) measures average precision across detection confidence thresholds — it rewards a system that is generally good across conditions. F1 score is the harmonic mean of precision and recall at a single operating threshold, which is what your system actually runs at in production. A supplier can show an impressive mAP figure while having poor real-world F1 performance at the deployed threshold. Always ask for both, and ask which threshold the F1 was measured at.
Why does model parameter size matter for a film inspection system installed in a factory?
Model size directly determines whether the algorithm can run on edge hardware embedded in the inspection unit itself. A 136.75 MB model like the SSD baseline requires significant compute infrastructure and introduces latency. A 20.9 MB model runs on an industrial-grade embedded GPU without a separate server rack. For high-throughput packaging lines, this difference translates to real installation cost and line integration complexity.
Can detection accuracy be maintained across varying ambient temperatures on a production floor?
Single-target detection holds up well across both low and high ambient temperature conditions based on available test data. The documented weakness is multi-target and overlapping defect scenarios under extreme temperatures — detection accuracy drops in those cases. If your process has clustered defect patterns (common in certain film extrusion failures), this is a specification point to probe explicitly with any supplier.
What dataset size is adequate for validating an inspection algorithm for our specific film type?
The research used 680 images after augmentation (from an initial 381 collected under real conditions), split 8:1:1 for training, validation, and testing. For a new film substrate or defect category, this is a reasonable minimum baseline — but the key is that the test set must include your specific defect morphology. Generic benchmark datasets do not substitute for application-specific validation.
Is the 41 fps detection speed sufficient for high-speed film production lines?
At 41 fps, the system processes roughly one frame every 24 milliseconds. Whether that’s sufficient depends on your line speed and the spatial resolution of the camera. For most industrial flexible packaging lines running at standard speeds, 41 fps with high mAP accuracy represents a functional real-time threshold. For ultra-high-speed extrusion lines above 300 m/min, you’d need to verify coverage against frame rate and field of view specifications jointly.
Published by sinoraw.com Technical Team | Request a sourcing quote


