

TL;DR #
Soldering with two supplementary 0.35 mm² wire strands consistently produced the highest pull-off force values across all environmental stress conditions tested — peaking above 156 N on 0.2 mm² conductor cross-section terminals — making process selection a direct determinant of connector reliability. For procurement teams specifying industrial connectors for harsh-environment applications, assembly process documentation is not a nice-to-have; it is a pass/fail qualification criterion. Before issuing any RFQ, require suppliers to specify assembly method, pull-off force test data per EIA-364-08B, and salt spray exposure results per EIA-364-26B.
Overview #
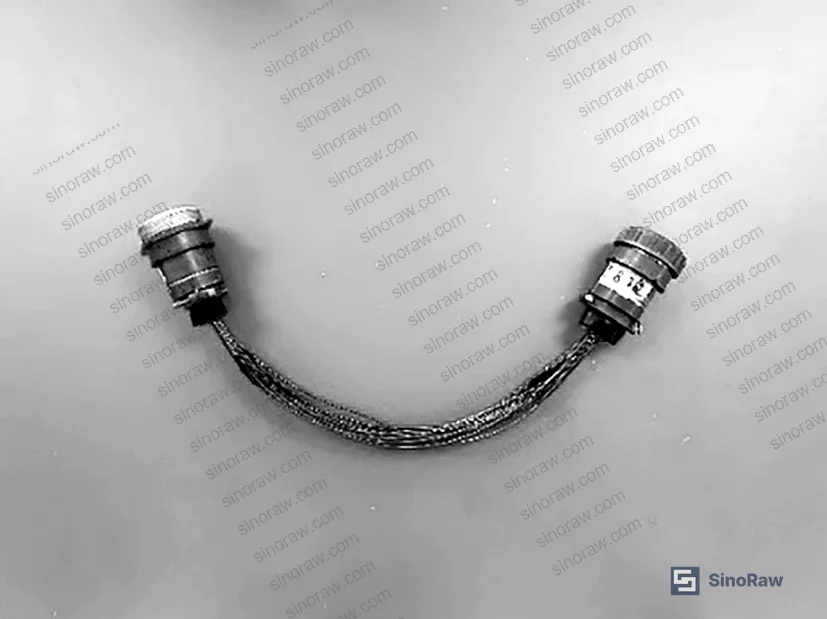
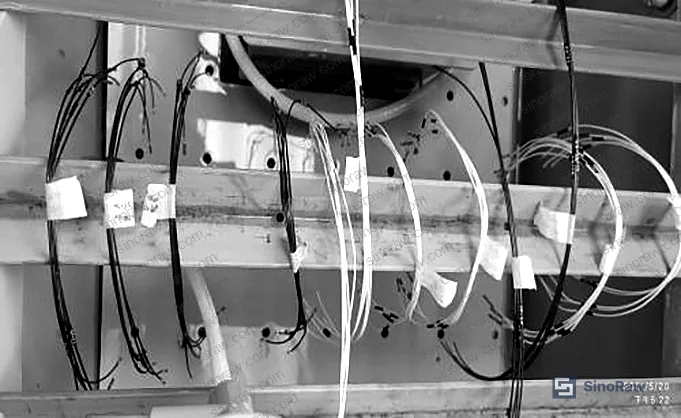
If you are evaluating connector terminals purely on material grade or contact resistance, you are missing the variable that actually separates reliable product from field failures: assembly process. A multi-stage environmental testing program conducted by a government-affiliated electronics reliability institute — running five distinct assembly configurations through six sequential stress protocols — makes this case with hard data. The test matrix covered vibration (sinusoidal, 10–2000–10 Hz sweep), salt spray (96 hours at 5±1% NaCl concentration), damp-heat cycling, thermal shock (-55°C to +125°C), and high-temperature exposure (150°C for 120 hours), all applied to a single connector terminal model crimped or soldered onto 0.2 mm² aircraft wire. Minimum pull-off force reference was set at 44 N; every process configuration exceeded this threshold — but the spread between best and worst process was dramatic enough to matter significantly in high-cycle or high-vibration service environments.
The study covered 30 unique sample groups, with five replicate specimens per group per test condition. Three failure modes were documented: insulation break, terminal mounting break, and conductor break. Failure mode distribution varied by environmental condition in ways that carry direct implications for specification writing.
Connector Terminal Assembly Processes: Five Methods Compared Under Environmental Stress #
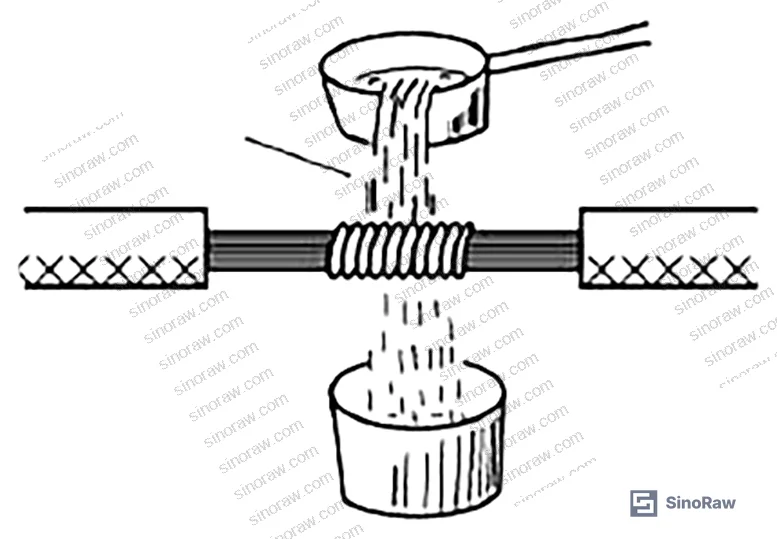
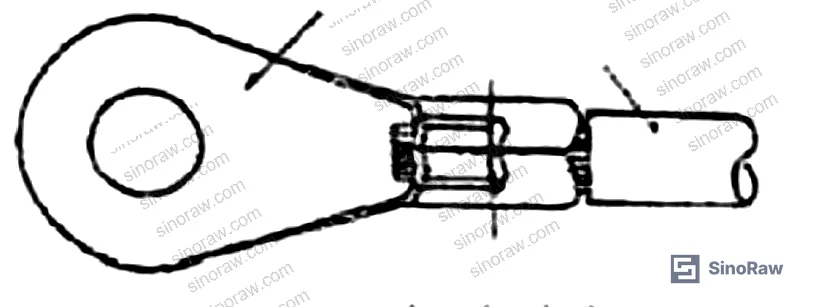
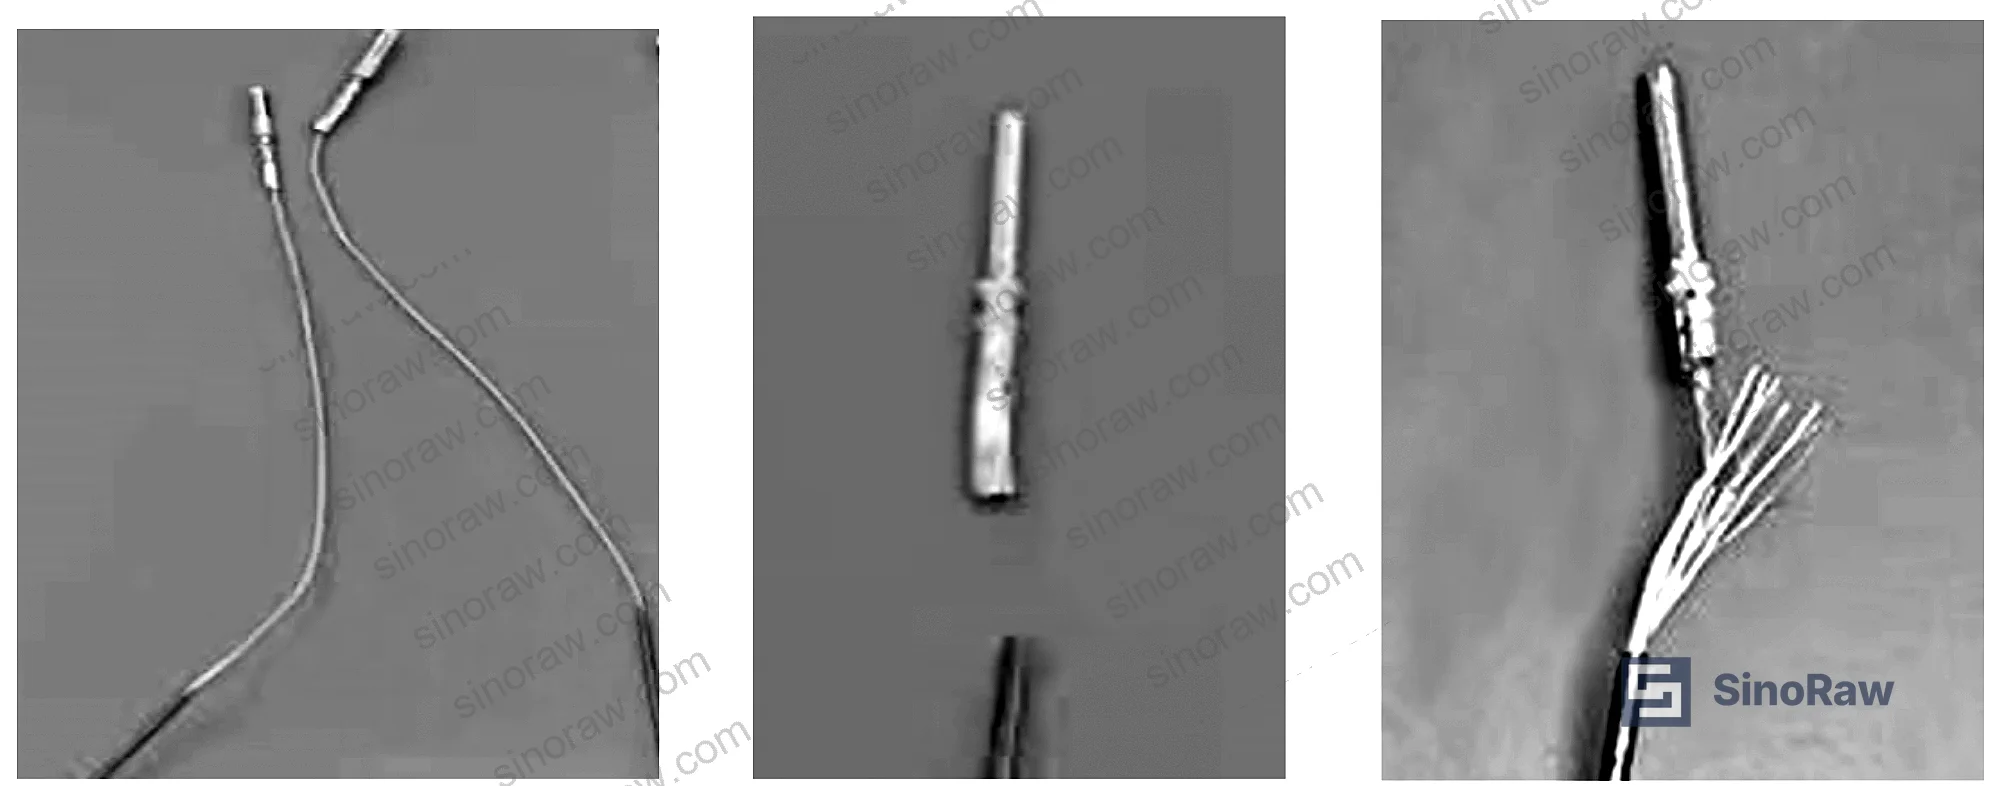
Two fundamental joining technologies dominate connector terminal assembly: soldering and crimping. Soldering uses a molten filler metal that wicks into the joint by capillary action, bonding conductor and terminal barrel together chemically and mechanically. Crimping applies mechanical deformation to the terminal barrel at ambient temperature, forcing the barrel wall into intimate contact with the conductor strands — a permanent, cold-worked joint that cannot be nondestructively inspected after assembly. Both hot and cold crimp variants are available.
The five assembly configurations tested were:
- Direct soldering
- Soldering with two supplementary 0.35 mm² wire strands added
- Soldering with one supplementary 0.35 mm² wire strand added
- Direct crimping
- Crimping with three supplementary 0.35 mm² wire strands, using the 0.35 position die setting
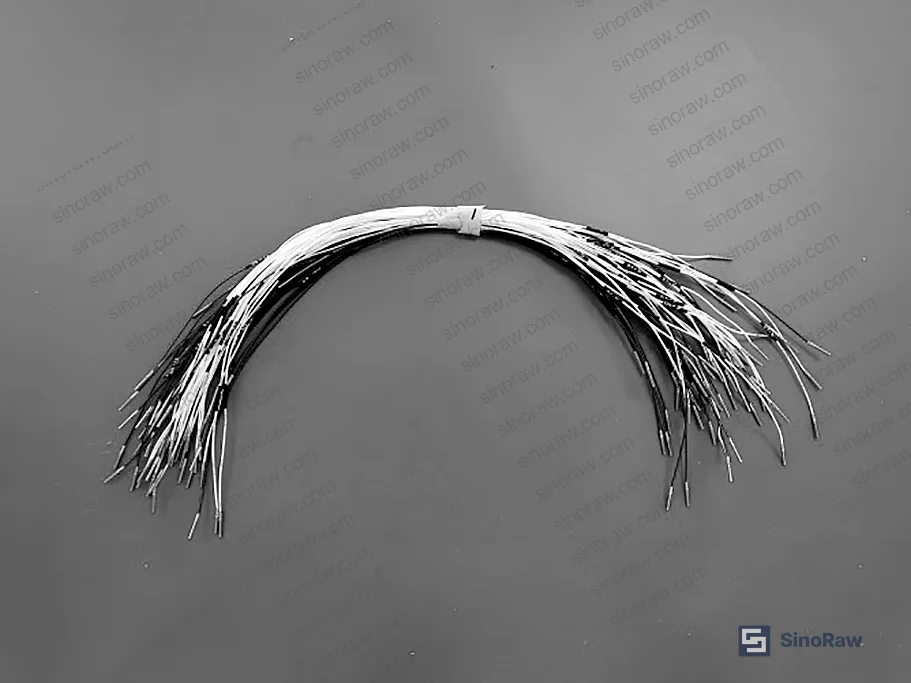
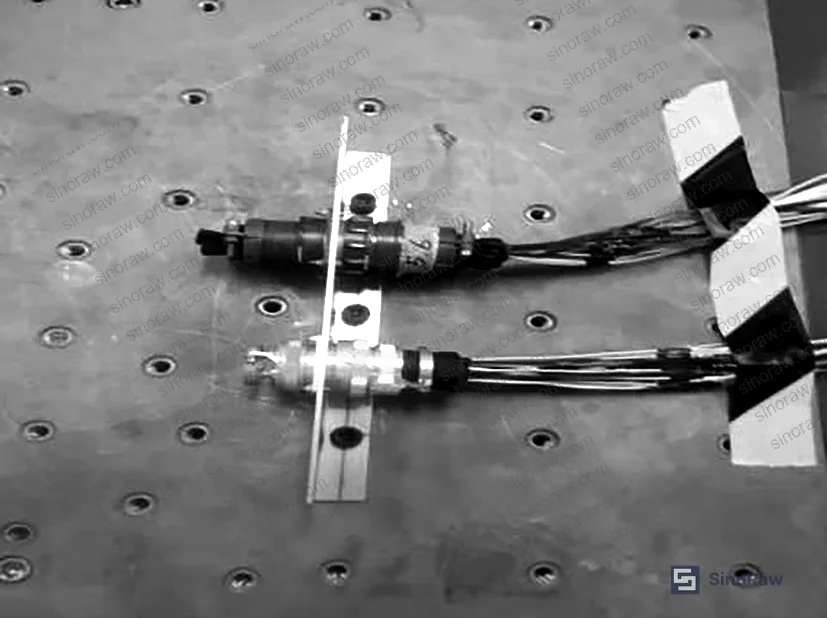
The EIA-364 series test standards were used throughout — a framework widely applied in aerospace-grade electrical hardware qualification. Tensile testing was conducted per EIA-364-08B at a pull rate of 25 ± 6 mm/min until separation occurred at the terminal mount, conductor, or insulation. Vibration testing ran sinusoidal sweeps per EIA-364-28D Condition III: frequency range 10 to 2000 to 10 Hz, double amplitude 1.52 mm, acceleration 15 g, two perpendicular axes (X and Y), 12 cycles per axis, one cycle = 20 min, total 8 hours. Salt spray was per EIA-364-26B Condition A: temperature 35 (+1/-2)°C, NaCl concentration 5 ± 1%, pH 6.5–7.2, 96-hour duration, deposition rate 0.5–3.0 mL/(80 cm²·h).
| Assembly Method | Peak Initial Pull Force (N) | Post-Thermal Shock Pull Force | Post-High-Temp Pull Force | Corrosion Observed |
|---|---|---|---|---|
| Direct soldering | 125.13 | Reduced significantly | Reduced significantly | Light rust after vibration + salt spray |
| Solder + 2×0.35 mm² strands | 156.98 | Stable | Reduced but highest | None across all conditions |
| Solder + 1×0.35 mm² strand | 148.85 | Variable | Reduced by ~50% | None |
| Direct crimping | 103.92 | Reduced significantly | Reduced significantly | Rust after thermal shock + salt spray |
| Crimp + 3×0.35 mm² strands | 114.20 | Moderate reduction | Moderate reduction | Rust after thermal shock + salt spray |
The solder + 2×0.35 mm² strand method consistently produced both the highest pull-off forces and the most concentrated data distribution. Direct crimping and the augmented crimp variant tracked closely to each other throughout — showing that adding wire strands to a crimped assembly provides less improvement than the same intervention applied to a soldered joint.
Honestly, most procurement teams over-specify contact resistance and under-specify pull-off force retention after environmental cycling. The initial pull-off value tells you almost nothing useful. What matters is the post-stress retention, and that is what separates a reliable connector terminal from one that passes incoming inspection and fails six months into service.
Failure Modes, Salt Spray Performance, and High-Temperature Degradation in Industrial Connector Terminals #
Understanding how these terminals actually fail under test conditions changes how you write your qualification criteria.
Three distinct failure modes were catalogued:
- Insulation break (fracture at the wire insulation)
- Terminal mounting break (pull-out from the terminal barrel)
- Conductor break (wire strand fracture)
The failure mode distribution is not random. After damp-heat cycling, approximately 90% of failures occurred at the insulation break location — the terminal barrel connection remained intact. This means the damp-heat data does not actually reflect the connection quality; the insulation layer failed first, making all pull-force measurements from that test condition invalid for assessing terminal-to-wire bond strength. Those data points were correctly excluded from comparative analysis.
In supplier qualification, this kind of failure mode ambiguity is exactly what separates a technically capable test lab from one that just produces numbers. When we reviewed qualification data from multiple connector suppliers, the ones who could not explain their failure mode distribution — or who reported clean tensile results without identifying which fracture location dominated — were the ones whose product performance was least predictable in the field.
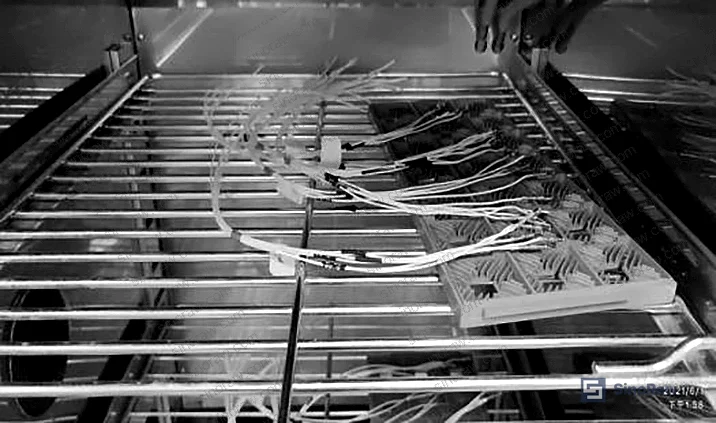
On corrosion resistance: direct soldering showed light surface rust after the combined vibration-plus-salt-spray sequence. The mechanism is well-understood — vibration opens micro-cracks in the solder fillet, increasing salt spray penetration area. Both crimp configurations (direct crimp and augmented crimp) showed rust after thermal shock followed by salt spray. The thermal shock protocol ran from -55°C to +125°C with 0.5-hour dwell times and ≤5-minute transition intervals for five cycles — rapid thermal cycling increases metal brittleness and promotes micro-cracking that makes the crimp barrel more permeable to corrosive media.
The solder + 1×0.35 mm² strand and solder + 2×0.35 mm² strand methods showed no corrosion damage under any test condition. This is the most important corrosion finding: augmented soldering provides a complete corrosion-resistance advantage over all crimp variants when the assembly will see combined thermal and salt environments.
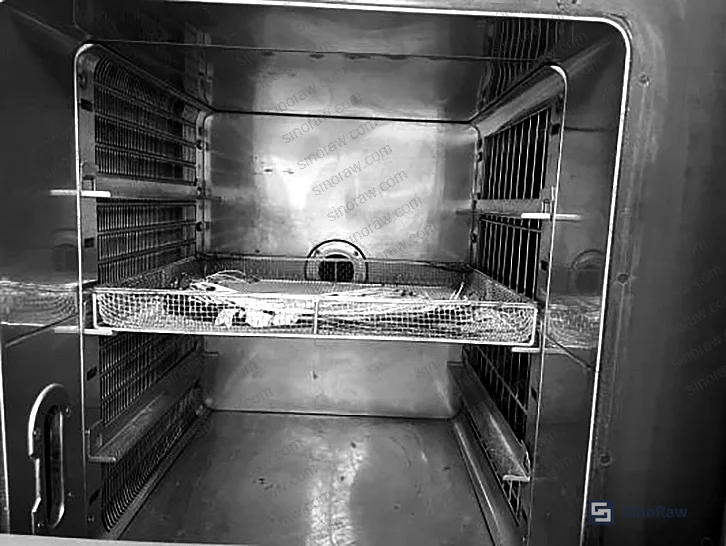
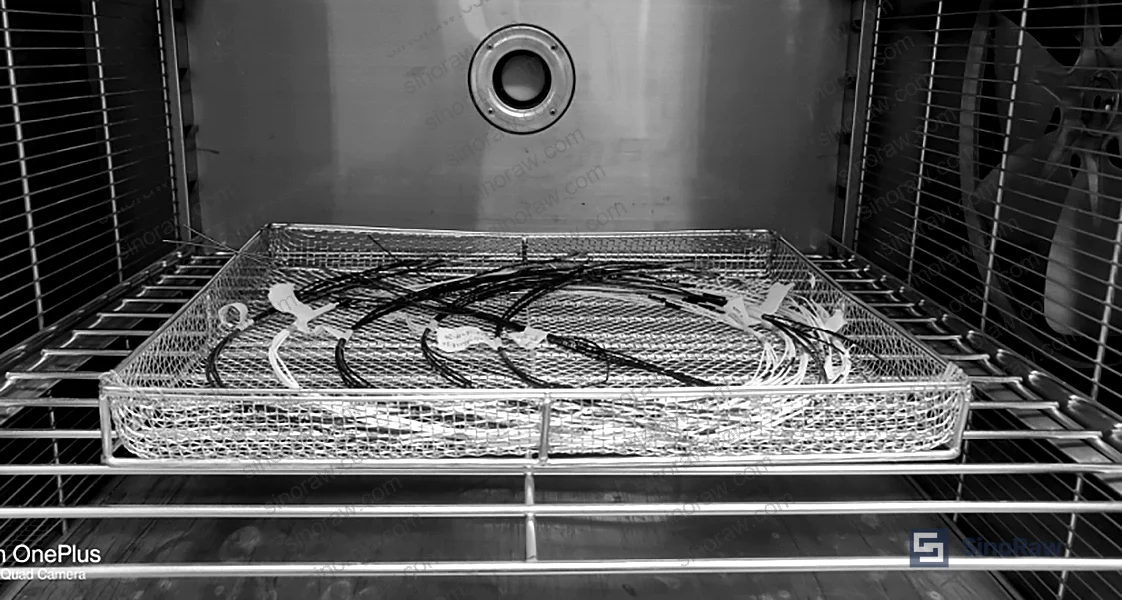
High-temperature exposure at 150°C for 120 hours degraded pull-off force across all five process variants. The most severe degradation was in the solder + 1×0.35 mm² strand configuration, which showed approximately 50% reduction in pull force relative to initial values — making this the worst performer under sustained thermal load despite its reasonable initial values. Direct soldering and direct crimping also showed significant force reduction at elevated temperature. The solder + 2×0.35 mm² strand method showed the highest absolute values even after high-temperature aging, though with measurable reduction from baseline.
Most procurement teams don’t realize that EIA-364 high-temperature exposure is often the most discriminating test in the sequence — more so than salt spray. The salt spray results for all five methods look reasonably similar until you layer in the thermal pre-stress. The combination test is where crimp-only assemblies start to show structural vulnerabilities that are invisible in standalone testing.
Connectors in this category should also be evaluated against ISO 9001:2015 Quality management systems documentation requirements — process control traceability for crimping force, solder temperature profile, and wire preparation are all within scope of a robust QMS audit. Suppliers who cannot produce process parameter records are not suppliers you want making connectors for harsh-environment applications.

Practical Guidance for Buyers #
When you are sourcing industrial connector terminals intended for vibration, salt spray, or high-temperature service, the assembly process specification is non-negotiable — and it is frequently missing from Chinese supplier datasheets. Ask for it explicitly.
The data is clear on process ranking for combined mechanical and corrosion performance: soldering with supplementary conductor strands outperforms direct soldering, and all solder variants outperform crimp variants on corrosion resistance after thermal pre-stress. For applications where high-temperature sustained exposure (above 120°C) is the primary concern, augmented soldering with two 0.35 mm² strand additions delivers the best retention — but specify a pull-off force floor post-exposure, not just an initial value. For pure mechanical applications without sustained heat, augmented crimping is simpler to implement at volume but will not match the soldered joint’s resistance to combined thermal-corrosion loading.
Sampling inspection should follow ISO 2859-1:1999 Sampling procedures for inspection by attributes — and if your supplier cannot tell you what AQL level their process controls are set to, that is a red flag. Also confirm REACH Regulation (EC) No 1907/2006 compliance for the solder alloy composition, particularly in applications subject to EU export requirements.
At sinoraw.com, our sourcing team works specifically with verified Chinese connector and electrical hardware manufacturers — helping overseas procurement engineers identify and qualify suppliers before committing to volume orders. If your application involves extreme environment service and you need to validate that a supplier’s process documentation and test data are credible, that is exactly the kind of pre-RFQ evaluation we support.
Need help identifying qualified suppliers for industrial connector terminals? Talk to our sourcing team →
Supplier Qualification Questions #
- What is your documented minimum pull-off force specification for 0.2 mm² conductor cross-section terminals, and can you provide batch release test data per EIA-364-08B showing individual pull values — not just average — at a pull rate of 25 ± 6 mm/min?
- Which failure mode dominates in your pull-off force test results — insulation break, terminal mount break, or conductor break — and how do you handle insulation-break failures in your pass/fail determination?
- For salt spray qualification, what is your test duration and NaCl concentration per EIA-364-26B, and do you run salt spray on pre-stressed samples (post-vibration or post-thermal shock) or only on virgin assemblies?
- What is the measured pull-off force retention after 120 hours at 150°C for your standard assembly configuration, expressed as a percentage of initial force, and what process parameter controls this retention?
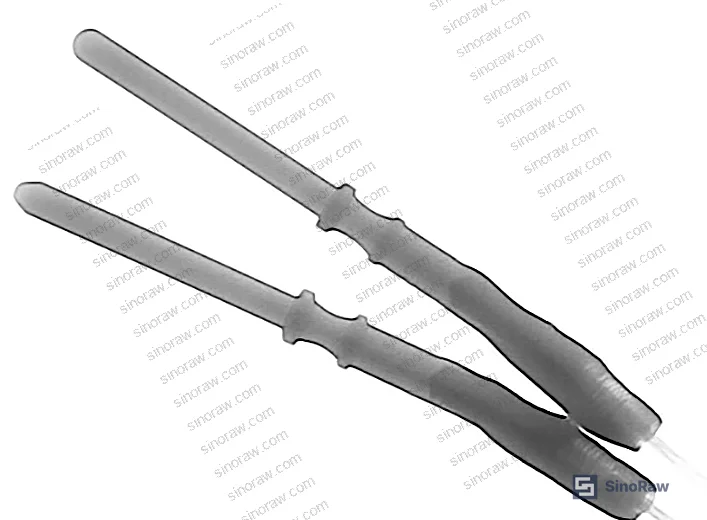
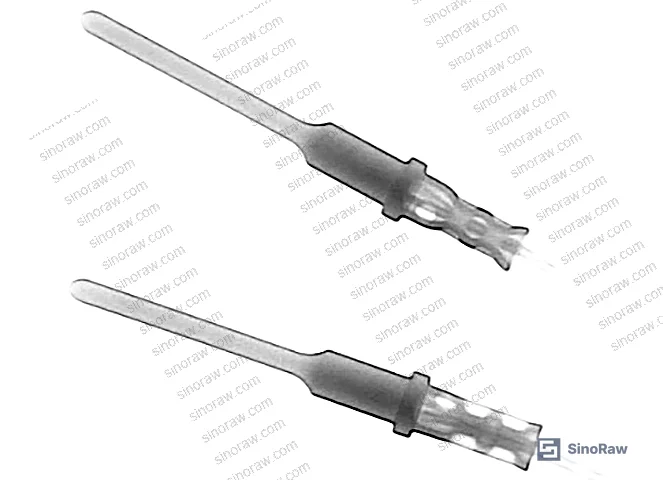
- Can you provide X-ray inspection images showing internal solder fill or crimp barrel deformation for your standard assembly configuration, and what is your process specification for solder temperature profile or crimp tooling die setting?
Sourcing Checklist #
- ☐ Supplier provides pull-off force test data per EIA-364-08B with individual specimen values (not average only), all ≥44 N for 0.2 mm² conductor
- ☐ Supplier’s process documentation specifies assembly method (solder vs. crimp) and key parameters (solder temperature profile or crimp die position and force)
- ☐ Salt spray test report per EIA-364-26B Condition A confirms no corrosion after 96-hour exposure on samples that have been pre-stressed with vibration or thermal cycling
- ☐ Supplier can identify dominant failure mode (insulation break vs. terminal mount break vs. conductor break) and excludes insulation-break failures from tensile performance claims
- ☐ Post-thermal-shock (EIA-364-32D, -55°C to +125°C, 5 cycles) pull-off force values are documented and show retention above the 44 N minimum reference
- ☐ High-temperature aging at 150°C for 120 hours has been conducted and pull-force retention data is available for the specific assembly configuration being quoted
- ☐ ISO 9001:2015 certificate is current and scope explicitly covers connector terminal assembly processes
- ☐ REACH compliance documentation is available for solder alloy composition, identifying lead content and any SVHC substances
Key Specifications Table #
| Parameter | Recommended Value | Verification Method |
|---|---|---|
| Minimum pull-off force (0.2 mm² conductor) | ≥44 N (reference minimum); target ≥130 N for augmented solder process | EIA-364-08B tensile test at 25 ± 6 mm/min pull rate |
| Salt spray exposure resistance | No corrosion after 96 h at 5±1% NaCl, pH 6.5–7.2, 35°C | EIA-364-26B Condition A, applied post-vibration or post-thermal shock |
| Vibration endurance | Pull-off force retention with no corrosion after 10–2000–10 Hz sweep, 15 g, 8 h total | EIA-364-28D Condition III, sinusoidal, X and Y axes |
| Thermal shock resistance | Pull-off force measurable and above 44 N after -55°C to +125°C cycling | EIA-364-32D, 5 cycles with ≤5 min transition time |
| High-temperature pull force retention | ≤20% degradation from initial value after 120 h at 150°C | EIA-364-17 high-temperature exposure test |
| Conductor cross-section compatibility | 0.2 mm² wire with appropriate die or solder specification per assembly method | X-ray inspection of internal structure per assembled sample |
Can’t find a supplier meeting these specs? Submit your requirements and we’ll match you within 48 hours.
References #
Data source: Environmental Stress Effects on Pull-Off Force and Corrosion Resistance of Aircraft Connector Terminals Assembled by Soldering and Crimping Processes, M. Qian et al., IEEE Transactions on Components, Packaging and Manufacturing Technology, 2025
Frequently Asked Questions #
Which assembly process produces the highest pull-off force for 0.2 mm² conductor terminals?
Soldering with two supplementary 0.35 mm² wire strands consistently produced the highest and most consistent pull-off force values, peaking above 156 N in initial testing and maintaining the highest absolute values after all six environmental stress conditions.
Does adding wire strands to a crimped assembly improve performance the same way it does for soldered assemblies?
No. Adding three supplementary 0.35 mm² strands to a crimped assembly showed negligible improvement over direct crimping across most test conditions — the two methods tracked closely throughout the test program. The augmentation benefit is process-dependent and is substantially more pronounced in soldered joints.
Why were damp-heat cycle results excluded from the tensile performance comparison?
After damp-heat cycling, approximately 90% of sample failures occurred at the insulation break location rather than at the terminal-to-conductor interface. When the insulation fails before the terminal connection, the measured pull force reflects insulation tensile strength, not terminal bond quality — making those data points invalid for assessing assembly process quality.
What causes corrosion in crimp terminals that passes initial salt spray testing but fails combined stress testing?
Thermal shock cycling — specifically the rapid temperature transition from -55°C to +125°C — increases metal brittleness and can generate micro-cracks in the crimp barrel. These micro-cracks expand salt spray penetration area in subsequent corrosion testing, causing corrosion failures that would not appear in salt spray testing run on unstressed samples. This is why sequential combined testing is more meaningful than standalone environmental tests.
Is crimping a valid choice for connector terminals in harsh environments?
For pure mechanical applications without sustained high-temperature or combined thermal-corrosion loading, crimping is practical and suitable for high-volume production. Its weakness shows up specifically when the assembly sees both thermal shock and salt spray in sequence — both crimp variants showed rust under those conditions while augmented soldered assemblies did not. For mixed-environment deployments, soldering is the more reliable choice.
Published by sinoraw.com Technical Team | Request a sourcing quote


