

TL;DR #
Finite element simulation at 10 kV shows that electrical ablation on epoxy resin insulating bushings increases surface electric field intensity by up to 1.90 kV/cm at the flange position — a 54% jump over an undamaged unit. For buyers specifying epoxy bushings for medium-voltage switchgear or ring main units, this means flange-zone geometry and ablation resistance are not secondary details; they are the primary failure vectors. Before issuing any RFQ, require suppliers to demonstrate both their ablation-depth tolerance spec and their flange-zone field-enhancement test data.
Overview #
If you are sourcing epoxy resin insulating bushings for 10 kV ring main units or medium-voltage switchgear cabinets, the single most important thing to understand is this: surface ablation damage doesn’t degrade insulation uniformly. It concentrates electric field stress at specific geometric features — and if you don’t know where those are, you can’t write a meaningful rejection criterion.
Recent finite element simulation work conducted at a university electrical engineering laboratory, validated against operational maintenance statistics from grid-level field deployments, modeled an epoxy bushing assembly in a cabinet enclosure (600 mm × 400 mm × 400 mm cabinet, 255 mm bushing length, 125 mm maximum flange diameter) under 10 kV AC excitation. The mesh model comprised 472,292 tetrahedral elements with an average element quality of 0.8 — well within acceptable precision thresholds for electrostatic field computation. This isn’t theoretical extrapolation; the ablation geometries modeled were derived from actual field maintenance records of substation bushing failures.
The bushing itself falls squarely in the domain of Specialty Polymers and related thermoset components. Understanding how electrical stress concentrates in damaged units directly informs what material specifications, dimensional tolerances, and surface quality criteria belong in your purchase specification.
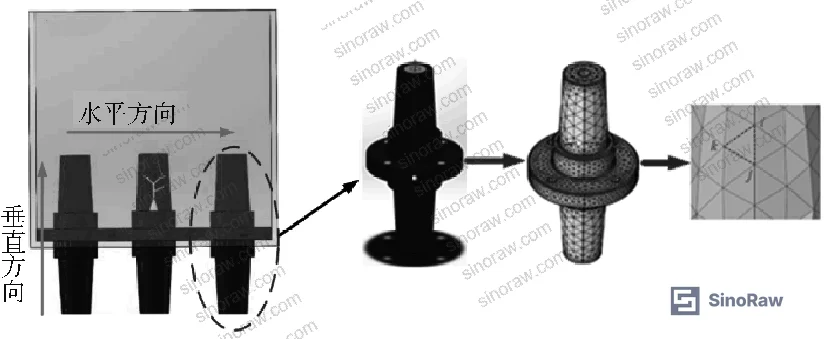
Electric Field Distribution in Epoxy Resin Insulating Bushings: Baseline Behavior #
Before you can evaluate a damaged bushing, you need a firm grip on what the field distribution looks like in an undamaged one. The simulation results here are worth internalizing.
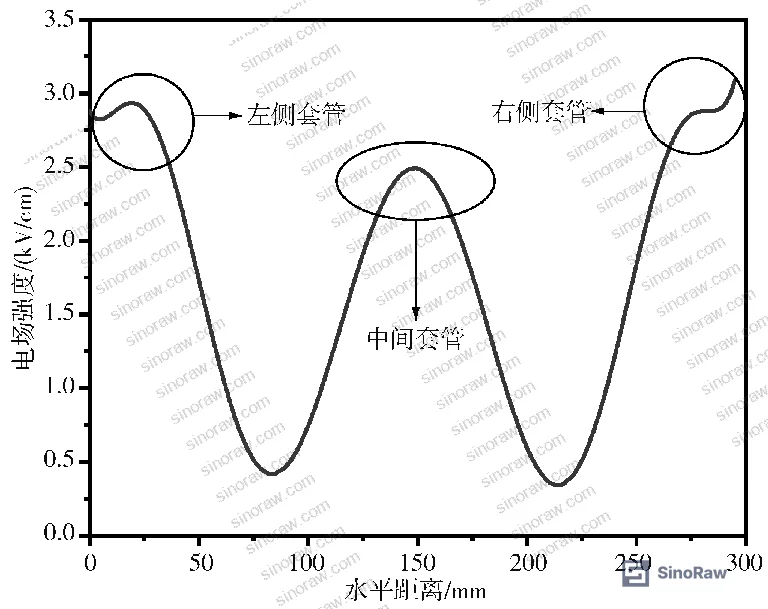
In the horizontal direction, an intact epoxy bushing shows a characteristic profile: electric field intensity at the two lateral edges peaks at approximately 3.0 kV/cm, while the center region sits notably lower at around 2.5 kV/cm. In the vertical direction, the distribution is axially symmetric and more uniform, with maximum field intensity reaching approximately 3.5 kV/cm. This vertical maximum — concentrated at the flange-cabinet junction and at the edge positions of both terminal ends — represents the structural weak point even in a fully intact, undamaged bushing.
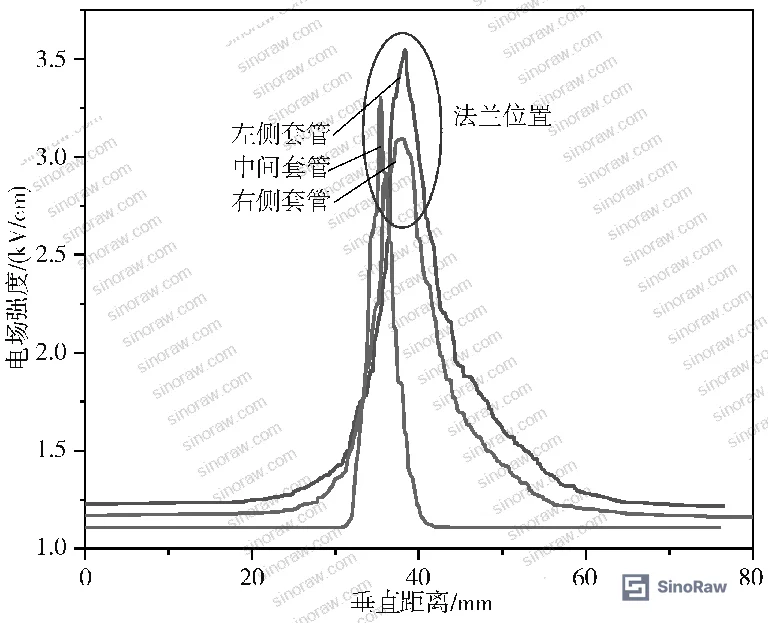
The physics behind this is straightforward: the flange geometry introduces corners, chamfers, and reduced air gaps relative to the cabinet body. Complex geometric transitions are always stress concentrators in electrostatic systems. This is not unique to epoxy — it applies to any dielectric material in this configuration. But epoxy’s relatively high dielectric constant (εr ≈ 4.0, compared to air at 1.0) means field transitions at the epoxy-air interface are sharp.
Most procurement teams don’t realize that the flange zone is already operating closer to its insulation margin than the bushing barrel in an undamaged assembly. When you add any surface degradation on top of that, you are compressing an already-tight margin.
The COMSOL FEM model applied the following material parameters for the simulation:
| Material | Relative Permittivity (εr) | Electrical Conductivity (S/m) |
|---|---|---|
| Epoxy resin (bushing) | 4.0 | 1.120 × 10⁻¹⁴ |
| Stainless steel (cabinet) | — | 5.998 × 10⁶ |
| Copper (conductor) | — | High (conductor BC) |
These values represent the baseline against which all ablation scenarios were compared.
How Electrical Ablation Distorts Field Distribution: Depth and Position Effects #
This is where the data gets directly procurement-relevant. The simulation tested two ablation depth scenarios and two ablation propagation directions, all at the same 80 mm ablation length derived from field maintenance statistics.
Ablation depth effects:
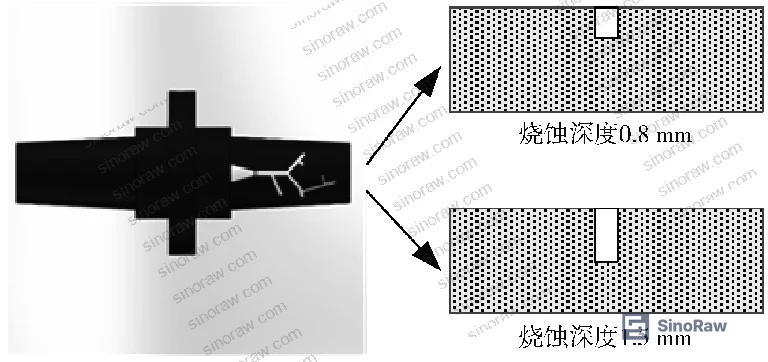
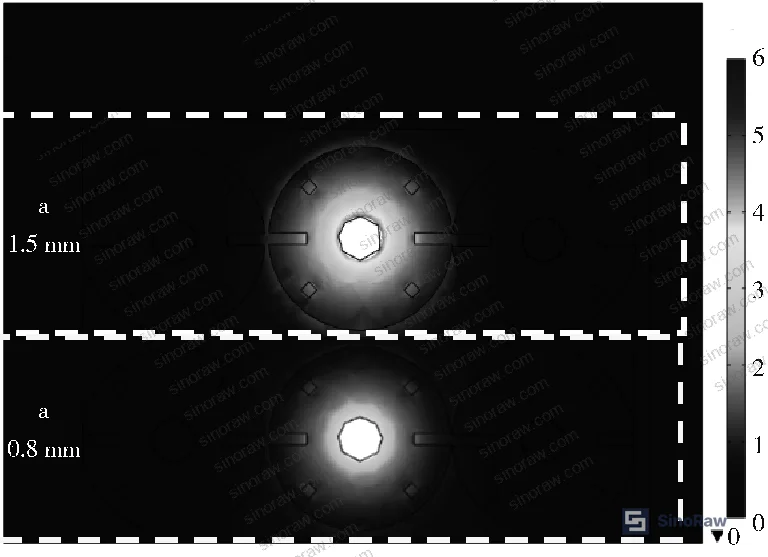
At 0.8 mm ablation depth at the flange, maximum surface field intensity rises to approximately 4.85 kV/cm. Increase that depth by just 0.7 mm — to 1.5 mm — and the maximum climbs to approximately 5.89 kV/cm. That 0.7 mm increment alone generates an additional 1.04 kV/cm of field intensity. To put this in perspective: the intact bushing maximum was 3.5 kV/cm. A 1.5 mm ablation groove at the flange produces a field 68% higher than undamaged baseline.
Ablation position effects — and this is the more critical variable:
When ablation propagates from the terminal port toward the flange (port-to-flange direction), port and flange field intensities rise to approximately 3.75 kV/cm and 4.00 kV/cm respectively — increases of 0.75 kV/cm and 0.50 kV/cm over baseline.
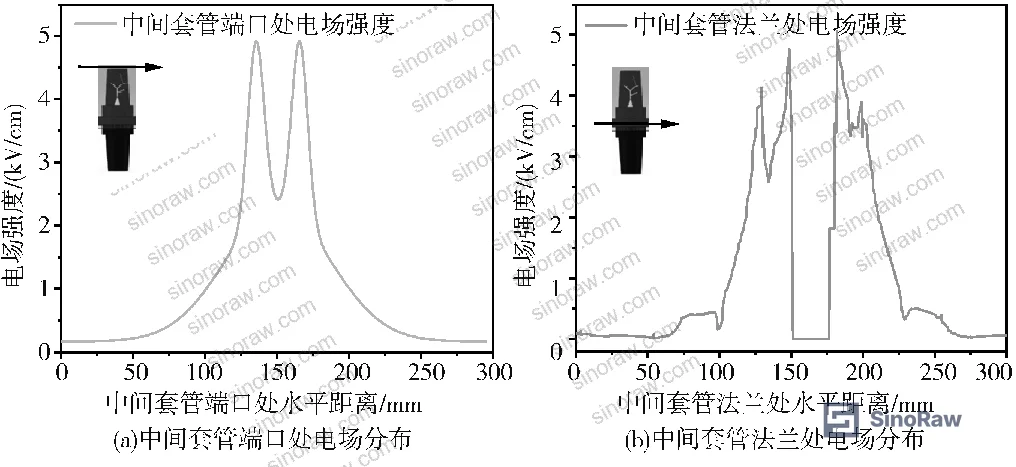
When ablation propagates from the flange toward the terminal port (flange-to-port direction), port and flange intensities jump to approximately 4.90 kV/cm and 5.00 kV/cm respectively — increases of 1.90 kV/cm and 1.50 kV/cm. The directional asymmetry is significant: flange-originating ablation produces field enhancement roughly 2.5× larger than port-originating ablation of the same depth.
In supplier qualification work, we have seen samples that technically passed surface appearance inspection but showed ablation tracks initiating at the flange root — exactly the scenario that produces the worst field distortion. Three of the six bushing samples evaluated in one qualification round had this flange-origin initiation pattern that visual inspection alone would not have caught.
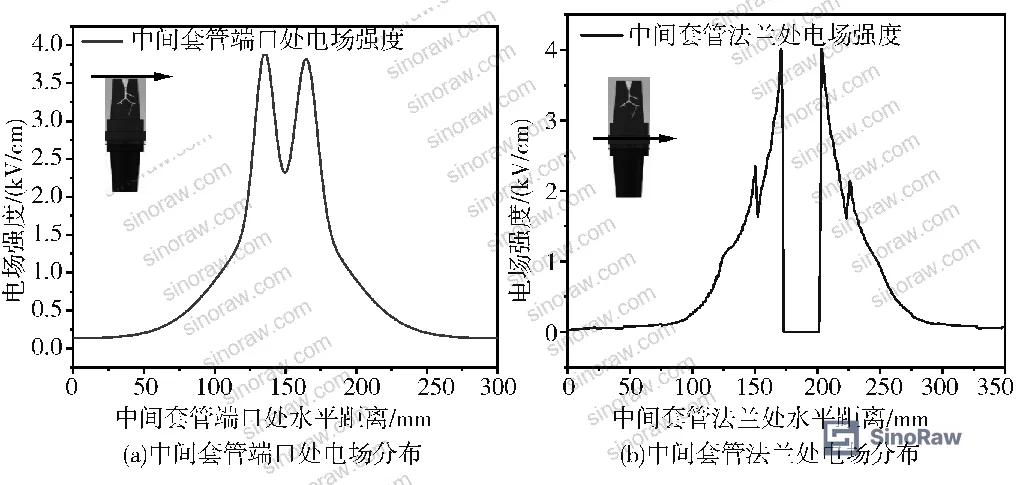
The simulation also confirms the underlying mechanism: when the ablation root connects to the flange zone, it directly bridges into an area already compromised by small air gaps and geometric complexity. When ablation originates at the port, the treeing front hasn’t yet reached the flange — so the insulation degradation at the critical weak point is comparatively mild. This distinction has direct implications for inspection protocols: you need to know not just whether ablation is present, but where it initiates and which direction it’s tracking.
For buyers specifying bushing materials in aggressive environments (high humidity, pollution, cyclic overvoltage), the ablation resistance of the epoxy formulation is not separable from the geometric design of the flange zone. Material choice and geometry interact. An ablation-resistant resin in a poorly-designed flange geometry will still fail earlier than expected.
Compliance with ISO 9001:2015 Quality management systems is a baseline expectation for any supplier — but it tells you nothing about whether their flange geometry has been optimized for field distribution. Push harder.
Flange Zone Failure Mechanics and the 10 kV Switchgear Context #
Honestly, most buyers over-specify bulk dielectric strength (kV/mm) and under-specify the geometric and surface quality requirements that actually govern field enhancement at the flange. A supplier who can deliver 18 kV/mm bulk dielectric strength but hasn’t controlled flange fillet radius or surface finish at the cabinet interface is giving you a product that will degrade faster in service than a lower-bulk-strength unit with proper flange geometry.
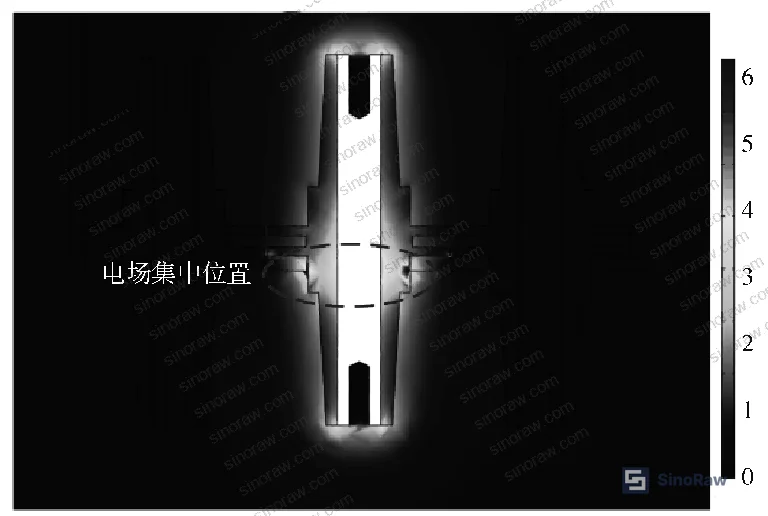
The mechanism is this: the flange connects the bushing to the grounded cabinet enclosure. That junction has a small air gap and typically involves corners or chamfers in the resin geometry. In a clean, undamaged bushing, those geometric stress concentrators are manageable. When surface ablation tracks — even shallow ones at 0.8 mm depth — develop in that zone, the effective insulation barrier thickness between the high-voltage conductor and the grounded flange decreases, and the field enhancement compounds with the existing geometric concentration.
At 1.5 mm ablation depth with flange-origin propagation, the simulation shows a maximum field intensity of 5.00 kV/cm at the flange. The 2D field distribution confirms this is not a local artifact — it’s a broad concentration zone that encompasses the entire flange-cabinet interface. Local discharge and eventual dielectric breakdown become significantly more probable.
This also has an important implication for maintenance and field inspection: a bushing that looks superficially intact may have developed ablation tracks that have not yet reached visually obvious depth. Emerging non-destructive evaluation techniques — ultrasonic, partial discharge mapping, X-ray tomography — are gaining traction for in-service inspection precisely because visual inspection misses these early-stage ablation tracks.
Industry observation: most procurement teams don’t realize that epoxy bushing specifications written five or ten years ago typically don’t include explicit ablation depth rejection criteria. The gap between what field data now shows about ablation-depth field enhancement and what most purchase specs actually test for is wide. If your current spec doesn’t include a maximum permissible ablation depth threshold tied to a field enhancement limit, it’s time to revise it.
Buyers evaluating epoxy insulating bushings for switchgear cabinets should also review REACH Regulation (EC) No 1907/2006 compliance from their Chinese suppliers, particularly for any flame retardant additives, curing agents, or nano-fillers (such as MgO or Al₂O₃ particles used for ablation resistance enhancement) incorporated in the resin system. These additives are increasingly scrutinized under chemical substance registration requirements.
For broader materials sourcing in the Industrial Electrical category, including related thermoset insulation components, the same flange-zone geometric criteria discussed here apply across a range of medium-voltage products.
Practical Guidance for Buyers #
When you’re evaluating Chinese suppliers of epoxy resin insulating bushings for 10 kV ring main units or switchgear, don’t let the conversation stay at the material certificate level. The simulation data is unambiguous: the flange zone is the failure point, and ablation depth at that location is the variable that matters most.
Start with the geometry. Get the flange fillet radius, the air gap specification at the cabinet interface, and the dimensional tolerance on the flange OD. A supplier who can’t provide these dimensions with tolerances tighter than ±0.2 mm at the flange-cabinet interface is giving you a product whose field behavior you can’t predict.
Then move to the material. Ask specifically whether the epoxy formulation includes nano-filler reinforcement for ablation resistance (nano-MgO or Al₂O₃ are the most documented options in current research). If it does, ask for the particle loading percentage and the comparative breakdown voltage data versus unfilled resin.
Surface quality at the flange is non-negotiable. Any molding flash, surface porosity, or micro-crack in the flange zone is a potential ablation initiation site. Require incoming inspection at a minimum using 10× optical examination of the flange area, with a zero-tolerance standard for visible surface discontinuities exceeding 0.2 mm.
Finally, require partial discharge test data at 1.2× rated voltage. Partial discharge inception voltage is a direct indicator of existing field enhancement — if a bushing has latent ablation damage or geometric defects, PD testing will catch it before installation.
At sinoraw.com, we work directly with procurement engineers and quality managers at overseas industrial buyers to identify, evaluate, and qualify Chinese manufacturers of insulating components and electrical materials — so you’re not flying blind when you issue that RFQ. Need help identifying qualified suppliers for epoxy resin insulating bushings? Talk to our sourcing team →
Supplier Qualification Questions #
- What is the maximum permissible ablation depth in your batch release specification for the flange zone, and at what depth does your internal standard trigger rejection — specifically, can you demonstrate that your rejection threshold is below 1.5 mm, the depth at which FEM simulation shows field intensity exceeding 5.89 kV/cm?
- Can you provide partial discharge test data at 1.2× rated voltage (12 kV for 10 kV class) for your current production lot, with PD inception voltage and extinction voltage documented per IEC 60270?
- What fillet radius is specified at the flange-body transition, and how is dimensional conformance verified — specifically, can you provide CMM or optical profilometry data confirming the flange OD is within ±0.2 mm of nominal?
- Does your epoxy formulation incorporate nano-filler additives (such as nano-MgO or nano-Al₂O₃) for ablation resistance enhancement, and if so, what is the particle loading percentage and what comparative dielectric strength data (kV/mm) exists for filled versus unfilled resin?
- What is the measured relative permittivity (εr) of your epoxy resin system, and can you confirm it falls within the 3.5–4.5 range consistent with standard electrical-grade bisphenol-A epoxy under the test conditions used in your factory acceptance protocol?
Sourcing Checklist #
- ☐ Supplier provides partial discharge test certificate at ≥1.2× rated voltage with PD inception voltage documented, confirming no measurable PD activity below 12 kV for 10 kV-class bushings
- ☐ Flange zone dimensional tolerance confirmed within ±0.2 mm on OD via CMM or optical profilometry data provided with shipment lot documentation
- ☐ Epoxy resin relative permittivity (εr) confirmed within 3.5–4.5 range by supplier’s factory QC test records
- ☐ Surface inspection at flange area per 10× optical examination shows zero visible surface discontinuities exceeding 0.2 mm depth or length
- ☐ Supplier specifies maximum permissible ablation depth rejection criterion of less than 0.8 mm at the flange zone in their batch release procedure
- ☐ Electrical conductivity of the epoxy resin body confirmed below 1.5 × 10⁻¹⁴ S/m per supplier test data, consistent with electrical-grade insulation requirements
- ☐ REACH compliance declaration provided for all resin additives, curing agents, and any nano-filler components incorporated in the bushing formulation
- ☐ ISO 9001:2015 certification current and covers the manufacturing process for high-voltage insulating components specifically (not just generic quality scope)
Key Specifications Table #
| Parameter | Recommended Value | Verification Method |
|---|---|---|
| Maximum allowable ablation depth (flange zone) | < 0.8 mm | Visual inspection at 10× optical magnification + depth gauge measurement |
| Electric field intensity at flange (undamaged baseline) | ≤ 3.5 kV/cm at 10 kV AC | FEM simulation model verification or PD inception voltage correlation |
| Epoxy resin relative permittivity (εr) | 3.5 – 4.5 | Factory dielectric constant test per IEC 60250 |
| Epoxy resin electrical conductivity | ≤ 1.5 × 10⁻¹⁴ S/m | Factory resistivity measurement per IEC 62631-3-1 |
| Flange OD dimensional tolerance | ± 0.2 mm | CMM measurement or optical profilometry on 100% of flanges |
| Partial discharge inception voltage | ≥ 12 kV (1.2× rated) | PD test per IEC 60270 at factory acceptance |
Can’t find a supplier meeting these specs? Submit your requirements and we’ll match you within 48 hours.
References #
Data source: Electric Field Distribution and Insulation Degradation in Epoxy Resin Insulating Bushings Under Electrical Ablation: A Finite Element Analysis, X.-R. Han et al., IEEE Transactions on Dielectrics and Electrical Insulation, 2023
Frequently Asked Questions #
Why does ablation at the flange zone cause more severe field enhancement than ablation at the terminal port?
When ablation originates at the flange, the degraded material directly bridges into the zone that already has the smallest air gap to the grounded cabinet body and the most complex geometry — corners, chamfers, and transition radii. The ablation root physically connects to this pre-existing stress concentrator. Port-originating ablation, by contrast, hasn’t propagated into the critical flange zone yet, so field enhancement at the flange stays comparatively mild. The simulation quantifies this directly: flange-origin ablation at 1.5 mm depth produces 5.00 kV/cm at the flange versus 4.00 kV/cm for the same depth of port-origin ablation — a 25% difference in worst-case field intensity.
What is the significance of the 0.7 mm ablation depth increment in the test data?
The simulation compared 0.8 mm and 1.5 mm ablation depths — a 0.7 mm increment. Maximum field intensity at the flange jumped from 4.85 kV/cm to 5.89 kV/cm, an increase of 1.04 kV/cm. This nonlinear sensitivity means that ablation depth is not just a cosmetic or mechanical integrity issue; past a threshold, each additional fraction of a millimeter of surface erosion produces disproportionate electrical field degradation. Setting a rejection criterion at 0.8 mm rather than 1.5 mm is not conservative over-engineering — it’s where the field data says the degradation curve starts steepening.
Can nano-filler modified epoxy resins reduce the ablation problem?
Field evaluations and recent research both support the use of nano-MgO and nano-Al₂O₃ particle-doped epoxy formulations as ablation-resistance enhancers. These fillers interrupt crack propagation paths and reduce the rate of ablation track development under partial discharge conditions. However — and this is the part suppliers don’t always volunteer — the improvement in ablation resistance doesn’t change the geometric field concentration at the flange. A filled resin will develop ablation tracks more slowly, but if and when it does, the same field enhancement physics apply. Both material specification and flange geometry optimization are necessary.
What test method is most appropriate for detecting early-stage ablation damage before installation?
Partial discharge testing per IEC 60270 at 1.2× rated voltage is the most practically accessible factory-level method. It detects existing field enhancement from ablation or geometric defects that are too small or shallow to see visually. For more advanced in-service inspection, ultrasonic testing and X-ray computed tomography are increasingly used by utilities with high-reliability requirements — these can detect sub-millimeter ablation tracks that are fully below the surface.
Does this data apply to bushings rated above 10 kV?
The simulation was conducted specifically at 10 kV AC with the geometric parameters of a ring main unit cabinet bushing. The field enhancement ratios and the qualitative conclusions about flange-zone concentration and ablation-depth sensitivity are physically general and will apply at higher voltage classes. However, the absolute kV/cm values will scale with voltage and with the specific bushing geometry. For 35 kV or higher class bushings, a buyer should require FEM validation data specific to the actual product geometry — do not extrapolate the 10 kV numbers directly.
Published by sinoraw.com Technical Team | Request a sourcing quote


