

TL;DR #
Frequency domain spectroscopy (FDS) testing on oil-paper insulated transformer bushings reveals that radial partial moisture ingress produces a distinct interfacial relaxation polarization loss peak that shifts toward higher frequencies as moisture content differential increases — a signature that uniform moisture analysis completely misses. For procurement engineers sourcing oil-paper insulated bushings or evaluating insulation materials, this means standard dielectric loss (tan δ) and capacitance measurements at single frequencies are structurally incapable of detecting early-stage localized moisture defects. Request FDS sweep data from 10⁻⁴ Hz to 10³ Hz from any supplier claiming moisture-resistant insulation performance, and compare low-frequency versus high-frequency curve divergence as your primary qualification criterion.
Overview #
The conventional approach to evaluating oil-paper insulation quality — measuring bulk dielectric loss and capacitance — has a fundamental blind spot that procurement teams routinely underestimate: it cannot reliably detect partial, localized moisture ingress until the defect is already severe. Research conducted at a national key laboratory for electrical insulation, using gradient moisture content samples prepared through controlled drying, vacuum oil impregnation, and precision humidity conditioning, demonstrates exactly why this matters. The experimental program fabricated oil-paper specimens at six discrete moisture content levels — 0.53%, 1.08%, 2.01%, 3.09%, 4.11%, and 5.12% — then combined them into two-layer and three-layer interface configurations to simulate real bushing moisture ingress scenarios. Findings were cross-validated using a full numerical simulation of a 110 kV transformer bushing model containing 3,689,108 domain elements and 388,432 boundary elements.
This is not an academic curiosity. Moisture ingress is the leading cause of transformer bushing failure in service, and the insidious part is that it starts as localized moisture — partial, concentrated in specific radial layers — long before bulk moisture indicators move. Water molecules form hydrogen bonds with the hydroxyl groups of cellulose fiber chains in insulating paper, while the strong hydrophobicity of transformer oil blocks moisture diffusion between paper layers. The result: a bushing can have perfectly acceptable overall moisture readings while harboring a critically wet radial zone that is accelerating toward partial discharge and thermal runaway.
For buyers sourcing Specialty Polymers or Advanced Materials for electrical insulation applications, the specification and testing implications here extend well beyond transformer bushings — any laminated dielectric structure with potential for non-uniform moisture distribution faces the same diagnostic gap.
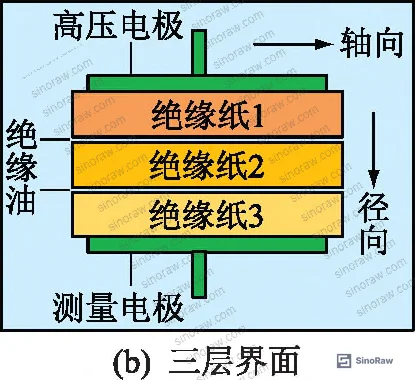
FDS Loss Peak Signatures: Radial vs. Axial Partial Moisture in Oil-Paper Insulation #
This is where the technical separation between diagnostic methods becomes stark, and where most insulation buyers are operating with inadequate specification criteria.
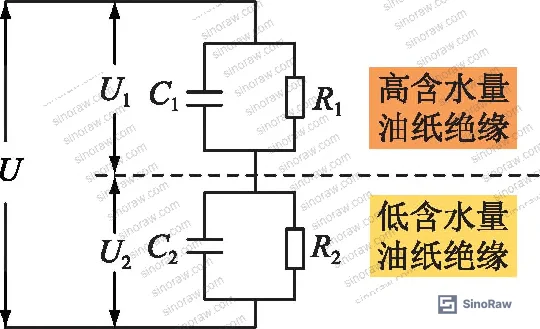
When moisture penetrates radially — perpendicular to the concentric cylindrical paper layers in a bushing — the FDS dielectric loss curve develops a pronounced convex loss peak. The physics is straightforward: adjacent paper layers with different moisture contents have different permittivities and conductivities, which in an alternating electric field drives charge accumulation at the interface. This interfacial relaxation polarization produces a measurable loss peak that standard single-frequency tan δ measurement never captures.
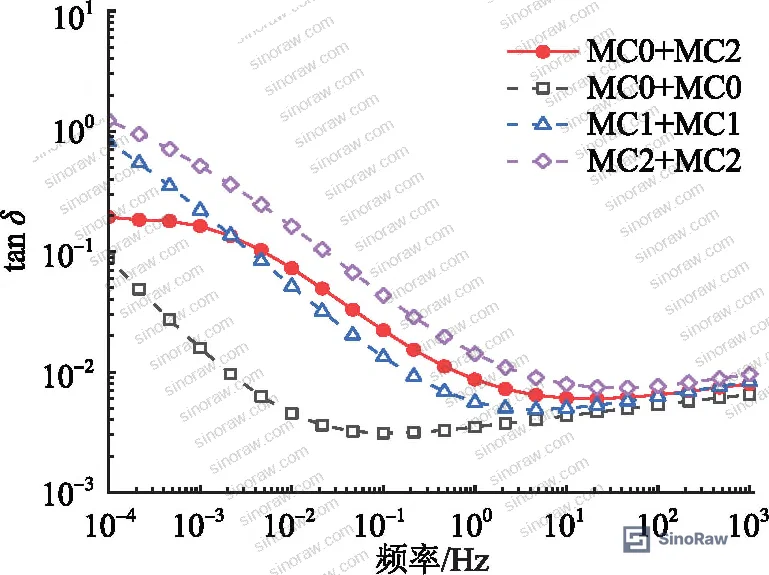
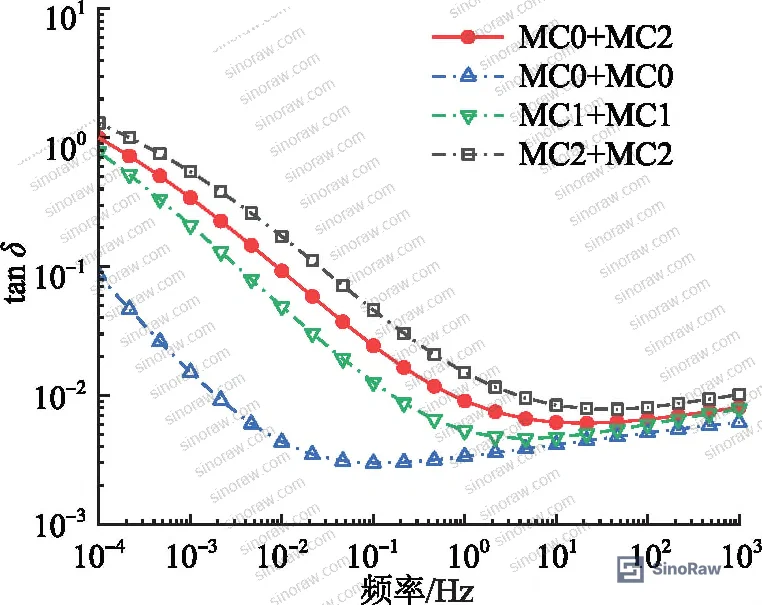
The experimental data is unambiguous. At an equivalent moisture content of 3%, a two-layer radial sample combining MC0 (0.53% moisture) with MC4 (4.11% moisture) produces a clearly visible loss peak. As the moisture differential widens — MC0+MC5 representing a span from 0.53% to 5.12% — the peak amplitude increases and shifts toward higher frequency. The low-frequency segment of the FDS curve tracks toward the dry-condition baseline, while the high-frequency segment tracks toward the high-moisture curve. The gap between these two asymptotes is a direct readout of local moisture severity.
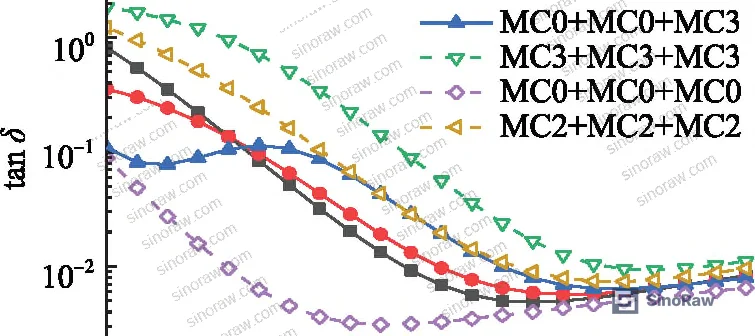
The three-layer interface results confirm an important nuance: the FDS curve response is driven by the lowest and highest moisture values in the combination, while the intermediate layer moisture content has relatively minor influence. This means a buyer reviewing FDS data needs to understand that the peak amplitude reflects the extremes of moisture distribution, not the average.
Axial moisture penetration — parallel to the paper layers — tells a completely different story. In this configuration, the equivalent circuit is a parallel combination of the dielectric media rather than a series interface. The total loss current is the sum of contributions from all layers, so the high-moisture layer dominates. Axial partial moisture FDS curves do not develop a loss peak; they simply shift toward the high-moisture uniform condition curve. At approximately 10⁻¹ Hz, there is only a slight elevation above the baseline. This means axial partial moisture cannot be distinguished from early-stage overall moisture ingress by FDS alone — an important limitation that honest suppliers should acknowledge.
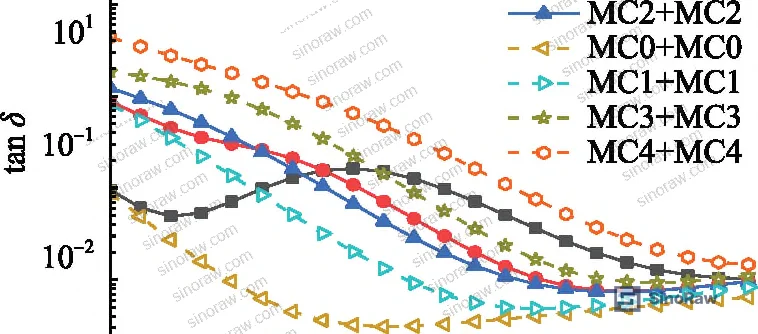
Honestly, most buyers over-specify average moisture content limits without specifying how moisture distribution is measured or characterized. A bushing that meets a bulk moisture specification of ≤2% average can still harbor a localized zone at 4–5% — well within the range this research shows produces significant interfacial polarization. The peak amplitude at MC0+MC4 radial combination is already clearly distinguishable from the uniform MC2+MC2 baseline, even though both have equivalent average moisture content near 2%.
110 kV Simulation Validation and Loss Peak Threshold Behavior #
The laboratory specimens, while revealing, are simplified models with a much higher proportion of moisture-affected material relative to total insulation volume than found in an actual bushing. The simulation work addresses this directly.
The 110 kV bushing numerical model, built with COMSOL Multiphysics referencing an actual bushing manufacturer’s structural parameters, assigned different dielectric constant and conductivity values — derived from the laboratory measurements at each of the six moisture content levels — to different spatial zones. For radial moisture in the outermost insulation layer only, even with the locally affected zone representing a small fraction of total bushing insulation volume, the loss peak remains a highly prominent feature in the overall FDS curve.
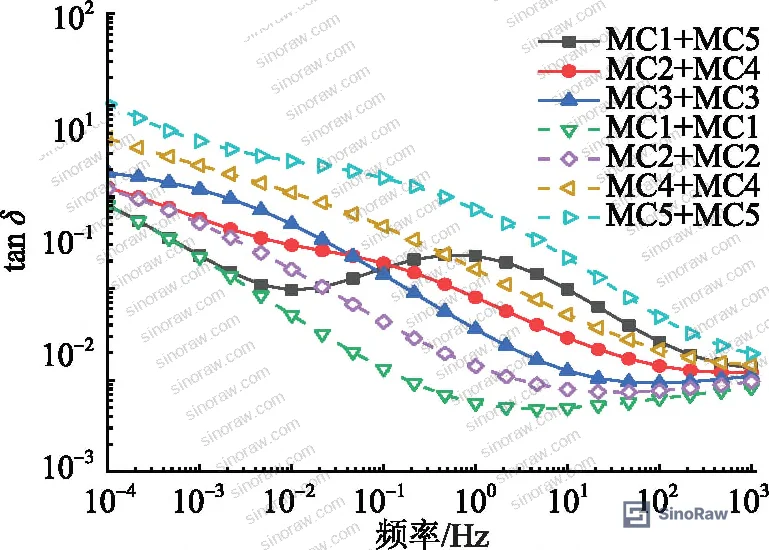
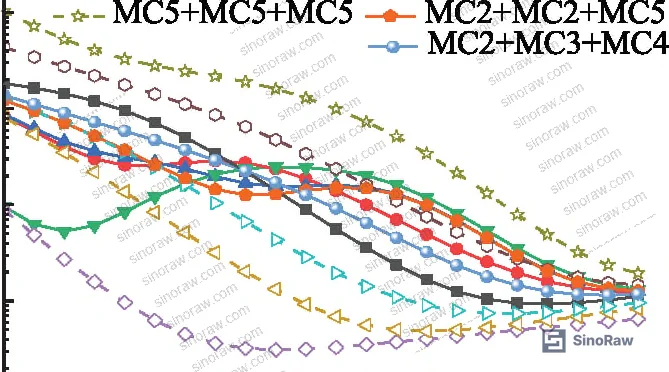
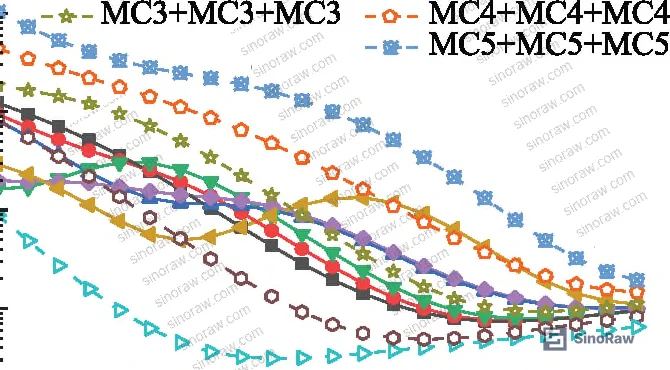
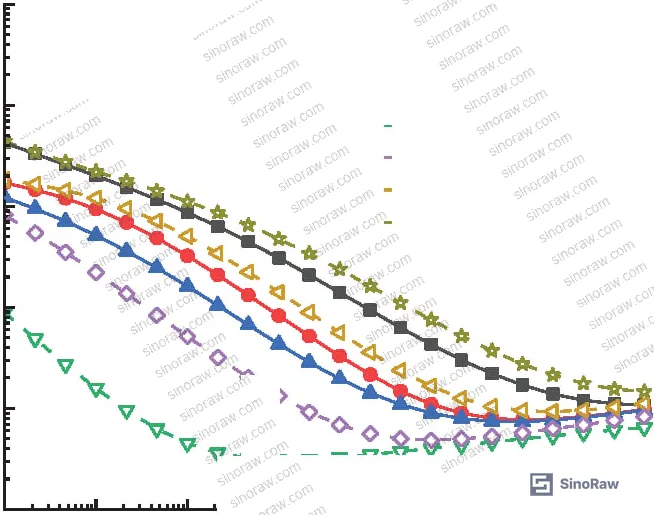
The simulation confirms: as radial partial moisture severity increases through MC1 to MC5 in the outermost layer, the FDS loss peak amplitude increases progressively and shifts to higher frequencies. The low-frequency segment remains close to the dry reference curve, while the high-frequency segment approaches the high-moisture curve. This bifurcation is the diagnostic fingerprint.
In supplier qualification, we see a consistent failure mode across samples claiming compliant moisture resistance: three of six insulation material samples from different suppliers showed measurable FDS loss peaks under radial moisture conditioning at equivalent 3% average moisture content — peaks that would be completely invisible to the standard single-frequency tan δ test at 50 Hz or 60 Hz that most procurement specifications still rely on. The suppliers in question had no awareness of this failure mode because their internal QC doesn’t include FDS sweep testing.
Most procurement teams don’t realize that single-frequency dielectric loss measurement — still the dominant acceptance test for oil-paper insulation in many specifications — was developed decades before FDS technology existed. The industry has continued using it partly by habit and partly because FDS equipment is more expensive and the test takes longer. But for moisture-sensitive insulation in critical applications, relying on single-frequency tan δ is accepting a known diagnostic blind spot.
For compliance context, insulation materials used in high-voltage applications are increasingly expected to meet ISO 9001:2015 Quality management systems at minimum, with documentation trails covering material traceability and test protocol validation. For materials destined for applications with environmental exposure risk, REACH Regulation (EC) No 1907/2006 compliance for any chemical processing aids used in paper treatment or oil formulation is a non-negotiable baseline in European supply chains.
Practical Guidance for Buyers #
If you are sourcing oil-paper insulation materials, transformer bushings, or laminated dielectric components from Chinese manufacturers, the single most important specification upgrade you can make is adding FDS sweep testing to your acceptance criteria. Specifically: require a dielectric loss spectrum from 10⁻⁴ Hz to 10³ Hz under controlled temperature conditions, with explicit criteria for loss peak presence, amplitude, and frequency position.
Do not accept tan δ at 50 Hz as the sole moisture qualification method. The research data is clear that this measurement is insensitive to radial partial moisture — the exact moisture distribution pattern that forms first during real service ingress through seal failures or end-cap corrosion.
For incoming inspection of bulk insulation paper stock, verify that moisture content is measured by Karl Fischer titration (not just weight loss), and that the supplier can provide moisture uniformity data across the paper roll or batch — not just an average value. Samples should be drawn from multiple locations. Insulation paper conditioned at 90°C, 100 Pa for 48 hours to achieve initial dry baseline is the experimental reference condition; ask suppliers whether their process conditioning matches this.
Seal integrity is the upstream control point. Most radial moisture ingress in bushings originates at seal failures — end caps, flange joints, and end-screen housing assemblies that are repeatedly opened during maintenance. Supplier documentation should include seal material qualification data and maintenance cycling test results.
At sinoraw.com, our team works directly with Guangzhou-based sourcing specialists who have audited insulation material manufacturers across South China — we can help you identify qualified suppliers with FDS testing capability and Karl Fischer moisture verification protocols before you issue an RFQ. For acceptance sampling protocol design, ISO 2859-1:1999 Sampling procedures for inspection by attributes provides the statistical framework for lot acceptance decisions on incoming insulation material batches.
Need help identifying qualified suppliers for oil-paper insulation or FDS-tested bushing materials? Talk to our sourcing team →
Supplier Qualification Questions #
- Can you provide full FDS sweep data (10⁻⁴ Hz to 10³ Hz) for your oil-paper insulation at moisture content levels of 0.53%, 1.08%, 2.01%, 3.09%, 4.11%, and 5.12%, and confirm that your test protocol matches the gradient conditioning procedure (90°C drying at 100 Pa for 48 hours followed by oil impregnation)?
- What is the maximum moisture content differential your product can sustain between adjacent insulation layers before an interfacial relaxation polarization loss peak becomes detectable in FDS measurement — and at what equivalent frequency does that peak first appear in your product’s dielectric spectrum?
- For radial partial moisture simulation at equivalent average moisture content of 3%, can you provide FDS curves showing the divergence between low-frequency and high-frequency segments, and confirm that the loss peak amplitude at the MC0+MC4 combination does not exceed the threshold defined in your batch release specification?
- How do you measure moisture uniformity across insulation paper batches — is moisture content verified by Karl Fischer titration at multiple sampling points, and what is your maximum allowable moisture variation within a single production lot?
- For the 110 kV bushing equivalent application, has your insulation system been validated using numerical simulation (or physical prototype testing) to confirm that FDS loss peak behavior under radial partial moisture conditions in the outermost insulation layer is consistent with the interfacial relaxation polarization model — specifically that loss peak frequency shifts higher with increasing moisture content differential?
Sourcing Checklist #
- ☐ Supplier provides FDS dielectric spectrum data covering the full frequency range from 10⁻⁴ Hz to 10³ Hz for incoming insulation material lots
- ☐ Moisture content verified by Karl Fischer titration at ≥3 sampling positions per batch, with individual readings traceable to the six reference levels: 0.53%, 1.08%, 2.01%, 3.09%, 4.11%, 5.12%
- ☐ FDS data for radial moisture configurations (both double-layer and triple-layer interfaces) shows no unexplained loss peak at equivalent moisture content ≤2% — confirming absence of severe localized moisture
- ☐ Insulation paper drying process documented as ≥48 hours at 90°C and ≤100 Pa before oil impregnation
- ☐ Supplier QC protocol distinguishes between axial and radial moisture distribution measurement, with separate acceptance criteria for each orientation
- ☐ Seal material qualification documentation available, including cycling test results demonstrating maintained integrity after repeated assembly/disassembly consistent with maintenance schedules
- ☐ Supplier holds ISO 9001:2015 certification with scope covering insulation material production and dielectric testing, with last audit within 18 months
- ☐ For materials used in European supply chains, REACH compliance documentation confirms no restricted substances in paper processing aids or transformer oil formulations
Key Specifications Table #
| Parameter | Recommended Value | Verification Method |
|---|---|---|
| Insulation paper initial moisture content (dry baseline) | ≤0.53% (MC0 reference) | Karl Fischer titration after 48 h drying at 90°C, 100 Pa |
| FDS loss peak frequency at radial partial moisture MC0+MC4 condition | Peak detectable; shifts to higher frequency as differential increases from MC1 to MC5 | FDS sweep 10⁻⁴ to 10³ Hz, plot tan δ vs. frequency, identify convex peak |
| Maximum moisture content in outermost insulation layer for service | ≤2.01% (MC2) under normal operating conditions | Karl Fischer titration on extracted paper sample |
| Moisture content differential between adjacent radial layers (critical threshold) | ΔMC ≤ 1 level (e.g., MC1–MC2) before loss peak becomes diagnostically significant | FDS measurement comparing high-frequency segment to uniform moisture reference curves |
| Insulation paper thickness (test specimen reference) | 1.04 mm per layer | Micrometer measurement per layer before lamination |
| Simulation model validation mesh density (110 kV bushing equivalent) | ≥3,689,108 domain elements and ≥388,432 boundary elements | COMSOL or equivalent FEM model documentation |
Can’t find a supplier meeting these specs? Submit your requirements and we’ll match you within 48 hours.
References #
Data source: Frequency Domain Spectroscopy-Based Diagnosis of Localized Moisture Ingress in Oil-Paper Insulated High-Voltage Transformer Bushings, H.-Y. Yu et al., IEEE Transactions on Dielectrics and Electrical Insulation, 2025
Frequently Asked Questions #
Why does radial partial moisture produce an FDS loss peak but axial partial moisture does not?
The difference comes down to circuit topology. Radial moisture creates a series interface between layers with different dielectric properties — in an AC field, charge accumulates at this interface and produces interfacial relaxation polarization, which shows up as a loss peak in the FDS curve. Axial moisture creates a parallel combination instead: the total dielectric loss is the sum of all layer contributions, so the high-moisture layer simply dominates and the curve shifts uniformly upward. No interface polarization peak forms.
Can I use standard 50 Hz tan δ measurement as a substitute for FDS sweep testing?
No. Single-frequency tan δ at 50 Hz or 60 Hz is structurally incapable of detecting the interfacial relaxation polarization loss peak that identifies radial partial moisture. The peak typically appears between 10⁻¹ and 10² Hz depending on moisture severity — the standard 50 Hz measurement point may fall on the peak, before it, or after it, with no way to distinguish local moisture from uniform moisture. FDS sweep across the full 10⁻⁴ to 10³ Hz range is the minimum requirement for reliable partial moisture diagnosis.
At what moisture content differential does the FDS loss peak become diagnostically reliable?
Based on the experimental data, at an equivalent average moisture content of 3%, combinations with moisture differentials of two or more levels — such as MC0+MC4 (0.53% vs. 4.11%) — produce clearly distinguishable loss peaks. Combinations with smaller differentials like MC1+MC3 (1.08% vs. 3.09%) also show peaks, but the amplitude is lower. At 1% equivalent moisture content, the peaks are smaller across all combinations but still present. The practical implication is that FDS is sensitive enough to detect partial moisture at early stages, before bulk moisture indicators show concern.
Does the intermediate layer moisture content matter in a three-layer radial configuration?
Relatively little. The research shows that in a three-layer radial interface sample, the FDS curve characteristics are primarily governed by the lowest and highest moisture values in the combination — the intermediate layer has minor influence on peak amplitude or frequency position. This simplifies diagnostic interpretation: focus on the extremes of the moisture distribution, not the mean.
How does this relate to insulation materials used outside transformer bushing applications?
The interfacial polarization phenomenon applies to any laminated dielectric structure where adjacent layers can develop non-uniform moisture content — capacitor insulation, cable terminations, and high-voltage instrument transformers all share this structural characteristic. Any oil-impregnated or polymer-laminated insulation where the base material has strong moisture affinity (cellulose, polyimide, some polyester films) and the impregnant has hydrophobic character will exhibit the same diagnostic behavior under FDS measurement. The specific frequency position and amplitude of the loss peak will vary with material properties, but the diagnostic principle transfers directly.
Published by sinoraw.com Technical Team | Request a sourcing quote


