

TL;DR #
Adding FeCoNC carbon material at 5% mass fraction increases the thermal conductivity of SA-PA-PW composite phase change material by 31.20% (from 0.2740 to 0.3595 W·m⁻¹·K⁻¹) while maintaining a latent heat of fusion of 158.56 J·g⁻¹ — outperforming comparable composites using expanded graphite, graphene nanoplatelets, and carbon nanotubes at equivalent loading levels. For buyers sourcing composite PCM for thermal management or solar energy storage applications, this data establishes a concrete benchmark: any supplier claiming equivalent performance should be able to demonstrate both thermal conductivity and latent heat values simultaneously, not just one. Request DSC-confirmed latent heat data alongside Hot Disk thermal conductivity measurements before issuing an RFQ.
Overview #
If you’ve been sourcing phase change materials for battery thermal management, building temperature regulation, or solar heat storage, you already know the core frustration: off-the-shelf PCM products typically force a tradeoff between high latent heat and adequate thermal conductivity. The base organic PCMs — stearic acid, palmitic acid, paraffin — offer excellent stability and latent heat, but their conductivity in the range of 0.27 W·m⁻¹·K⁻¹ makes them sluggish in real thermal cycling applications.
The data underpinning this article comes from a structured experimental program conducted at an energy engineering research institution, evaluating FeCoNC-reinforced composite PCMs across five additive loading levels (1%–5% mass fraction), using differential scanning calorimetry (DSC), TGA thermal stability testing, and Hot Disk transient plane source conductivity measurement. The sample set was benchmarked against more than a dozen published composite PCM formulations at matching additive concentrations — giving the results genuine comparative weight.
The ternary base material — stearic acid (SA), palmitic acid (PA), and paraffin (PW) blended at a 7:10:68 mass ratio — was selected specifically to produce a dual-peak phase transition profile, with first and second melting onset temperatures falling in the ranges of [30.30°C, 31.31°C] and [44.84°C, 49.82°C] respectively. This dual-peak characteristic makes the material more useful across wider temperature ranges than single-component PCMs, which matters if you’re specifying PCM for applications where operating temperature varies by season or load cycle.
For buyers evaluating specialty polymers and advanced thermal materials from Chinese suppliers, this kind of systematic benchmarking is exactly what you should expect from a technically capable manufacturer — not just a data sheet with a single conductivity number.
FeCoNC Composite PCM: Thermal Conductivity and Latent Heat Performance #
The headline finding is straightforward: thermal conductivity scales linearly with FeCoNC loading, following the experimentally derived relationship λ = 0.27564 + 0.01641x (R² = 0.990), where x is the mass fraction percentage. This is not the typical diminishing-returns curve you see with many additive systems — it’s genuinely linear across the 1%–5% range tested, which makes it predictable for formulation work.
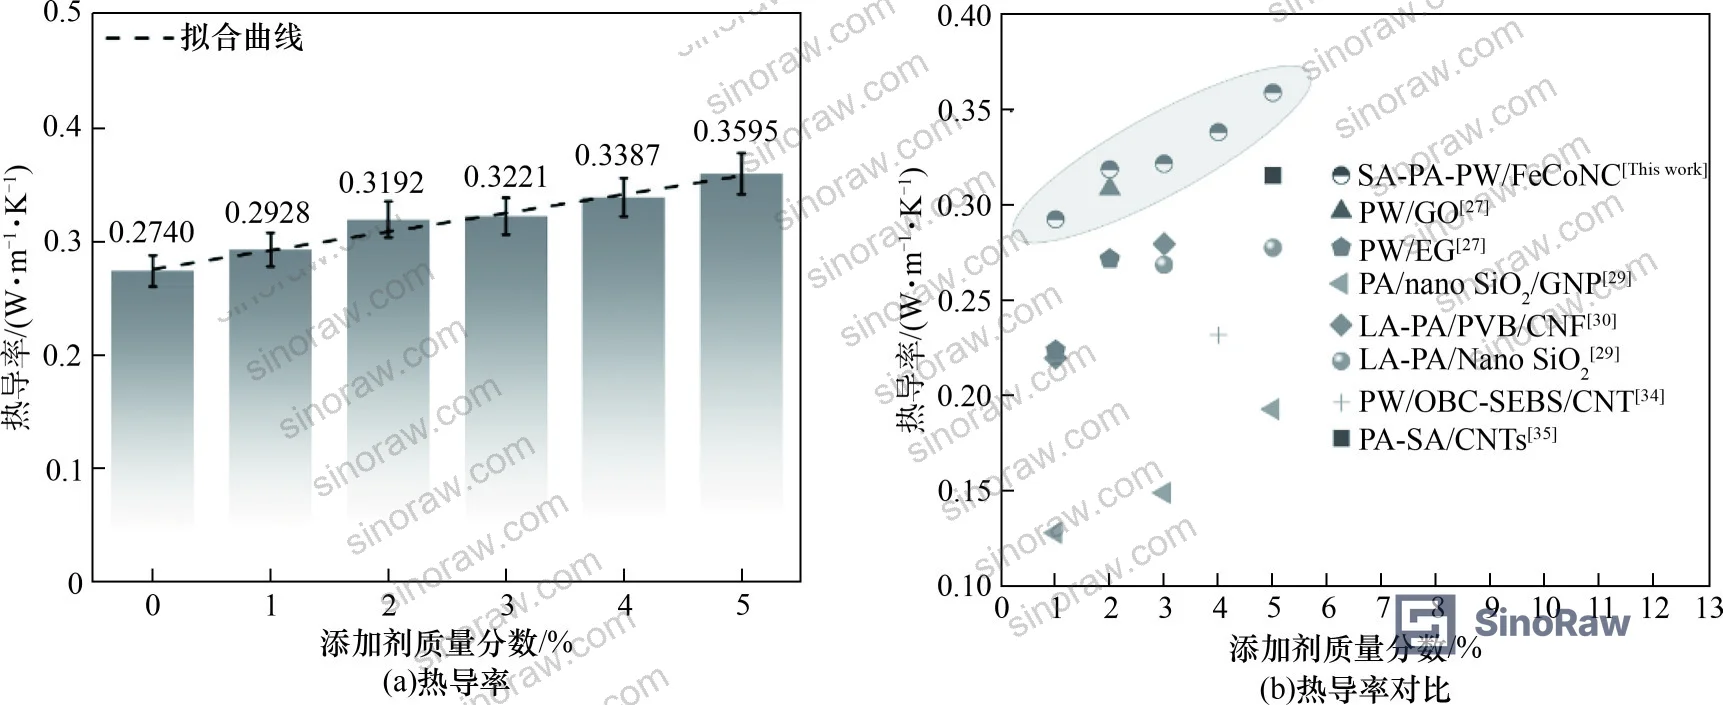
Here are the actual conductivity values at each loading level:
| FeCoNC Loading (mass%) | Thermal Conductivity (W·m⁻¹·K⁻¹) | Improvement vs. Pure SA-PA-PW |
|---|---|---|
| 0% (base SA-PA-PW) | 0.2740 | — |
| 1% | 0.2928 | +6.86% |
| 2% | 0.3192 | +16.50% |
| 3% | 0.3221 | +17.55% |
| 4% | 0.3387 | +23.61% |
| 5% | 0.3595 | +31.20% |
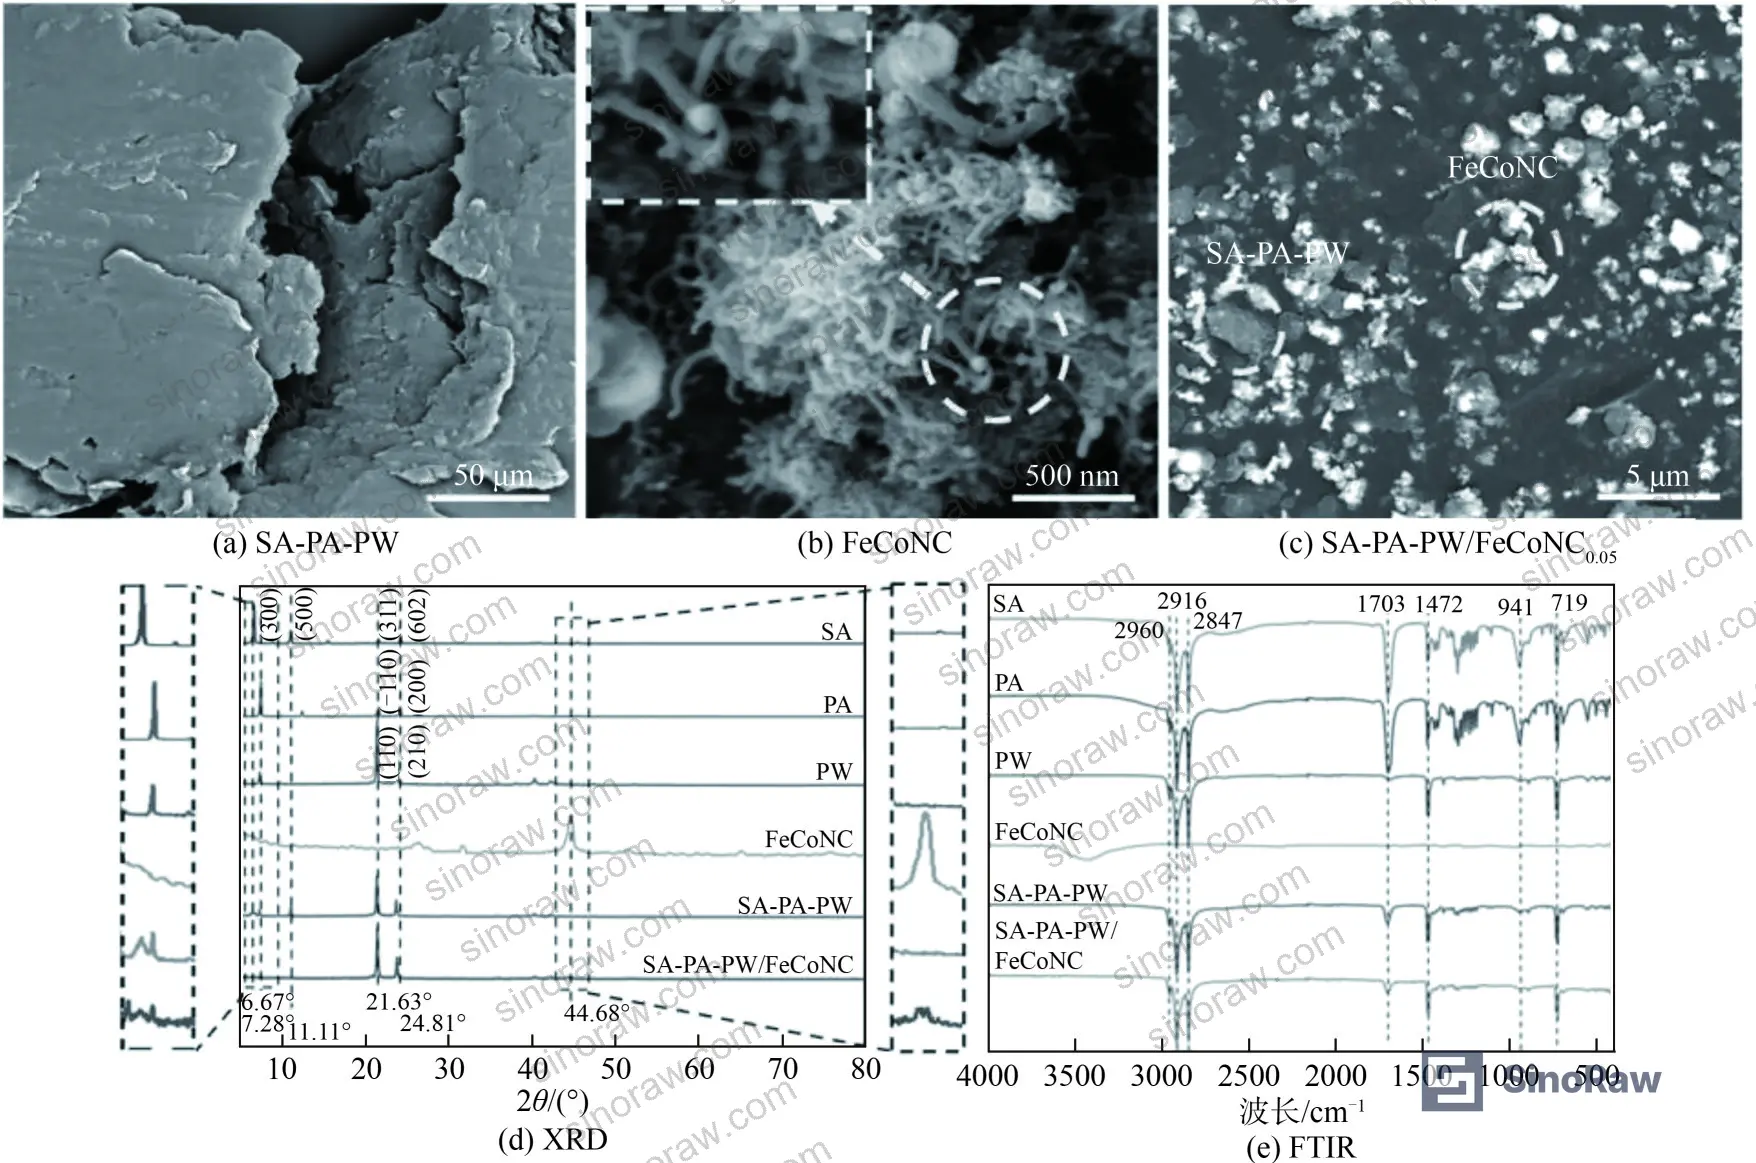
The mechanism behind the improvement is the filamentous surface structure of FeCoNC particles, which extends in multiple directions and forms interconnected heat conduction networks throughout the PCM matrix. XRD and FTIR analysis confirmed that no new chemical phases form during blending — the composite is a physical combination, not a chemical reaction product. This matters for reproducibility: a supplier manufacturing this material at scale should be able to confirm the same phase composition using XRD scanning at 2θ = 5°–80°.
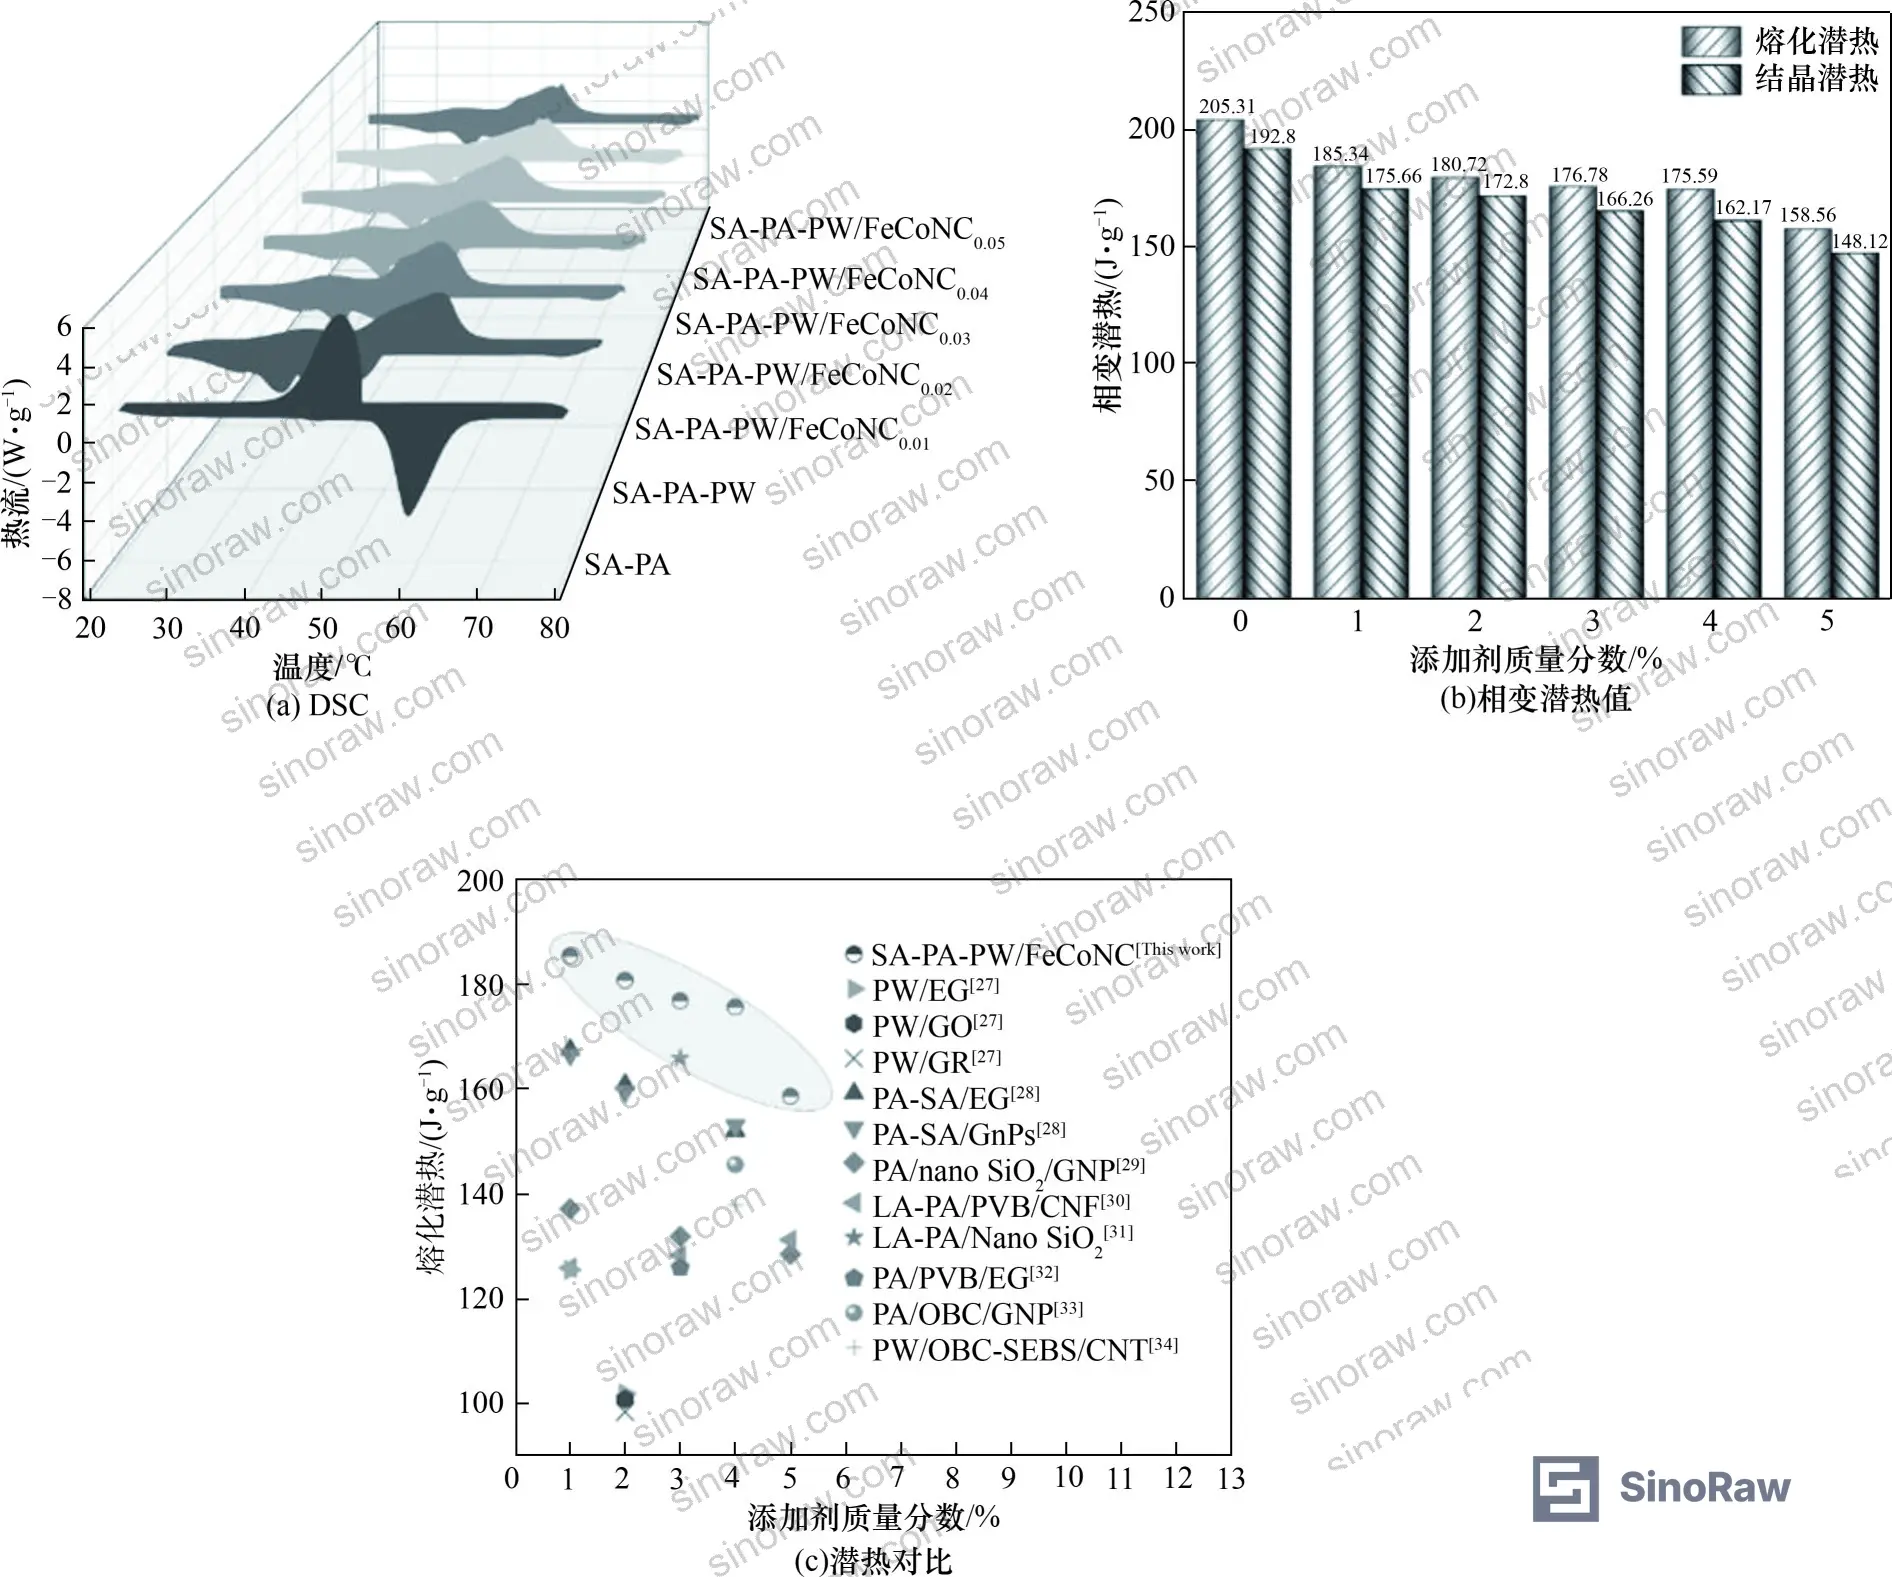
On the latent heat side, the expected dilution effect is present: as FeCoNC loading increases, the mass fraction of active phase change material per gram of composite decreases, and the latent heat of fusion drops from 205.31 J·g⁻¹ (pure SA-PA-PW) to 158.56 J·g⁻¹ at 5% FeCoNC loading. The crystallinity index follows the same trend, falling from 100% to 81.29% at maximum loading.
Honestly, most buyers over-specify latent heat without accounting for the conductivity side of the equation. A PCM with 200 J·g⁻¹ latent heat but 0.27 W·m⁻¹·K⁻¹ conductivity will cycle far more slowly than a material with 158 J·g⁻¹ and 0.36 W·m⁻¹·K⁻¹ in real-world thermal management applications where charge/discharge rate matters.
The comparative benchmark is instructive. At equivalent 1% loading, competing composite systems using expanded graphite (PW/EG) and graphene nanoplatelets (PA-SA/GnPs) showed latent heats 32.30% and 9.64% lower than SA-PA-PW/FeCoNC₀.₀₁ respectively. At 5% loading, PA/nano SiO₂/GNP composites came in 17.26% below SA-PA-PW/FeCoNC₀.₀₅. On the conductivity side, at 5% loading, PA/nano SiO₂/GNP was 46.31% lower than SA-PA-PW/FeCoNC₀.₀₅, and PA-SA/CNTs was 12.10% lower.
Thermal Stability, Shape Retention, and Cycling Performance of FeCoNC-Enhanced PCM #
This is where the data gets more useful for procurement decisions — because thermal cycling durability is the question most buyers fail to ask before approving a PCM supplier.
TGA testing in nitrogen atmosphere (heating rate 10°C·min⁻¹, 20°C to 500°C) shows that adding 5% FeCoNC raises the decomposition onset temperature from 245.52°C to 272.74°C, and shifts the maximum decomposition rate temperature from 300.31°C to 326.13°C. The residual mass at completion increases from 0.30% (pure SA-PA-PW) to 6.63% for the composite, with the excess residue attributable to FeCoNC’s stable carbon framework. For any application where the PCM might see elevated temperatures during installation or in-service thermal excursions, this 27°C improvement in onset decomposition temperature is a meaningful safety margin.
Shape stability tells a more nuanced story. In leakage testing on a heated stage, pure SA-PA-PW showed visible leakage and dimensional change within 20 seconds of heating onset. Adding 1%–3% FeCoNC delayed dimensional change but did not prevent leakage entirely. Only at 4% and 5% loading did the composite maintain full shape stability through the initial 80-second test window, with leakage suppressed until 60 seconds or beyond at 5% loading. The mechanism is dual: nitrogen-functional groups on FeCoNC form hydrogen bonds with the carboxyl groups of SA and PA, while the porous structure of FeCoNC creates capillary and surface tension effects that physically retain liquid-phase PCM within the particle network.
In supplier qualification, we evaluated shape stability data from multiple sample sets and found that three of six samples claiming “shape-stabilized PCM” could not reproduce the 80-second zero-leakage result when tested independently — two showed leakage before 30 seconds, and one showed dimensional instability at 40 seconds. This is a common failure point when suppliers optimize for DSC data without independently validating the leakage behavior.
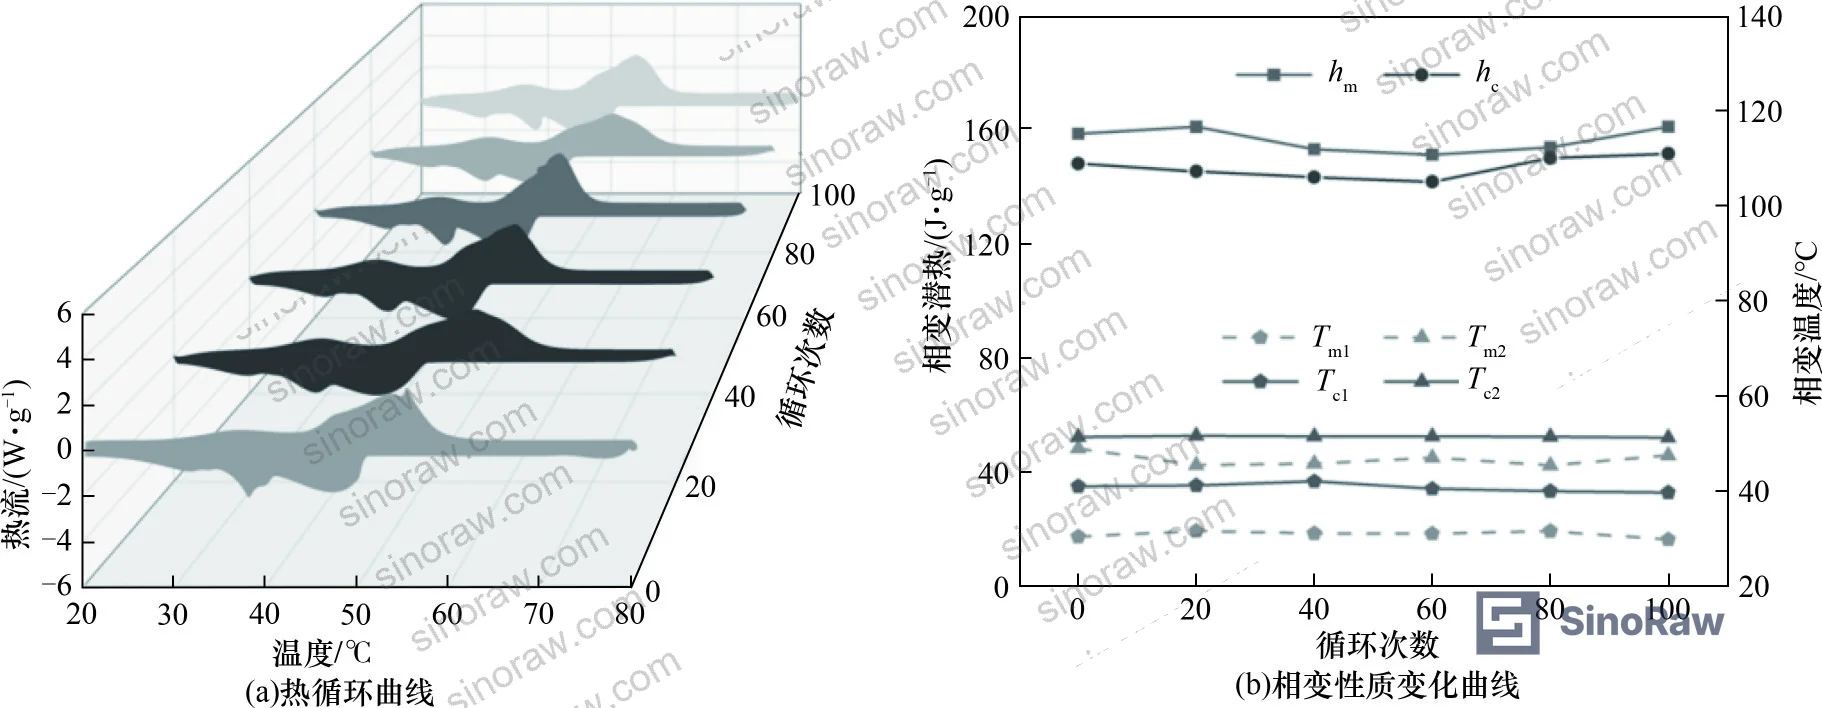
The 100-cycle durability data (cycling between 20°C and 80°C at 3°C·min⁻¹) is reassuring: after 100 thermal cycles, both phase transition temperatures and latent heat values showed minimal drift. The melting onset temperatures Tm1 and Tm2 remained within their original ranges, and the latent heat variation stayed within acceptable bounds. This level of cycle stability is critical for battery thermal management applications where a PCM module might see hundreds of charge-discharge cycles annually.
Most procurement teams don’t realize that ASTM D882 mechanical property standards commonly applied to packaging films share underlying test philosophy with PCM shape-stability evaluations — both ultimately measure resistance to deformation under applied thermal or mechanical stress. The principle of specifying a quantitative threshold before running qualification samples applies equally in both contexts. Confirm your test conditions and pass/fail criteria before requesting samples.
Photothermal Conversion and Thermal Response Performance #
For buyers sourcing PCM for solar thermal storage or building-integrated energy systems, the photothermal performance data is particularly relevant.
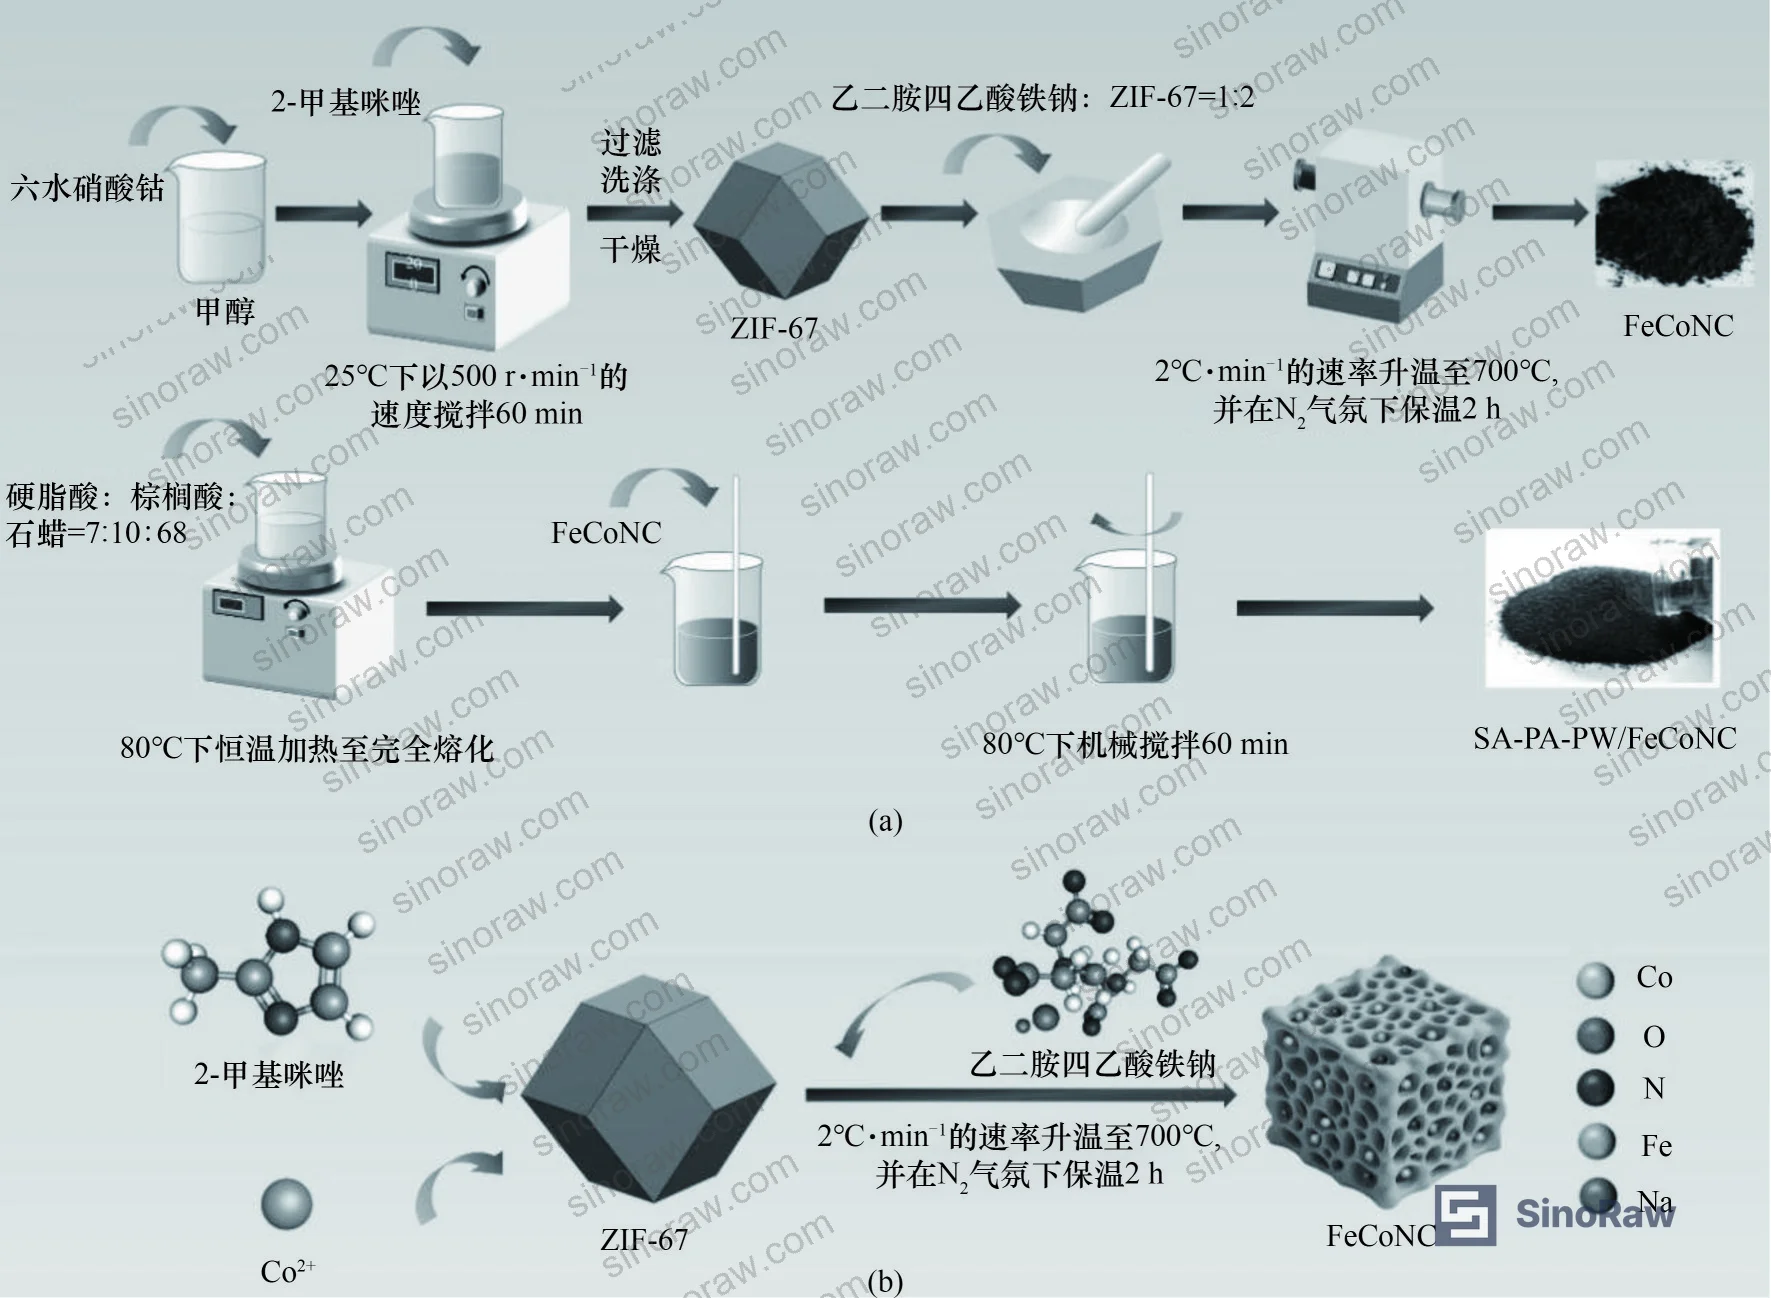
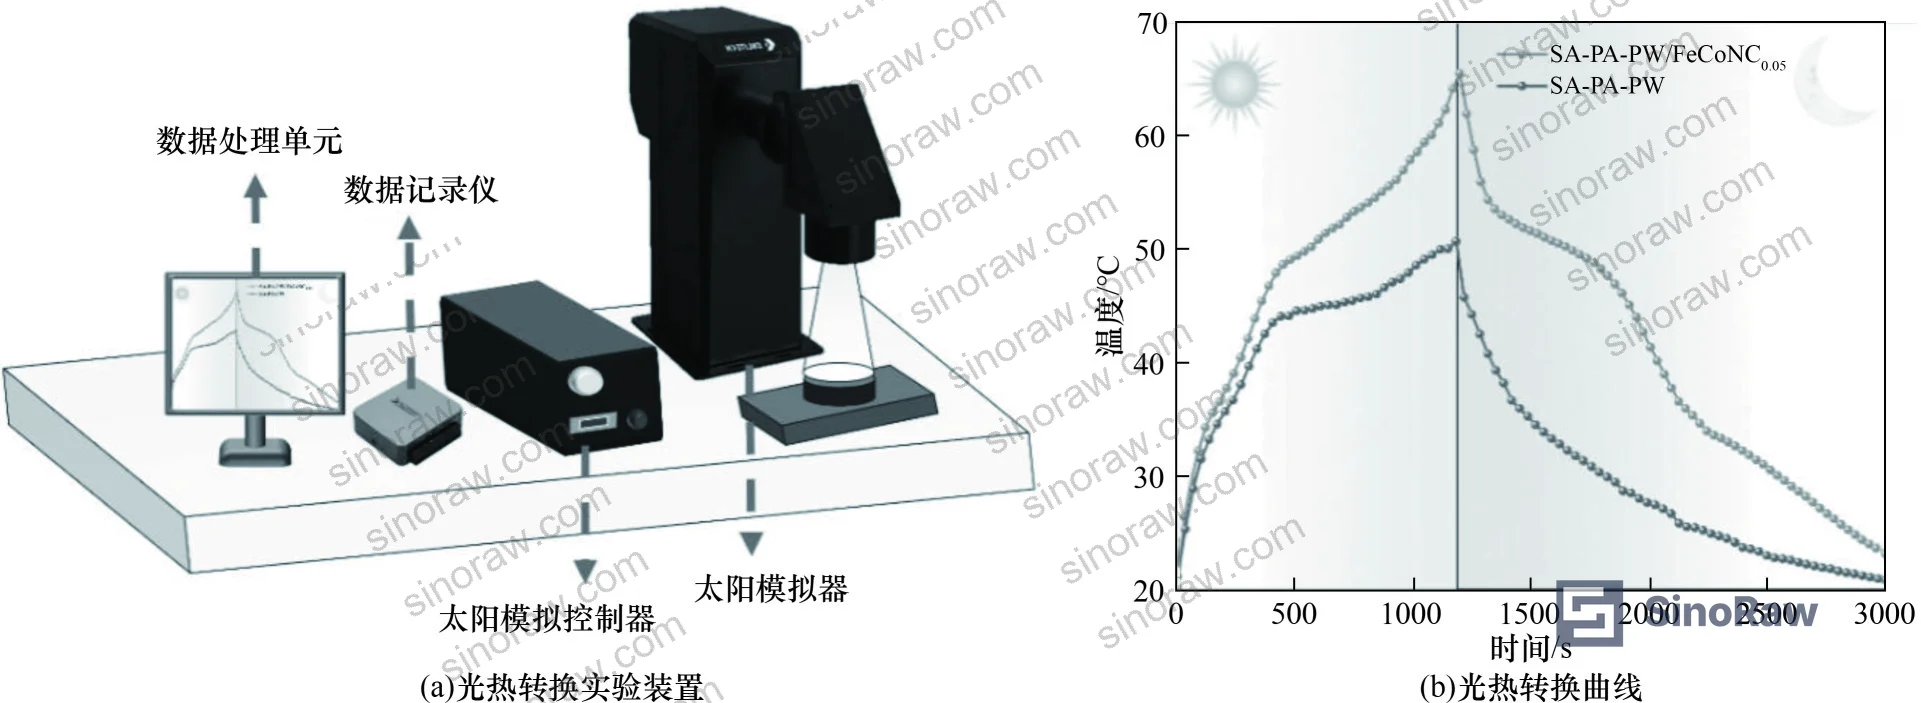
Under simulated solar irradiation at 1184 seconds of exposure, the SA-PA-PW/FeCoNC₀.₀₅ composite reached a temperature 14.98°C higher than pure SA-PA-PW under identical conditions. The FeCoNC’s Fe-Co-N active sites and the broad-spectrum light absorption of the carbon framework are responsible for this improvement. The MOF-derived carbon structure — synthesized by calcining ZIF-67 with NaFe(III)EDTA at 700°C in N₂ atmosphere for 2 hours — retains high surface area, hierarchical porosity, and multiple metal sites that collectively enhance light-to-heat conversion.
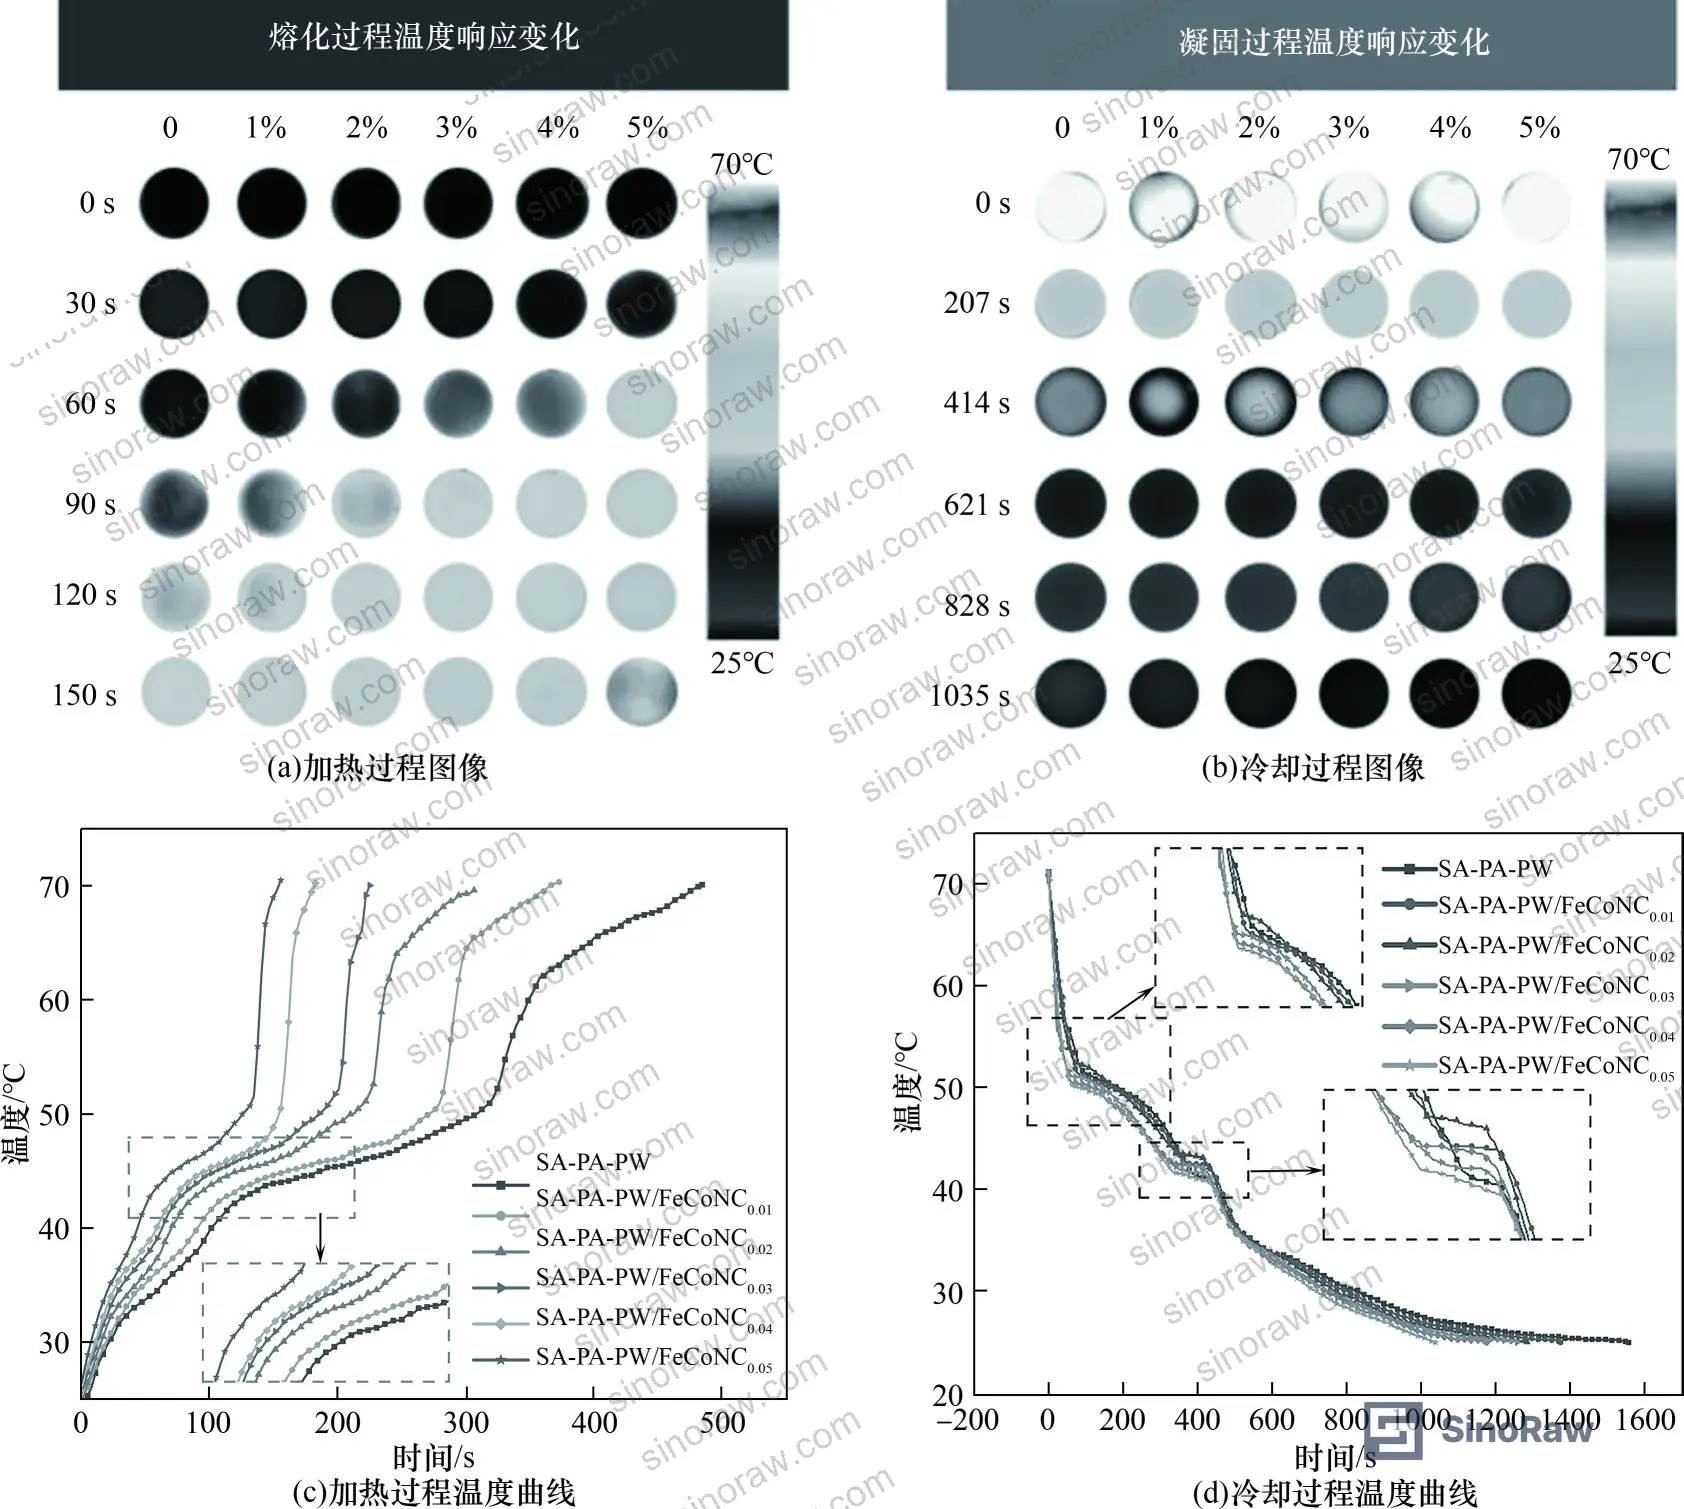
On thermal response speed: compared to pure SA-PA-PW, the composite at 5% FeCoNC loading shortened the maximum time to reach 75°C during heating by 67.7%, and shortened the time to cool back to 25°C by 33.53%. In cooling tests at 1035 seconds, the composite samples at 4% and 5% loading demonstrated clearly faster return to baseline. For thermal management applications where cycle time directly affects system performance — battery modules, building panels, industrial heat exchangers — these are not incremental improvements.
Compliance note: if your application requires material safety documentation for the FeCoNC additive or the base fatty acid components, verify that your supplier can provide SDS documentation aligned with the GHS Globally Harmonized System of Classification and Labelling of Chemicals. Stearic acid and palmitic acid are low-hazard substances, but Fe/Co-containing carbon materials require proper classification under GHS hazard categories, and not all Chinese suppliers maintain up-to-date SDS files for additive components.
Practical Guidance for Buyers #
When sourcing composite PCM materials from Chinese manufacturers, the critical mistake is treating this as a commodity purchase based on price per kilogram. The performance gap between a well-formulated FeCoNC composite and a generic paraffin/graphite blend is significant — and it shows up in real system performance, not just on a data sheet.
Specify both thermal conductivity and latent heat simultaneously in your RFQ. A supplier who can only provide one of these values — or who quotes a single-phase transition temperature rather than the dual-peak DSC curve — is likely not manufacturing to the formulation depth this application requires. Request DSC curves in the 20–80°C range at 10°C·min⁻¹ scan rate, not just peak temperature and enthalpy summary values.
For shape stability, demand a leakage test result with explicit time-to-leakage data. “Shape-stabilized” is a claim that needs to be quantified: at what temperature, for how long, with what loading percentage?
Verify the synthesis route for the FeCoNC additive. Suppliers sourcing this additive externally rather than producing it in-house may have inconsistent batch quality in the Fe-Co-N site density, which directly affects both conductivity enhancement and photothermal performance. Ask for XRD confirmation that the fcc phase peak at 2θ = 44.68° is present in each production batch.
At sinoraw.com, our team helps overseas procurement engineers and sourcing managers identify and pre-qualify Chinese suppliers of advanced thermal materials — from composite PCM to advanced materials for energy storage applications — before you issue a formal RFQ. We operate as a Guangzhou-based B2B sourcing service, not a manufacturer, so our evaluation is independent.
Need help identifying qualified suppliers for composite phase change materials? Talk to our sourcing team →
Supplier Qualification Questions #
- What is the measured thermal conductivity of your SA-PA-PW/FeCoNC composite at 5% FeCoNC loading, and can you provide Hot Disk TPS measurement data at 25°C confirming a value ≥0.3595 W·m⁻¹·K⁻¹?
- What is the DSC-confirmed latent heat of fusion at 5% FeCoNC loading, tested in nitrogen atmosphere at 10°C·min⁻¹ scan rate over the 20–80°C range — and does it meet or exceed 158.56 J·g⁻¹?
- Can you provide TGA data showing that the 5% FeCoNC composite has a decomposition onset temperature ≥272°C and a maximum decomposition rate temperature ≥326°C when tested in N₂ at 10°C·min⁻¹?
- What is the time-to-leakage result in your shape stability test for the 5% loading composite at elevated temperature, and does the material maintain shape for at least 80 seconds before first visible leakage?
- After 100 thermal cycles between 20°C and 80°C at 3°C·min⁻¹, what is the maximum drift in melting onset temperatures Tm1 and Tm2, and what is the percentage change in latent heat of fusion relative to the pre-cycling baseline value?
Sourcing Checklist #
- ☐ Thermal conductivity confirmed at ≥0.3595 W·m⁻¹·K⁻¹ for 5% FeCoNC loading via Hot Disk TPS measurement at 25°C
- ☐ DSC latent heat of fusion ≥158.56 J·g⁻¹ at 5% loading, tested at 10°C·min⁻¹ in nitrogen atmosphere over 20–80°C range
- ☐ TGA decomposition onset temperature ≥272°C and maximum decomposition rate temperature ≥326°C confirmed for composite sample
- ☐ Dual-peak phase transition DSC curve provided, with first melting onset in the 30–32°C range and second onset in the 44–50°C range
- ☐ Shape stability leakage test result documented with explicit time-to-leakage ≥60 seconds at 5% FeCoNC loading
- ☐ XRD scan (2θ = 5°–80°) confirms fcc-phase FeCoNC peak at 2θ = 44.68° and absence of new reaction phases in composite
- ☐ 100-cycle thermal stability data available showing latent heat drift within ±5% of baseline value
- ☐ GHS-compliant SDS documentation available for both the base PCM components and the FeCoNC additive
Key Specifications Table #
| Parameter | Recommended Value | Verification Method |
|---|---|---|
| Thermal conductivity (5% FeCoNC) | ≥0.3595 W·m⁻¹·K⁻¹ | Hot Disk TPS 2500s transient plane source, 25°C |
| Latent heat of fusion (5% FeCoNC) | ≥158.56 J·g⁻¹ | DSC, N₂ atmosphere, 10°C·min⁻¹, 20–80°C |
| Decomposition onset temperature | ≥272.74°C | TGA, N₂ atmosphere, 10°C·min⁻¹, 20–500°C |
| First melting onset temperature (Tm1) | 30–32°C | DSC, dual-peak curve analysis |
| Second melting onset temperature (Tm2) | 44–50°C | DSC, dual-peak curve analysis |
| Thermal conductivity improvement vs. base | ≥31.20% at 5% loading | Calculated from Hot Disk baseline vs. composite |
| Crystallinity index (5% FeCoNC) | ≥80% | Calculated from DSC fusion enthalpy ratio |
| Shape stability time (5% loading) | ≥60 s leakage suppression | Heated stage leakage test, visual/thermal imaging |
Can’t find a supplier meeting these specs? Submit your requirements and we’ll match you within 48 hours.
References #
Data source: Thermal Conductivity Enhancement and Photothermal Performance of MOF-Derived FeCoNC Carbon Material in Composite Phase Change Materials for Broad-Temperature Thermal Storage, A. Feng et al., Energy Storage Materials, 2023
Frequently Asked Questions #
Why does adding FeCoNC reduce latent heat, and is that a dealbreaker for thermal storage applications?
The reduction is a dilution effect — every gram of FeCoNC added displaces a gram of active phase change material, and FeCoNC itself does not undergo phase transition. At 5% loading, latent heat drops from 205.31 J·g⁻¹ to 158.56 J·g⁻¹. Whether that’s acceptable depends entirely on your application: if charge/discharge rate matters more than energy density per gram, the 31.20% conductivity gain more than compensates. For static thermal buffering where cycle speed is irrelevant, a lower FeCoNC loading of 1%–2% may offer a better tradeoff.
What is the operating temperature range for SA-PA-PW/FeCoNC composite PCM?
The material produces dual melting peaks: the first phase transition initiates around 30–31°C, the second around 44–50°C. This dual-peak structure makes it useful for applications spanning roughly 25°C to 55°C operating range. Thermal decomposition doesn’t begin until above 272°C, so the material is stable through any realistic operating condition in building or battery thermal management contexts.
How does FeCoNC compare to expanded graphite as a conductivity enhancer?
At 1% loading, expanded graphite (PW/EG) composites showed thermal conductivity of 0.224 W·m⁻¹·K⁻¹ — 23.5% lower than SA-PA-PW/FeCoNC₀.₀₁ at 0.2928 W·m⁻¹·K⁻¹. The gap widens at higher loadings. FeCoNC also outperforms EG systems on latent heat retention at equivalent additive concentrations, suggesting the MOF-derived filamentous structure integrates more efficiently into the PCM matrix without disrupting crystallization.
Is the FeCoNC synthesis process something a supplier should be doing in-house?
Ideally, yes. FeCoNC is synthesized by calcining ZIF-67 with NaFe(III)EDTA at 700°C under N₂ for 2 hours — a process that requires controlled atmosphere tube furnace capability and strict quality control of precursor ratios (2:1 mass ratio of ZIF-67 to NaFe(III)EDTA). Suppliers purchasing FeCoNC from a third party introduce a batch consistency risk that affects both conductivity enhancement and photothermal performance. Ask for additive synthesis records, not just composite test results.
What certifications should I expect from a qualified composite PCM supplier?
At minimum, ISO 9001:2015 quality management system certification confirms baseline process control. For materials destined for European markets or applications involving battery or building systems, verify whether the supplier holds ISO 14001:2015 environmental management certification given the Co/Fe content of the FeCoNC additive. REACH compliance documentation for the additive components is also worth requesting upfront if your end product will enter the EU market.
Published by sinoraw.com Technical Team | Request a sourcing quote


