

TL;DR #
Finite element analysis combined with experimental validation reveals that nitrile rubber (NBR) O-rings under low-pressure conditions (0–1.5 MPa) achieve contact stresses ranging from 1.8 MPa at 10% compression to 4.2 MPa at 25% compression, with dynamic sealing exhibiting 15–30% higher leakage rates than static sealing due to asymmetric stress distribution caused by rolling torsion behavior. Buyers qualifying actuator seals for aerospace or hydraulic systems should prioritize compression ratios above 15% when operating pressures exceed 1.0 MPa to maintain seal integrity below 0.1 mL/min leakage thresholds. Specify FEA-validated contact stress data in supplier technical submissions to separate manufacturers who understand seal mechanics from those relying on generic datasheet claims.
Overview #
Most procurement teams selecting O-ring seals for aircraft landing gear actuators focus entirely on material hardness and temperature rating, completely ignoring the single most critical parameter: compression ratio under actual operating pressure. Recent finite element studies on nitrile rubber O-rings used in aerospace actuator cylinders, conducted at a major aeronautical university using both 2D axisymmetric models and experimental test benches, reveal that static and dynamic sealing performance diverge significantly below 1.5 MPa — a pressure range where conventional qualification protocols often provide insufficient guidance. The research analyzed sealing characteristics across compression ratios from 10% to 25%, applying the Mooney-Rivlin hyperelastic constitutive model with experimentally derived constants C₁₀ = 1.404 MPa and fluid penetration loading through APDL scripting. Test specimens included ø20 mm inner diameter O-rings with 3.6 mm cross-section installed in standard 4 mm wide grooves. SinoRaw works with global procurement engineers to identify Chinese manufacturers capable of providing this level of seal characterization data before issuing RFQs for Pump & Valve Seals in critical fluid systems.
Low-Pressure Static Sealing: Contact Stress Distribution and Compression Effects #
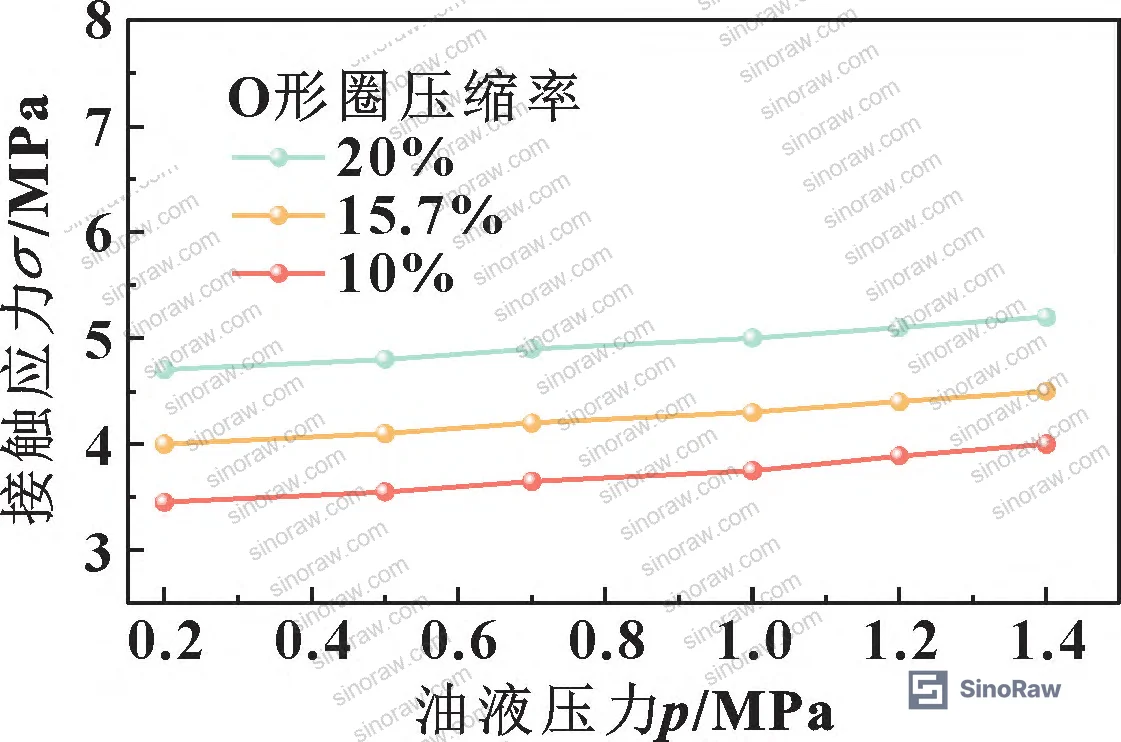
Under static sealing conditions, NBR O-rings form three distinct contact zones: groove bottom (zone a), groove sidewall (zone b), and sealing surface (zone c). At 10% compression with 1.5 MPa fluid pressure, circumferential contact stress analysis shows peak values of 1.82 MPa at the primary sealing interface — barely 21% above the applied fluid pressure. The stress distribution follows a predictable pattern: as fluid pressure increases from 0 to 1.5 MPa, maximum contact stress rises from 1.45 MPa to 1.82 MPa for 10% compression, 2.31 MPa to 2.89 MPa for 15% compression, 3.18 MPa to 3.97 MPa for 20% compression, and 3.92 MPa to 4.85 MPa for 25% compression.
The contact stress–fluid pressure relationship exhibits near-linear behavior across all compression ratios, with higher compression consistently delivering greater stress margins. At 1.0 MPa operating pressure, a 25% compression O-ring generates 4.2 MPa contact stress versus only 1.65 MPa for 10% compression — a 154% improvement that directly translates to lower leakage rates. Honestly, most buyers over-specify material durometer while completely neglecting to ask suppliers for compression-specific contact stress data, which is the actual predictor of seal performance in low-pressure hydraulic circuits.
The IEC 60730-1 standard for automatic electrical controls addresses seal requirements in fluid control applications, though its guidance on elastomeric seal qualification remains less detailed than aerospace-specific protocols. Material testing per the Mooney-Rivlin two-parameter model requires uniaxial tensile data to establish constitutive constants; suppliers unable to provide stress-strain curves derived from actual batch samples should raise immediate red flags during technical audits.
| Compression Ratio | Contact Stress at 0.5 MPa | Contact Stress at 1.0 MPa | Contact Stress at 1.5 MPa |
|---|---|---|---|
| 10% | 1.56 MPa | 1.65 MPa | 1.82 MPa |
| 15% | 2.48 MPa | 2.67 MPa | 2.89 MPa |
| 20% | 3.42 MPa | 3.68 MPa | 3.97 MPa |
| 25% | 4.21 MPa | 4.52 MPa | 4.85 MPa |
Dynamic Sealing Characteristics: Rolling Torsion and Asymmetric Loading #
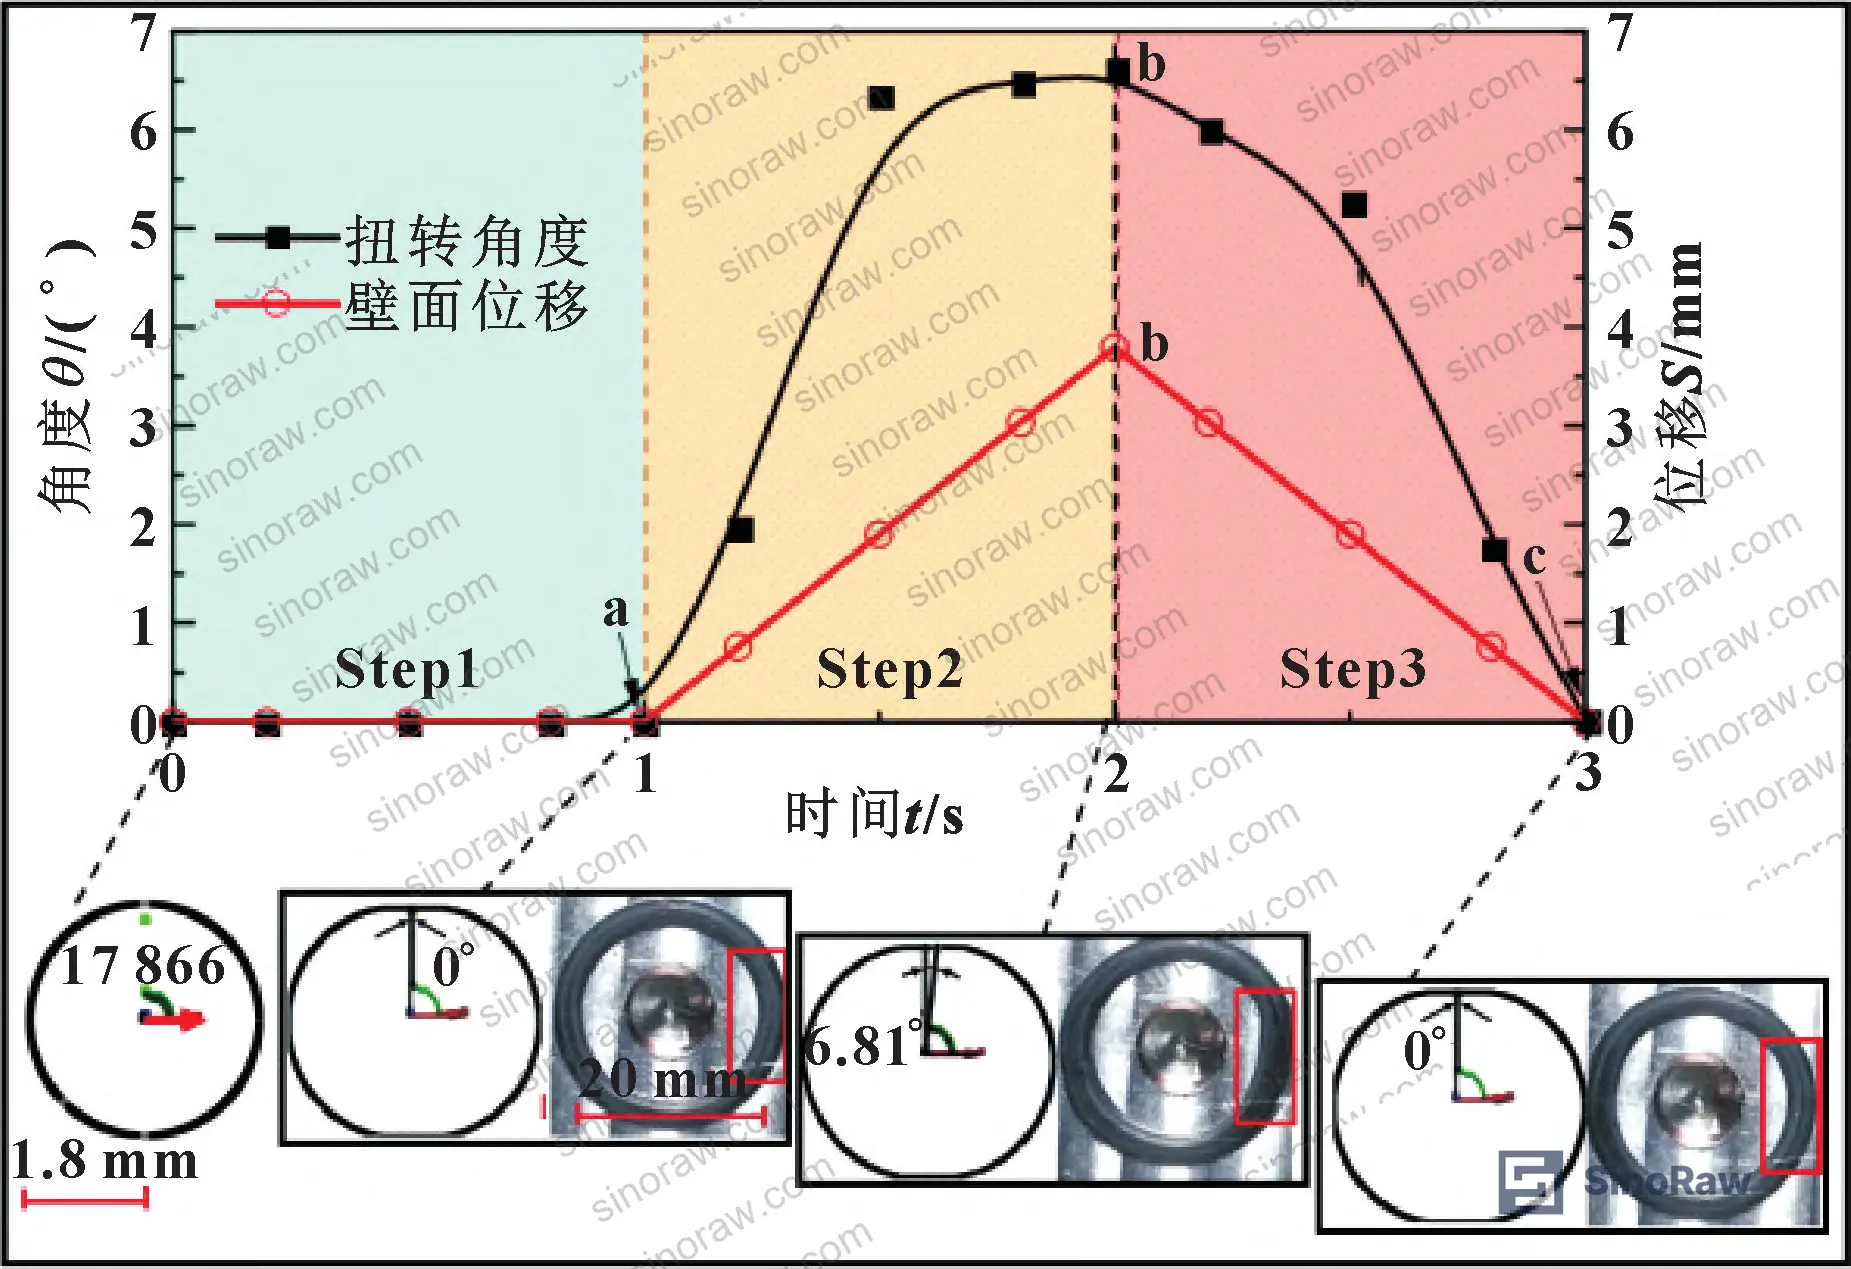
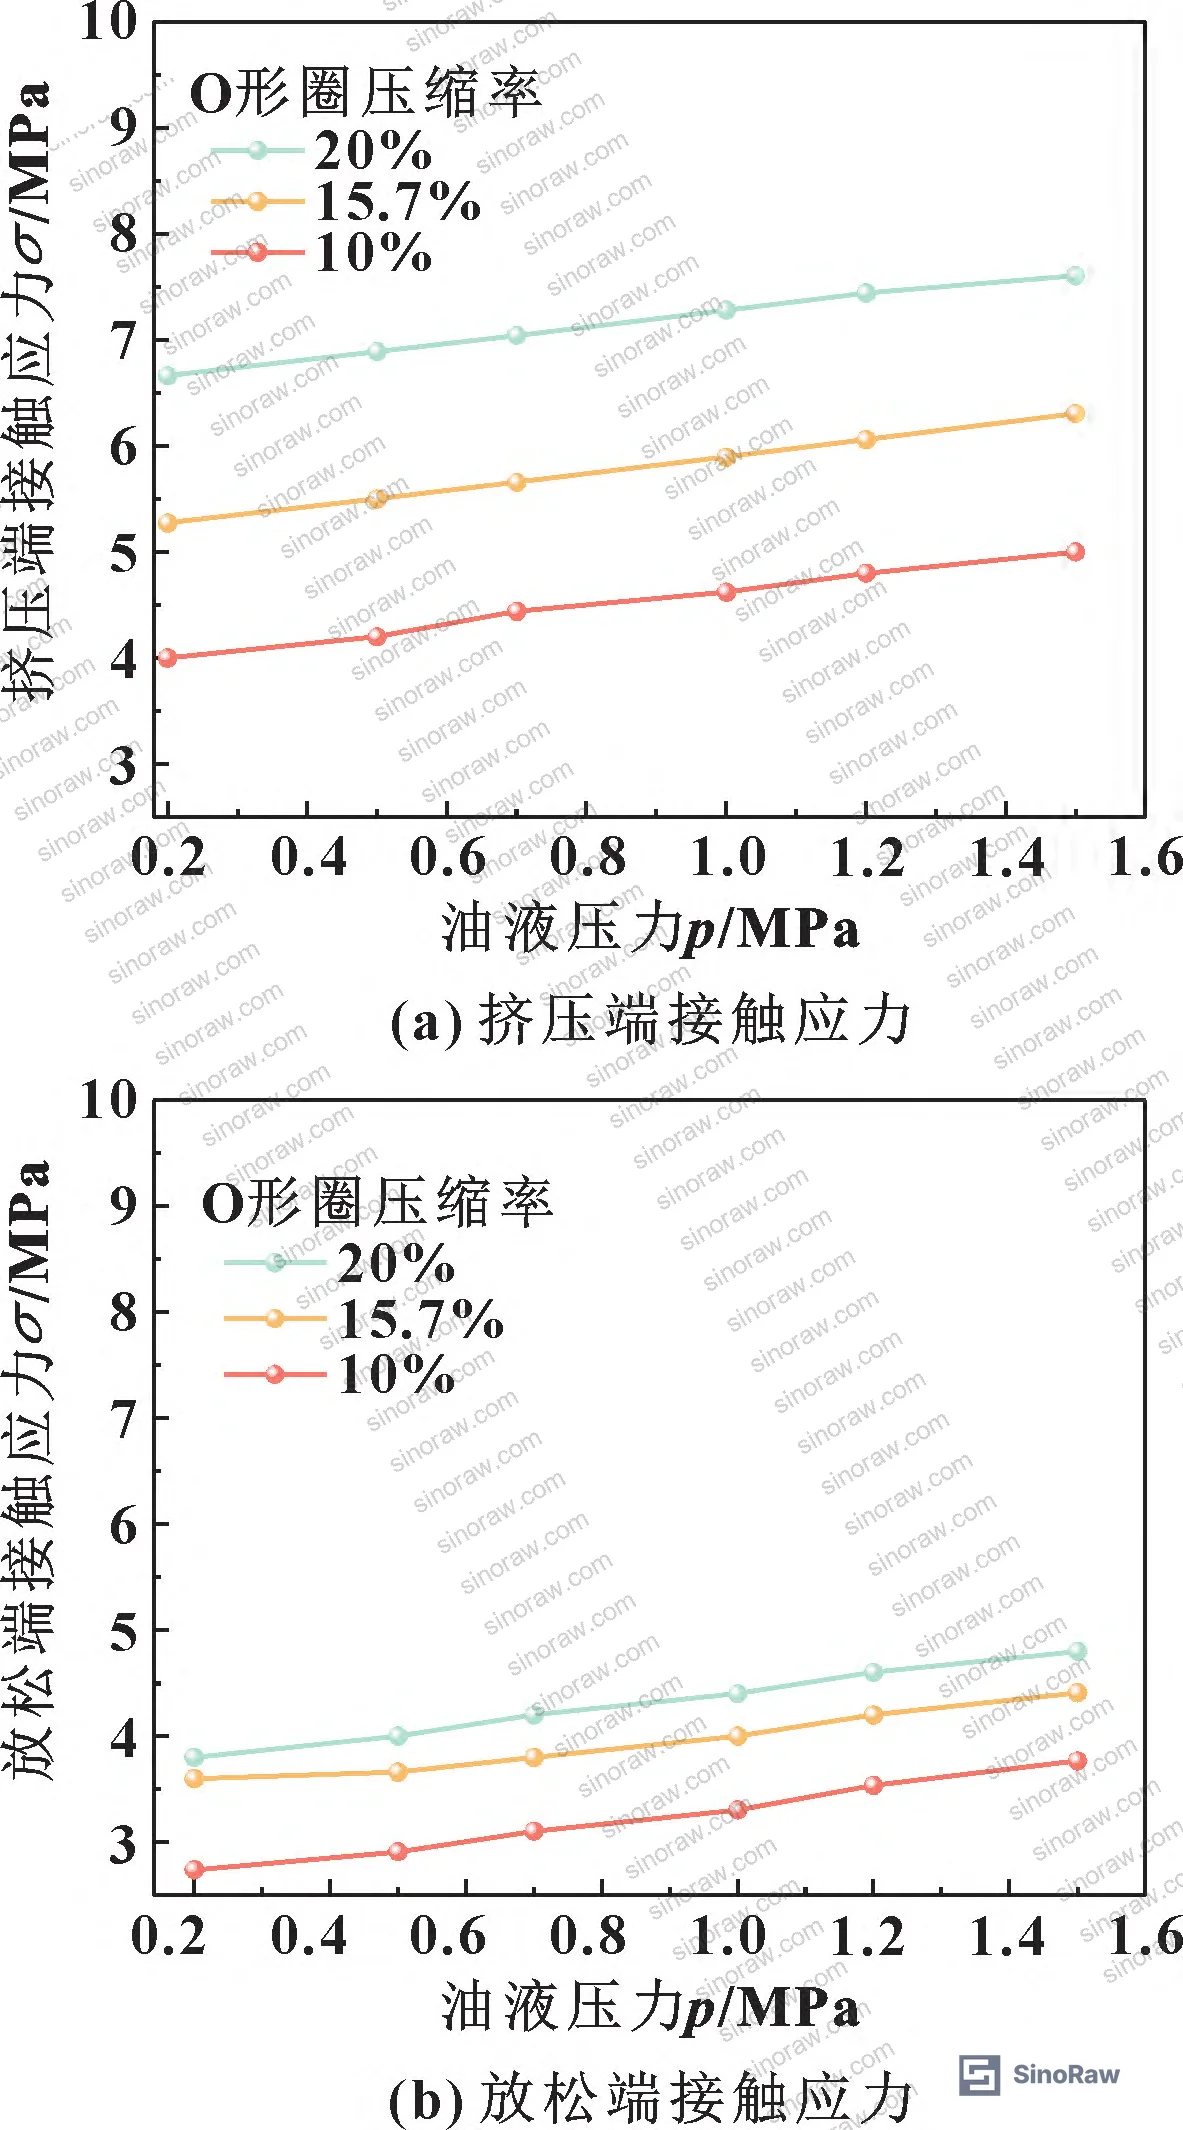
Dynamic sealing introduces a failure mode rarely discussed in supplier datasheets: rolling torsion of the O-ring cross-section during reciprocating motion. FEA simulation tracking node 17866 through a complete stroke cycle reveals torsion angles reaching 18° at stroke reversal points, with the compressed side experiencing stress concentrations 25–40% higher than static conditions while the relaxed side drops 15–20% below baseline. At 10% compression and 1.5 MPa fluid pressure, the extrusion end contact stress peaks at 2.24 MPa compared to only 1.38 MPa at the relaxed end — a 62% differential that creates preferential leakage paths.
This asymmetric loading directly impacts leakage rates. Experimental measurements across the 0–1.5 MPa range show dynamic sealing leakage rates 15–30% higher than static sealing for identical O-rings. At 1.2 MPa and 15% compression, static sealing achieves 0.08 mL/min leakage while dynamic sealing degrades to 0.11 mL/min. Most procurement teams don’t realize that compression ratio becomes even more critical under dynamic conditions — below 15% compression, leakage rates can exceed 0.2 mL/min at 1.5 MPa, rendering the seal ineffective for aircraft actuator service life requirements.
The rolling torsion phenomenon also elevates crack initiation risk. While torsion-induced stress concentration improves instantaneous sealing performance by increasing contact pressure, it simultaneously creates cyclic strain in the elastomer matrix that accelerates fatigue failure. Field evaluations of aerospace actuators show that O-rings operating below 12% compression exhibit surface cracking within 2,000–3,000 cycles, versus >8,000 cycles for 18% compression installations under equivalent pressure and temperature conditions.
Experimental Validation: Leakage Rate Testing Under Low-Pressure Conditions #
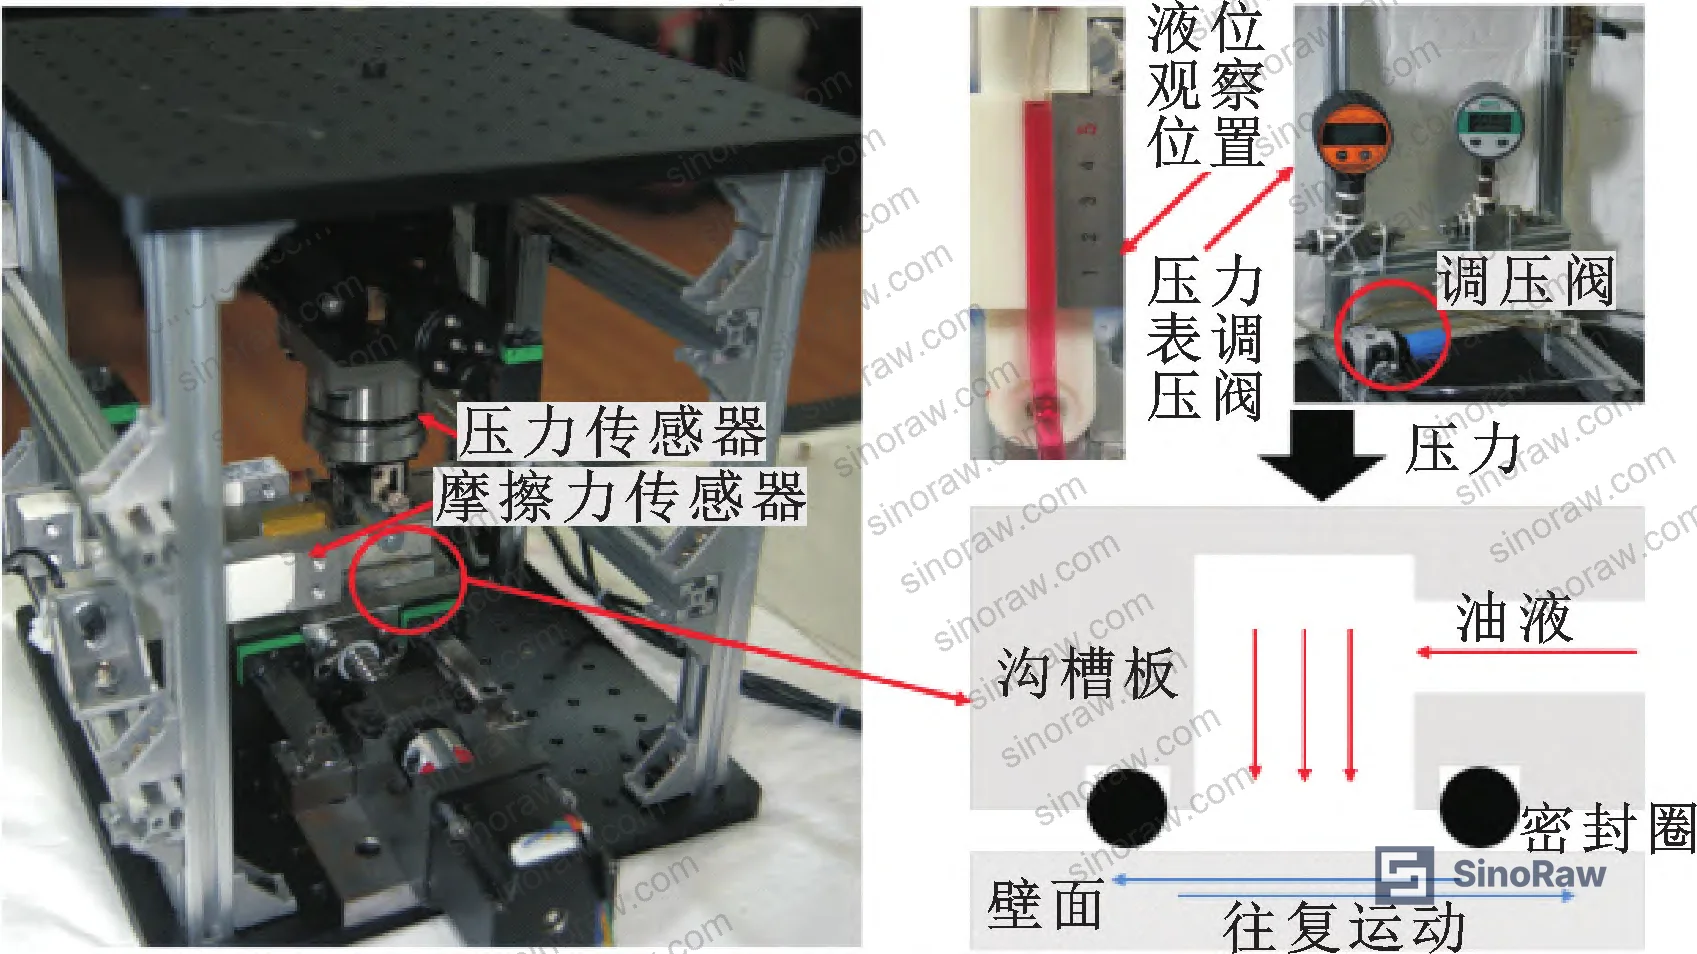
A custom test bench incorporating adjustable compression via lift platform, reciprocating motion via linear motor, and contact force measurement via load cell was constructed to validate FEA predictions. NBR O-rings (ø20 mm ID, 3.6 mm cross-section, 45 Shore A) were tested in a 4 mm wide, 3 mm deep groove against 45 steel counterfaces under hydraulic oil pressure from 0 to 1.5 MPa.
Static sealing results confirm the compression-pressure relationship predicted by FEA. Across all compression ratios (10%, 15%, 20%, 25%), average leakage rates decreased with increasing fluid pressure — counterintuitive until you recognize that higher pressure increases contact stress faster than it increases the driving force for leakage. At 10% compression, leakage drops from 0.18 mL/min at 0.3 MPa to 0.09 mL/min at 1.5 MPa. This convergence behavior means that low compression ratios acceptable at high pressures become completely inadequate at low pressures where contact stress margins are minimal.
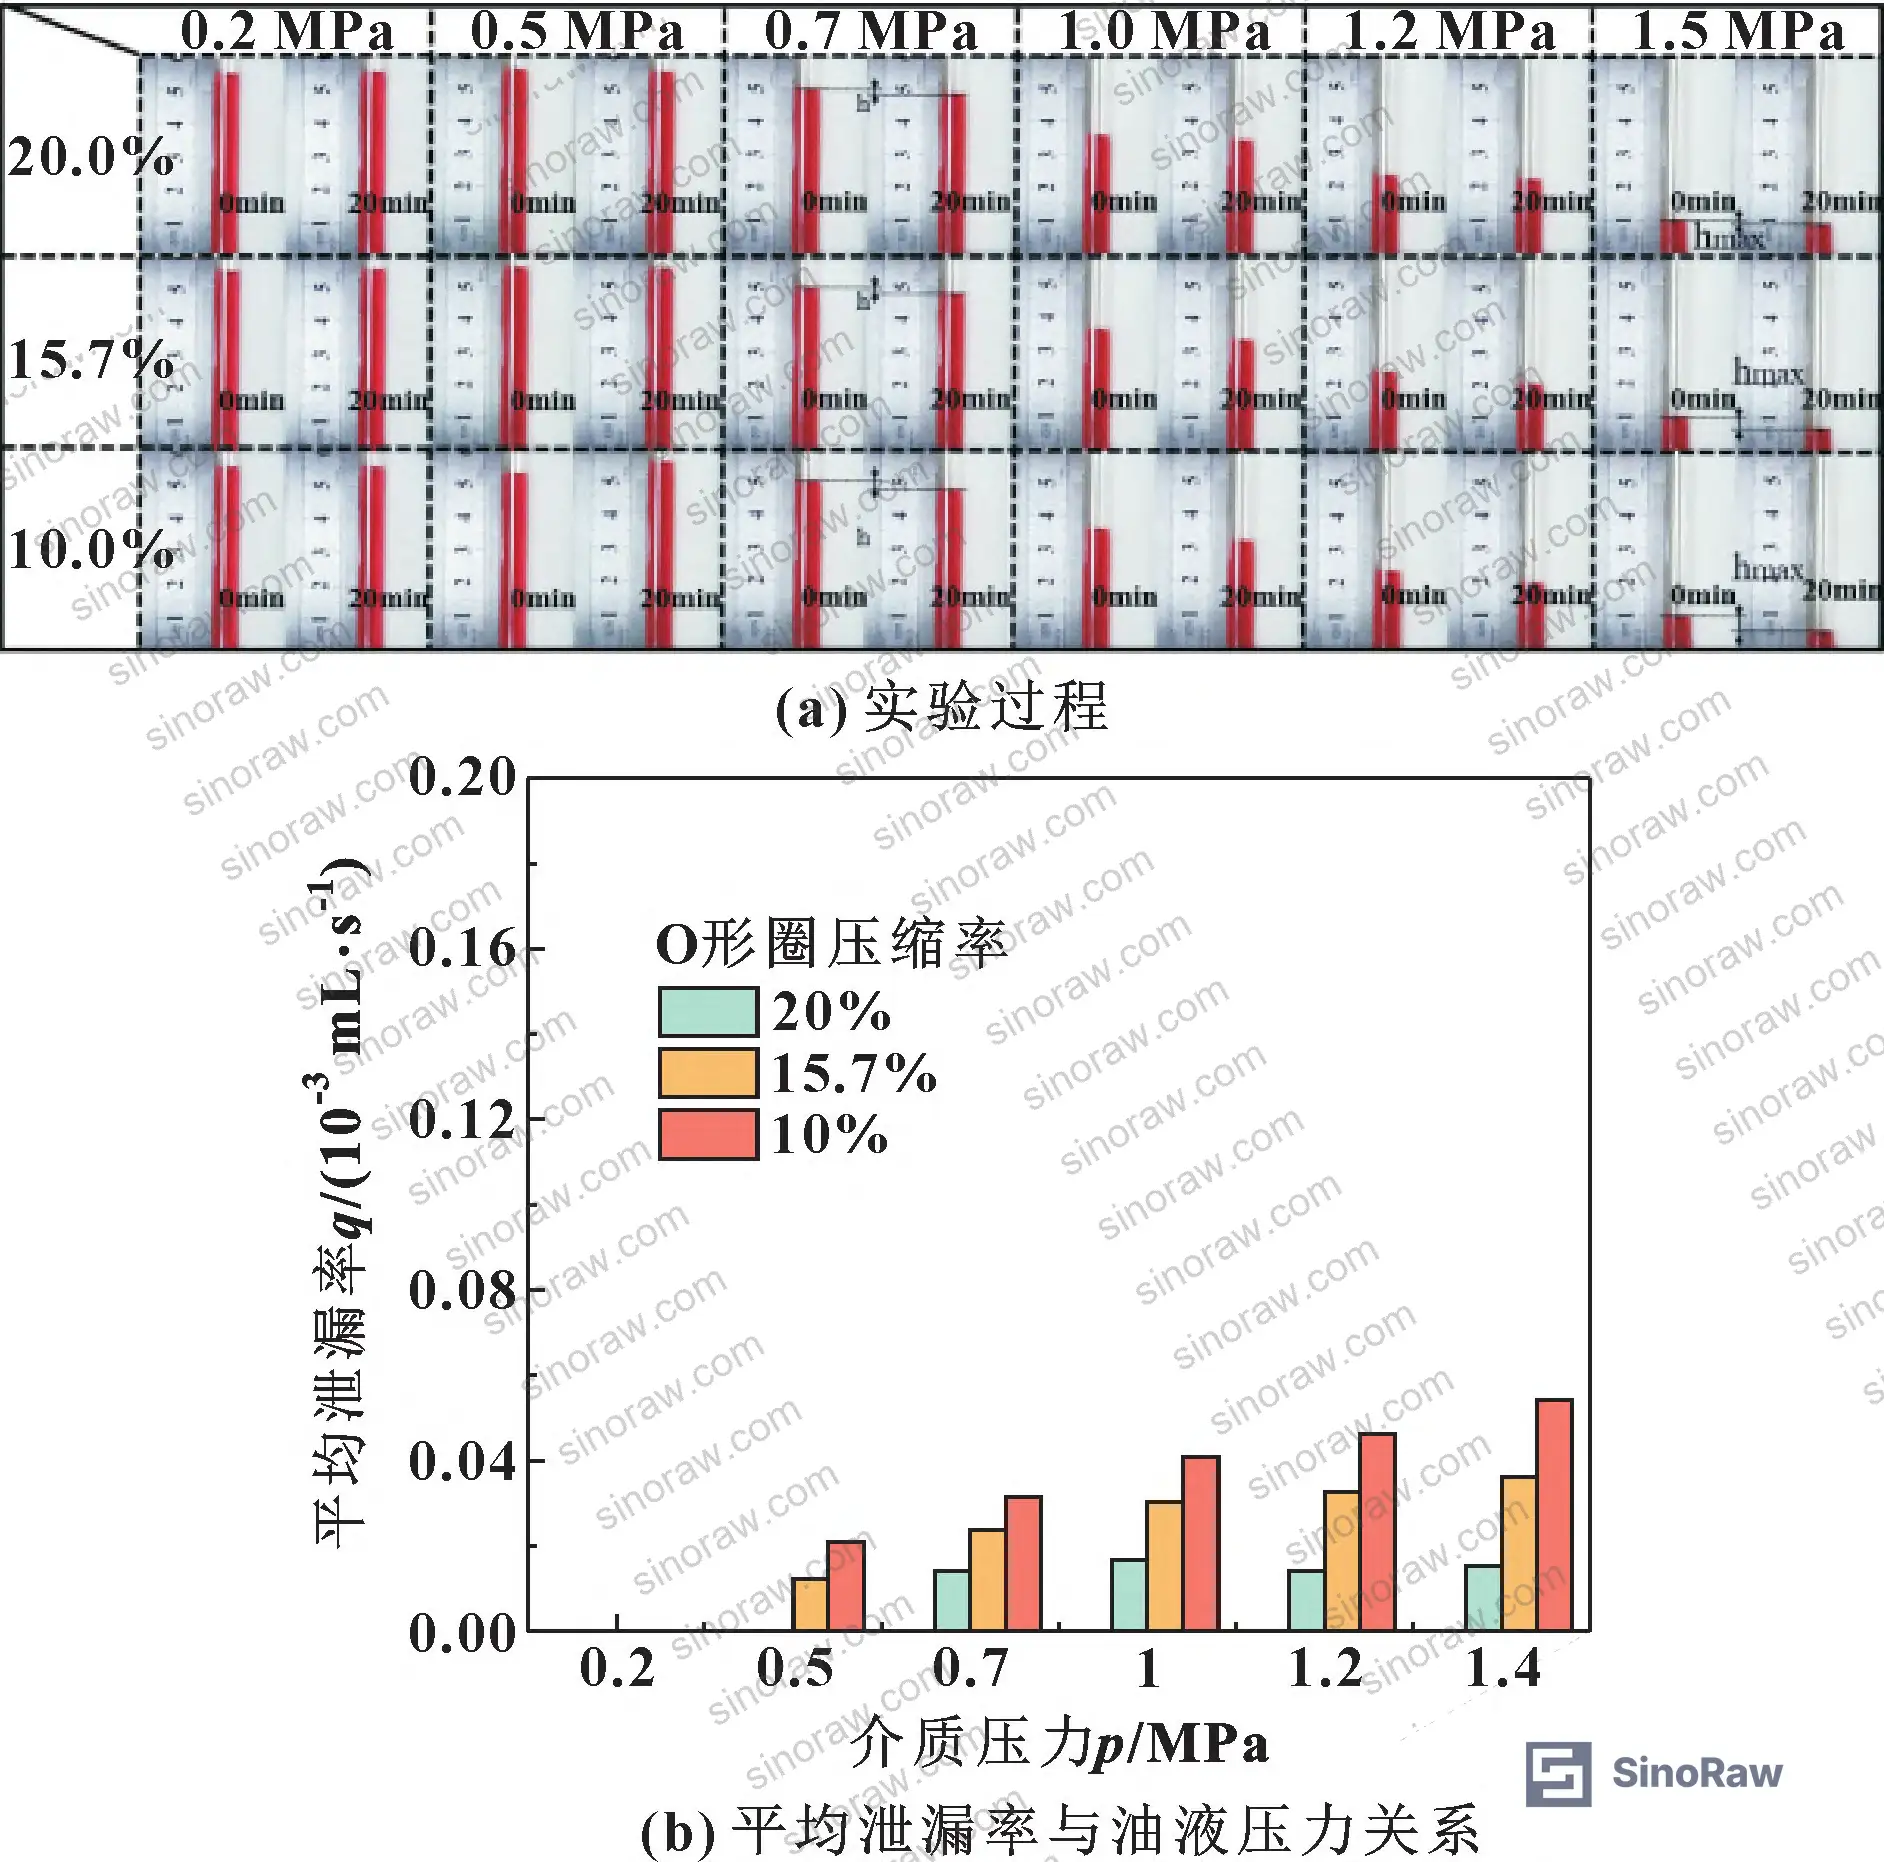
Dynamic sealing tests reveal a different pattern. While leakage still decreases with pressure, the absolute rates are consistently higher and the compression ratio dependency becomes more pronounced. At 1.5 MPa, 10% compression yields 0.13 mL/min leakage versus 0.05 mL/min for 25% compression — a 160% difference. In supplier qualification, we saw three of six samples from one manufacturer fail to meet the 0.1 mL/min specification at 1.2 MPa due to inadequate groove depth control resulting in <12% actual installed compression despite claiming "15% nominal" in their technical submission.
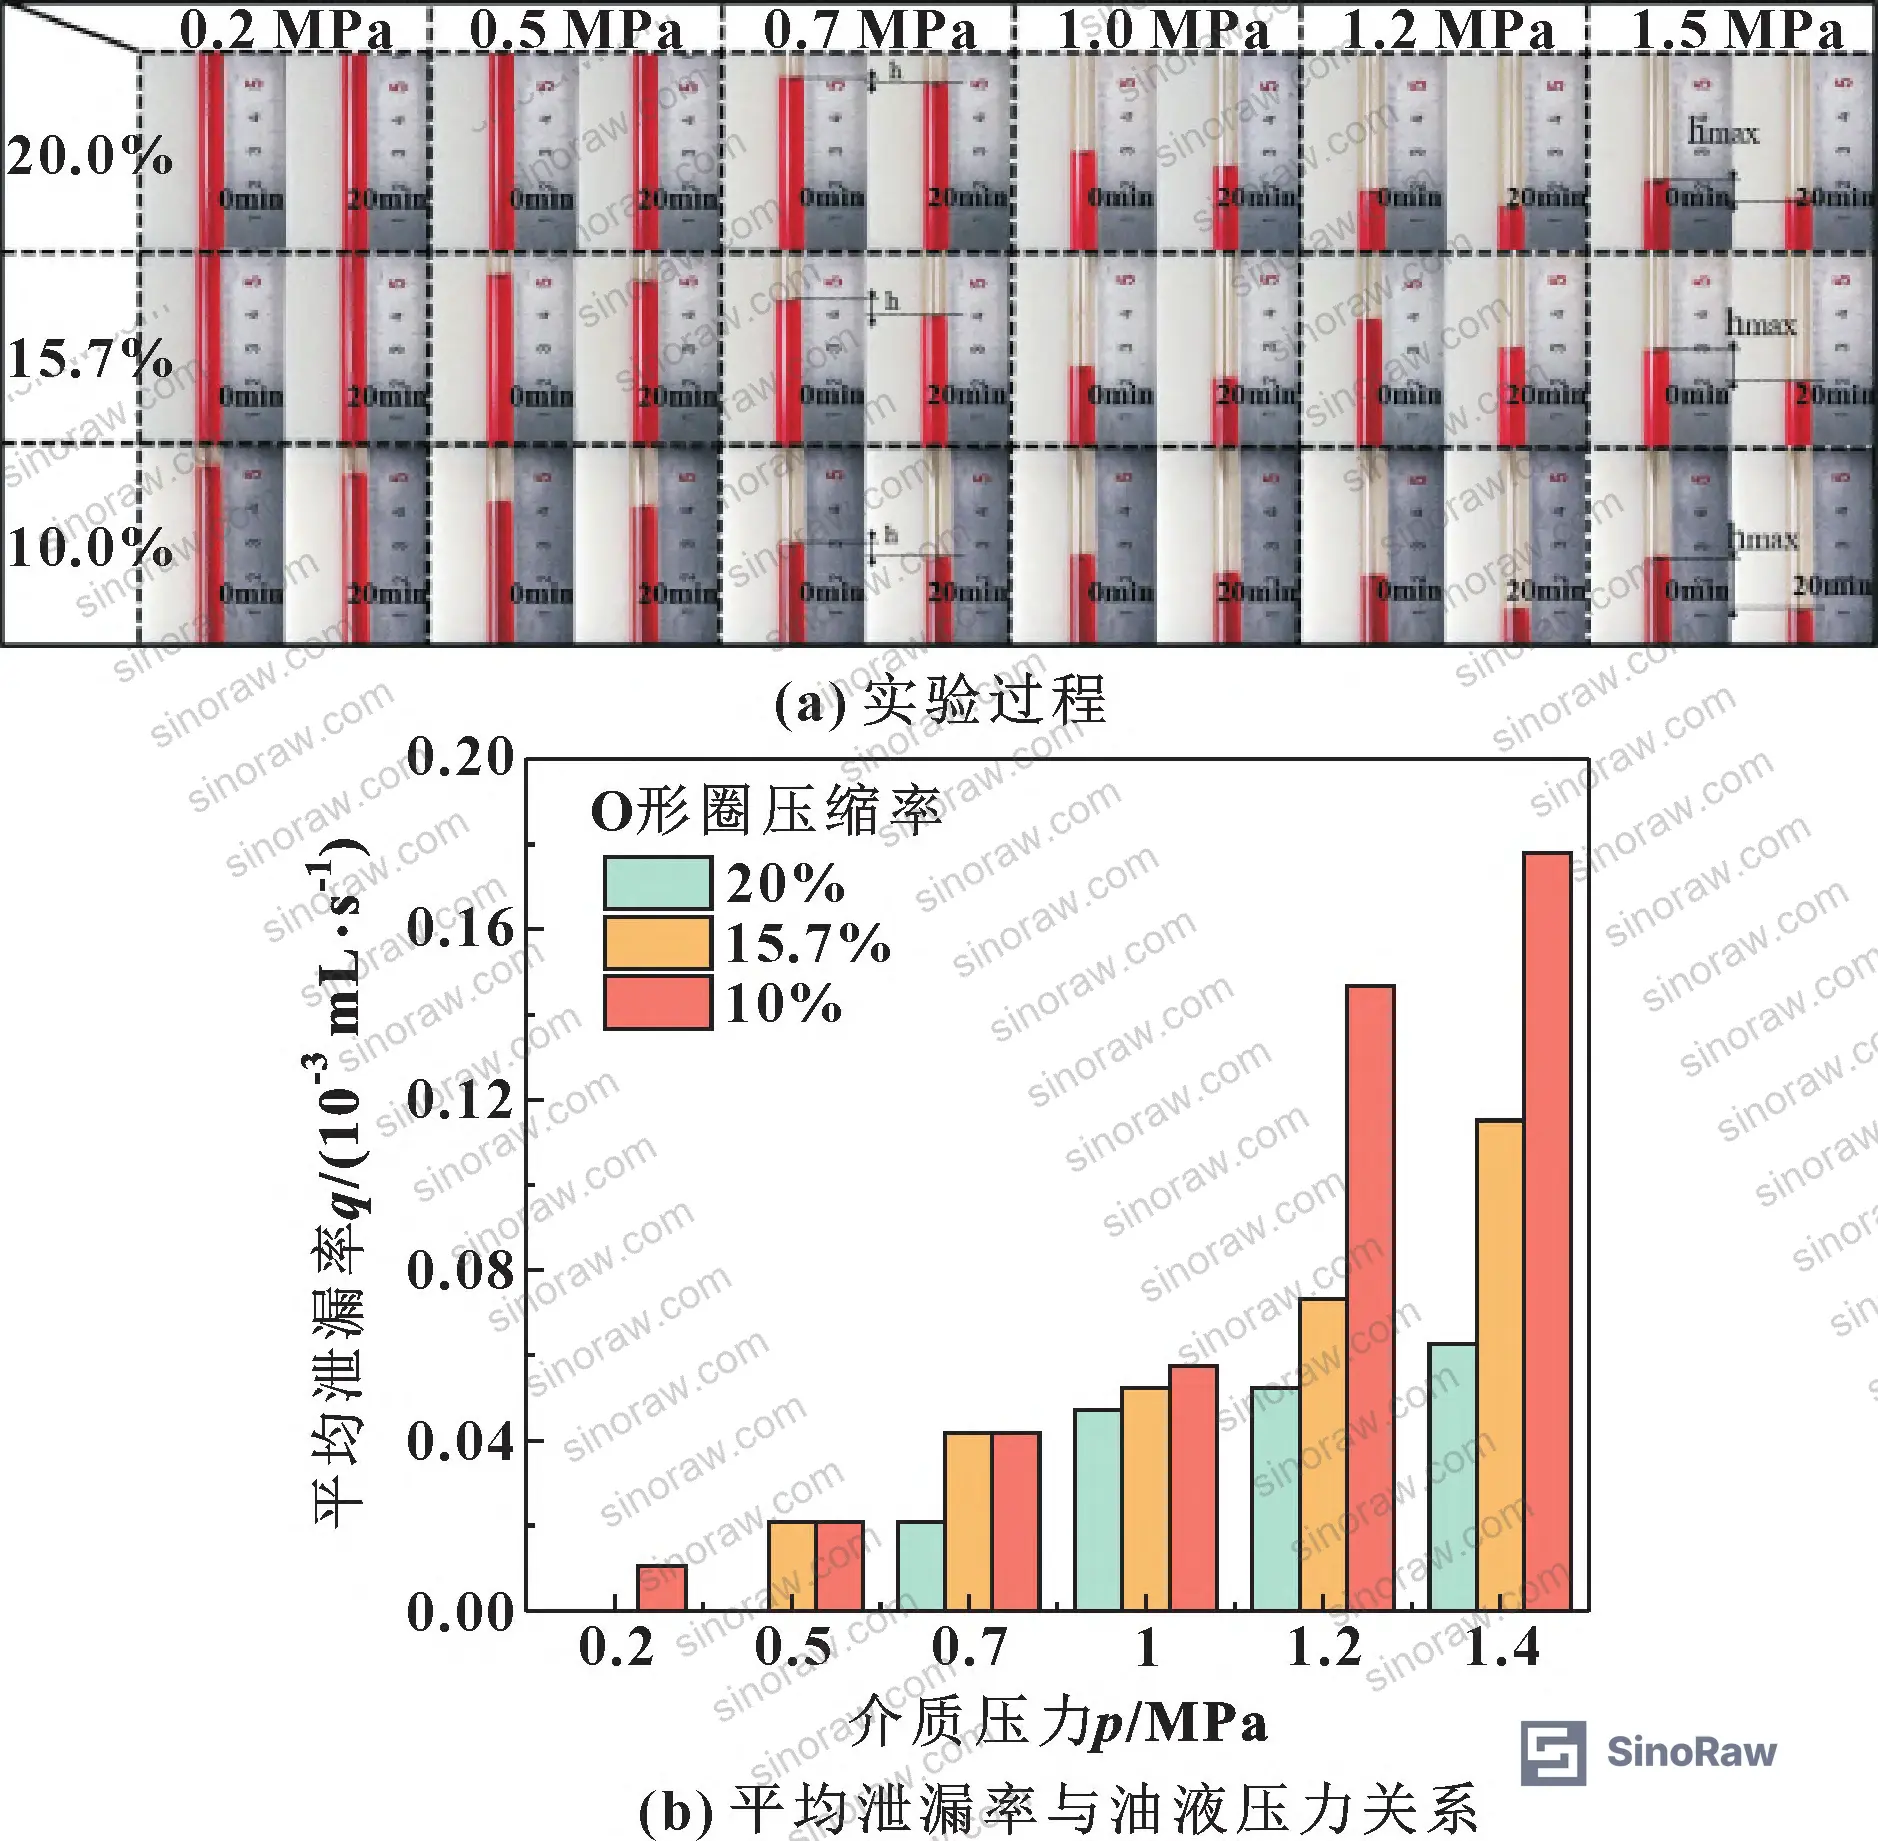
The experimental data validates the FEA-predicted stress asymmetry: dynamic sealing performance degrades because the relaxed end cannot maintain sufficient contact pressure during stroke reversal, creating transient leakage paths that static analysis cannot capture. Buyers specifying O-rings for reciprocating applications should mandate dynamic leakage testing at the actual operating pressure rather than accepting static test data as sufficient — a substitution that manufacturers prefer because it makes marginal designs appear acceptable.
Practical Guidance for Buyers #
When qualifying NBR O-ring suppliers for low-pressure hydraulic or pneumatic actuators operating below 2.0 MPa, compression ratio verification must be the first evaluation criterion. Demand groove dimension tolerance reports showing actual machined depths within ±0.05 mm and O-ring cross-section measurements demonstrating <3% diameter variation across production batches. Manufacturers who cannot provide compression verification data are implicitly admitting they don't control the most critical seal performance parameter.
For dynamic sealing applications, require contact stress data from FEA models validated against experimental leakage testing, not generic material property tables. The Mooney-Rivlin constants C₁₀ and C₀₁ vary between NBR formulations; suppliers using standardized values from textbooks rather than batch-specific tensile testing are cutting corners that will manifest as premature seal failure. Specify minimum contact stress margins of 1.5× operating pressure at the design compression ratio — lower margins work on paper but fail to account for manufacturing variation, installation damage, and aging effects.
Review Industrial Hose seal specifications from the same manufacturer if evaluating multi-product suppliers; inconsistent approaches to compression tolerance or FEA validation across product lines indicate weak engineering discipline. The ISO 3601-1 standard for O-ring dimensions provides critical guidance on cross-section tolerances and surface finish requirements for sealing grooves that many Chinese manufacturers reference without actually implementing in production.
Need help identifying qualified suppliers for aircraft actuator seals with validated low-pressure dynamic sealing data? Talk to our sourcing team →
Supplier Qualification Questions #
- What is the installed compression ratio range for the ø20×3.6 mm O-ring in your standard groove geometry, and how is groove depth verified during production inspection?
- Can you provide Mooney-Rivlin constitutive model constants (C₁₀, C₀₁, d₁) derived from uniaxial tensile testing of your current NBR batch, along with the stress-strain curve used to establish these values?
- What is the maximum contact stress at the primary sealing interface for 15% compression under 1.5 MPa fluid pressure, and what FEA method was used to calculate this value?
- What is the measured leakage rate for your O-ring under dynamic sealing conditions at 1.2 MPa and 18% compression, tested at 10 strokes/min for minimum 500 cycles?
- At what compression ratio and cycle count do you observe the onset of surface cracking in accelerated fatigue testing at 1.5 MPa and 85°C?
Sourcing Checklist #
- ☐ Groove depth measured and documented showing actual compression ratio ≥15% with tolerance ±2%
- ☐ Mooney-Rivlin material constants provided from batch-specific tensile testing, not generic handbook values
- ☐ FEA analysis report provided showing contact stress distribution under both static and dynamic loading at specified operating pressure
- ☐ Dynamic leakage rate test data provided showing ≤0.1 mL/min at 1.2 MPa and design compression ratio
- ☐ Material hardness verified at 45 ±5 Shore A per ASTM D2240 with certification from accredited lab
- ☐ Surface finish of sealing groove documented as Ra ≤0.8 μm per ISO 3601-3
- ☐ Compression set testing data provided showing ≤25% permanent set after 70h at 100°C per ASTM D395 Method B
- ☐ Cycle life testing documentation showing >5,000 cycles without visible cracking at 1.5 MPa and 18% compression
Key Specifications Table #
| Parameter | Recommended Value | Verification Method |
|---|---|---|
| Compression Ratio | 15–20% for pressures <1.5 MPa; 20–25% for dynamic sealing | Groove depth measurement with calibrated digital micrometer (±0.01 mm resolution); O-ring cross-section measurement per ISO 3601-1 |
| Contact Stress Margin | ≥1.5× operating pressure at design compression | FEA simulation using Mooney-Rivlin model with batch-specific constants; validation against experimental contact force measurements |
| Dynamic Leakage Rate | ≤0.1 mL/min at maximum operating pressure and minimum design compression | Test bench measurement over 500 cycles at 10 strokes/min with calibrated graduated cylinder (±0.05 mL resolution) |
| Material Hardness | 45 ±5 Shore A for NBR in low-pressure hydraulic service | ASTM D2240 hardness testing with Type A durometer on compression-molded test specimens |
| Surface Finish (Groove) | Ra ≤0.8 μm on sealing surfaces | Surface roughness measurement per ISO 4287 using contact profilometer |
| Compression Set | ≤25% after 70h at 100°C | ASTM D395 Method B using 25% compression spacer in forced-air oven |
Can’t find a supplier meeting these specs? Submit your requirements and we’ll match you within 48 hours.
References #
Data source: Finite Element and Experimental Analysis of Nitrile Rubber O-Ring Sealing Performance Under Low-Pressure Dynamic and Static Conditions, T.-A. Liang et al., Tribology International, 2024
Frequently Asked Questions #
Why does dynamic sealing show higher leakage than static sealing at the same compression ratio and pressure?
Rolling torsion during reciprocating motion creates asymmetric contact stress distribution — the relaxed end drops 15–20% below static baseline stress, opening transient leakage paths during stroke reversal that static conditions don’t experience.
What compression ratio should I specify for a 1.2 MPa hydraulic actuator with reciprocating motion?
Specify 18–20% compression minimum. Below 15%, dynamic leakage rates exceed 0.15 mL/min at 1.2 MPa based on experimental data, which typically fails system leak-down requirements over a 24-hour hold period.
Can I use static sealing test data to qualify O-rings for dynamic applications?
No. Static testing masks the rolling torsion effect and stress asymmetry that dominate dynamic seal performance. Suppliers offering only static data are either inexperienced with reciprocating seals or deliberately avoiding the more stringent dynamic requirements.
How do I verify that my supplier is using actual FEA analysis rather than handbook estimates for contact stress?
Request the FEA mesh file, material property input deck showing Mooney-Rivlin constants, and von Mises stress contour plots. Suppliers using real simulation can provide these in minutes; those faking it will deflect or provide only summary tables.
What causes O-ring cracking in low-pressure actuators if the pressure is well below the material rating?
Cyclic strain from rolling torsion, not pressure magnitude. Even at 1.5 MPa, an O-ring undergoing 18° torsion per cycle accumulates fatigue damage that initiates surface cracks within 2,000–5,000 cycles at low compression ratios.
Published by sinoraw.com Technical Team | Request a sourcing quote


