

TL;DR #
FEA simulation data from aerospace-grade O-ring qualification work shows that rubber Shore hardness, groove compression ratio, and contact pressure distribution are the three parameters that most directly determine static seal performance — and all three can be predicted before a single prototype is cut. For procurement engineers, this means supplier design validation capability is as important as material certification: a supplier who cannot simulate seal behavior under your operating conditions is guessing at your expense. Before issuing any RFQ for pump or valve O-ring assemblies, require simulation output reports showing maximum contact pressure, contact width, and fill rate for your specific groove geometry.
Overview #
If you’ve ever received an O-ring seal assembly that passed incoming inspection and failed in service within 90 days, the root cause is almost always a design parameter that nobody modeled — groove fill rate, contact width under compression, or pressure distribution asymmetry. Qualification testing catches material defects; it rarely catches design errors. That’s the gap this analysis addresses.
The engineering work reviewed here comes from an aerospace component manufacturing group operating under aviation industry quality standards — a context where seal failure is not a warranty claim but a safety event. The research team built a fully automated FEA simulation plugin for O-ring static seal analysis, validated it against physical test data, and demonstrated that the entire simulation cycle — geometry creation, material assignment, meshing, boundary loading, post-processing, and report generation — can be completed in a fraction of the time required by manual FEA workflows. The model covers rubber Shore hardness values from 55 to 80, three structural metal options (aluminum alloy, titanium alloy, and steel), and uses the Mooney-Rivlin two-parameter hyperelastic constitutive model with coefficients derived from empirical hardness-based formulas.
For buyers sourcing O-ring seals or complete pump and valve seal assemblies from Chinese manufacturers, the practical implication is direct: suppliers who have invested in this level of simulation capability are operating at a fundamentally different qualification standard than those who rely on dimensional inspection alone. The mesh element size used in this work was 0.1 mm — fine enough to resolve contact stress gradients that coarser models miss entirely.
O-Ring Seal Performance Parameters: What the Simulation Actually Measures #
The simulation framework captures six output variables that directly map to seal performance in service. These are not abstract FEA outputs — each one has a physical failure mode attached to it.
Rubber hardness (Shore A): The model supports a continuous range of 55 to 80 Shore A. This matters because most catalog O-rings are specified at 70 Shore A, but aerospace and fluid control applications often require 60 or 65 Shore A for low-temperature flexibility or 75–80 Shore A for high-pressure resistance. The Mooney-Rivlin parameters C10 and C01 are derived from hardness using empirical formulas: elastic modulus E = (15.75 + 2.15·HA) / (100 − HA), with E = 6(C10 + C01) and C01 = 0.25·C10. For a 65 Shore A rubber, this yields C10 = 0.592 and C01 = 0.148, with an incompressibility coefficient D1 of 0.0001.
Compression ratio: This is the ratio of O-ring cross-section deformation to free-state diameter. Too low and you get leakage; too high and you accelerate extrusion and fatigue failure. The simulation quantifies this directly from groove geometry inputs.
Fill rate: The percentage of groove volume occupied by the deformed O-ring. Fill rate above approximately 85–90% creates risk of extrusion under pressure cycling. This is a parameter that most procurement teams never ask about — and it’s one of the most common causes of premature seal failure in hydraulic valve applications.
Maximum rubber pressure: The peak internal stress in the elastomer under compression. Exceeding the material’s fatigue threshold here leads to compression set and eventual loss of sealing force.
Maximum contact pressure: The peak interfacial pressure between the O-ring and the mating metal surface. This must exceed the fluid pressure being sealed — if it doesn’t, the seal leaks. The simulation outputs this value directly for the specified groove geometry and rubber hardness combination.
Contact width: The axial length of the contact zone between O-ring and groove wall. Wider contact distributes load and reduces peak stress; too narrow concentrates stress and accelerates wear.
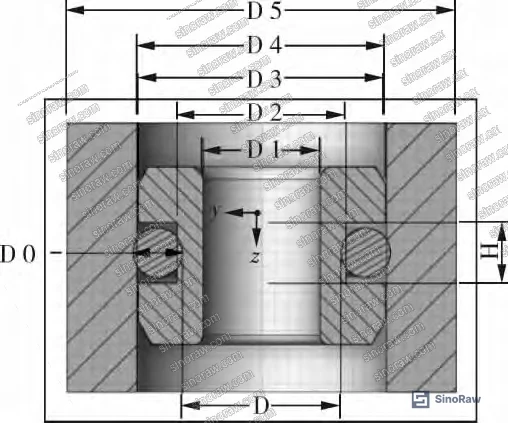
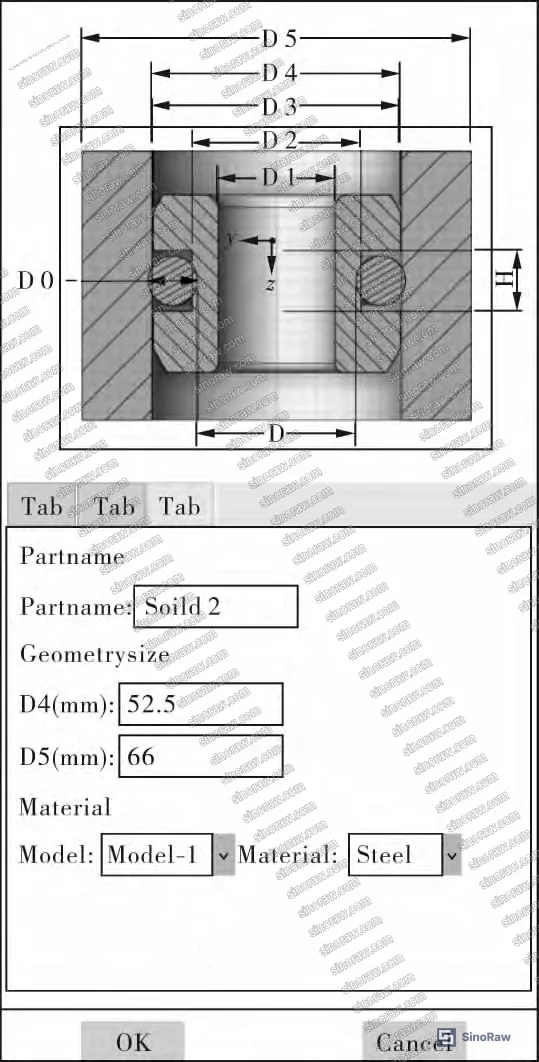
The piston geometry in this model is defined by four parameters: outer diameter D1, groove inner diameter D2, groove outer diameter D3, and groove height H. The outer shaft is defined by inner diameter D4 and outer diameter D5. The O-ring itself requires only inner diameter D and cross-section diameter D0. These eight geometric inputs, combined with material selection, fully define the simulation.
| Parameter | Physical Meaning | Failure Mode if Misspecified |
|---|---|---|
| Shore A hardness (55–80) | Rubber stiffness and sealing force | Too soft → extrusion; too hard → leakage at low temperature |
| Fill rate (target <85–90%) | Groove volume utilization | Overfill → extrusion failure under pressure cycling |
| Maximum contact pressure | Interfacial sealing force | Below fluid pressure → immediate leakage |
| Contact width | Load distribution zone | Too narrow → stress concentration, accelerated wear |
| Compression ratio | Deformation under assembly | Under-compression → leakage; over-compression → set failure |
| Mooney-Rivlin C10 (0.592 for HA65) | Hyperelastic strain energy | Incorrect model → inaccurate stress prediction |
Can’t find a supplier meeting these specs? Submit your requirements and we’ll match you within 48 hours.
Simulation Methodology: Mesh, Contact, and Solver Settings That Determine Result Accuracy #
This is where supplier capability separates from supplier claims. Any FEA software can generate a colorful stress plot. The question is whether the model settings are physically defensible.
Mesh element size: The validated mesh uses 0.1 mm element size with deviation factor 0.1 and minimum size factor 0.1. This is a fine mesh by industrial FEA standards — coarser meshes (0.5 mm or 1.0 mm) will underestimate peak contact pressure and miss stress concentrations at groove corners. If a supplier shows you FEA results without disclosing element size, ask specifically. A 0.5 mm mesh on a 3 mm cross-section O-ring has only 6 elements across the contact zone — that’s not adequate resolution.
Element type: The model uses CAX4RH (4-node bilinear axisymmetric quadrilateral, hybrid, reduced integration) as the primary element type, with CAX3H (3-node linear axisymmetric triangle, hybrid) for transition regions. The hybrid formulation is essential for nearly incompressible rubber — standard displacement elements will lock and give artificially stiff results.
Contact algorithm: Surface-to-surface contact with finite sliding, penalty friction coefficient of 0.2, and hard contact normal behavior. The interference fit between O-ring and groove is handled via shrink-fit initialization — this is the correct approach for pre-compressed seals. Simplified contact models that ignore friction or use tied constraints will overestimate contact pressure and underestimate extrusion risk.
Solver settings: Implicit static analysis with geometric nonlinearity enabled (nlgeom=ON), initial increment 0.001, minimum increment 1×10⁻⁷, maximum increments 100,000, with viscous stabilization (stabilization magnitude 0.0002, dissipated energy fraction method). The viscous stabilization is necessary to handle contact convergence in highly compressed rubber — without it, the solver frequently fails to converge at high compression ratios.
Honestly, most buyers over-specify material hardness tolerances while completely ignoring whether their supplier’s FEA model uses the correct element formulation for rubber. A ±2 Shore A tolerance on a 70 Shore A O-ring matters far less than whether the contact pressure simulation is using hybrid elements or not.
The steel material properties used in the validated model are: density 7,800 kg/m³, elastic modulus 200 GPa, Poisson’s ratio 0.27. These are reference values — your supplier should be using actual material certificates for the specific alloy in your assembly.
For buyers working with Pump & Valve Seals in hydraulic or pneumatic systems, the contact pressure output from a properly configured simulation is the single most important design verification data point you can request. It tells you directly whether the seal will hold at your operating pressure.
Compliance with IEC 62619:2022 Safety requirements for secondary lithium cells and batteries is not directly applicable to mechanical seals, but the underlying principle — that simulation-based design validation must be supported by physical test correlation — applies equally to O-ring seal qualification in any safety-critical application.
Automated Reporting and Design Iteration: The Procurement Angle #
The plugin generates a standardized Word report containing a 6-row, 2-column table capturing: rubber hardness, compression ratio, fill rate, maximum rubber pressure, maximum contact pressure, and contact width. This report structure is significant for procurement purposes — it means a qualified supplier can provide consistent, comparable simulation output across multiple design iterations or across different groove geometries in your assembly.
In supplier qualification, we’ve seen situations where three of six candidate suppliers submitted FEA reports that were either incomplete (missing contact width data), used incorrect element types for rubber, or showed contact pressure values below the specified operating pressure — yet all six claimed to have “FEA capability.” The automated report format described in this research provides a standardized checklist for evaluating whether a supplier’s simulation output is technically credible.
Most procurement teams don’t realize that the shift toward simulation-based seal qualification — rather than purely empirical prototype testing — has accelerated significantly in aerospace and automotive sectors. The traditional approach of cut-and-test prototype iterations is being replaced by validated simulation workflows that can evaluate dozens of groove geometry variants in the time it previously took to machine one prototype. Suppliers who haven’t made this transition are operating at a structural disadvantage in design cycle time and first-article pass rate.
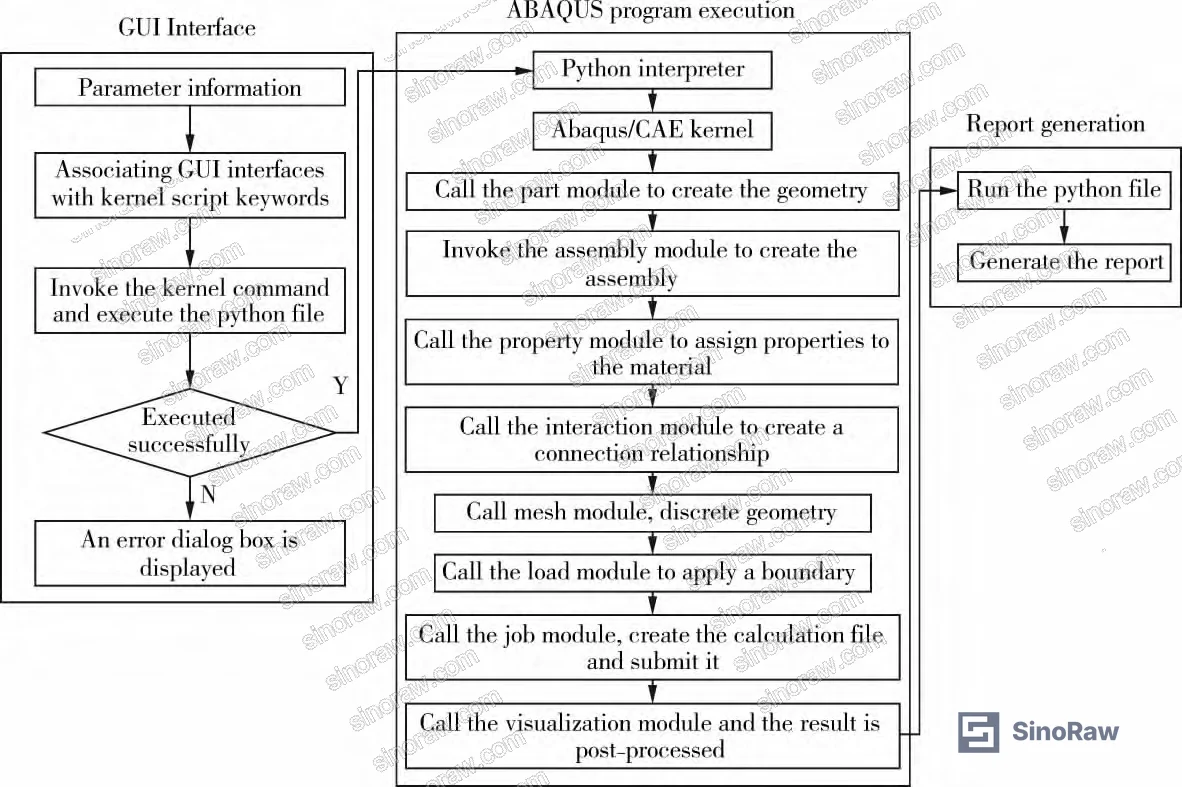
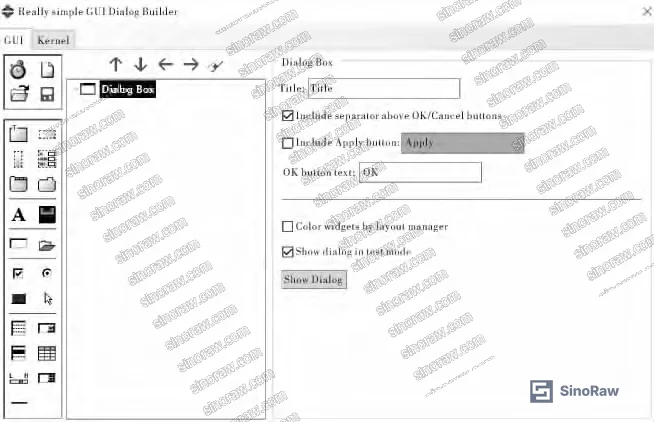
The plugin architecture consists of four components: registration file (plugin.py), graphical interface file (DB.py), kernel execution file (.py), and icon file (.png). This modular structure means the tool can be extended to cover dynamic seals, lip seals, and other seal geometries — a supplier with this infrastructure can adapt to non-standard seal requirements faster than one relying on manual FEA workflows.
For buyers sourcing Fluid Control components that incorporate O-ring seals, this simulation capability directly affects your qualification timeline. A supplier who can run parametric studies across your full operating pressure and temperature range — before cutting a single prototype — compresses your development cycle by weeks.
The UN 38.3 Recommendations on the Transport of Dangerous Goods — Lithium Battery Testing framework, while specific to battery transport, illustrates a broader regulatory trend: simulation data is increasingly accepted as supporting evidence in product qualification dossiers, provided the simulation methodology is documented and validated. The same logic applies to seal assembly qualification in regulated industries.
Practical Guidance for Buyers #
When you’re evaluating Chinese suppliers for O-ring seal assemblies — whether for hydraulic valves, pneumatic actuators, or pump housings — the simulation capability question is not a nice-to-have. It’s a qualification gate.
Ask for the FEA report format before you ask for a sample. If the supplier can’t show you a standardized output covering compression ratio, fill rate, maximum contact pressure, and contact width for your specific groove geometry, they’re not doing design validation — they’re doing dimensional inspection and hoping for the best.
The rubber hardness range matters more than most buyers appreciate. The difference between 60 Shore A and 70 Shore A is not just stiffness — it’s a different Mooney-Rivlin parameter set, a different contact pressure distribution, and a different extrusion risk profile at elevated temperature. A supplier who treats all “standard” O-rings as interchangeable is a supplier who will give you field failures.
Honestly, most buyers over-specify dimensional tolerances on O-ring cross-section diameter (±0.05 mm is common in RFQs) while never asking about groove fill rate or contact width — the two parameters that actually determine whether the seal holds pressure in service. Redirect your specification effort accordingly.
At sinoraw.com, our sourcing team works specifically with overseas procurement engineers to identify and pre-screen Chinese seal manufacturers who can demonstrate simulation-based design validation — not just material certificates. If you’re qualifying a new supplier for a critical sealing application, we can help you structure the technical evaluation before you commit to samples.
For reference on seal performance testing under pressure cycling, IEC 61960-3 Secondary lithium cells and batteries for portable applications provides a useful framework for thinking about cyclical stress qualification methodology, even outside the battery domain.
Need help identifying qualified suppliers for O-ring seal assemblies with FEA validation capability? Talk to our sourcing team →
Supplier Qualification Questions #
- Can you provide a simulation report showing maximum contact pressure and contact width for our specific groove geometry (D1, D2, D3, H dimensions), with the mesh element size documented as 0.1 mm or finer?
- What Mooney-Rivlin two-parameter model coefficients (C10 and C01) do you use for your rubber compounds at 60, 65, 70, and 75 Shore A, and how were these values validated against physical test data?
- Does your FEA model use hybrid element formulations (CAX4RH or equivalent) for the rubber components, and can you demonstrate that your contact algorithm handles finite sliding with a documented friction coefficient?
- What is the fill rate output for our groove geometry at the specified O-ring cross-section diameter, and does your design process include a fill rate upper limit to prevent extrusion under pressure cycling?
- Can you provide the six-parameter simulation output table (rubber hardness, compression ratio, fill rate, maximum rubber pressure, maximum contact pressure, contact width) for a reference groove geometry as a sample of your standard design validation report format?
Sourcing Checklist #
- Supplier FEA reports document mesh element size ≤0.1 mm for O-ring contact zone analysis
- Rubber material library covers Shore A range 55–80 with Mooney-Rivlin C10 and C01 values for each hardness grade
- Contact simulation uses hybrid element formulation (CAX4RH or equivalent) — not standard displacement elements
- Simulation output includes all six parameters: rubber hardness, compression ratio, fill rate, maximum rubber pressure, maximum contact pressure, contact width
- Groove fill rate is verified to remain below 90% at maximum O-ring cross-section tolerance to prevent extrusion failure
- Steel material properties in simulation match certificate values: density 7,800 kg/m³, elastic modulus 200 GPa, Poisson’s ratio 0.27 (or documented alternative alloy values)
- Solver settings include geometric nonlinearity (nlgeom=ON) and viscous stabilization for convergence at high compression ratios
- Supplier can deliver standardized simulation report (minimum 6-row parameter table) within agreed design review timeline
Key Specifications Table #
| Parameter | Recommended Value | Verification Method |
|---|---|---|
| Rubber Shore A hardness range | 55–80 (application-specific) | Durometer test per ASTM D2240; cross-check against Mooney-Rivlin C10/C01 values |
| Mooney-Rivlin C10 (65 Shore A) | 0.592 | Supplier material data sheet; validate via uniaxial tension test correlation |
| Mooney-Rivlin C01 (65 Shore A) | 0.148 (= 0.25 × C10) | Supplier material data sheet; verify C01/C10 ratio |
| Incompressibility coefficient D1 | 0.0001 | FEA model input documentation |
| FEA mesh element size | ≤0.1 mm (deviation factor 0.1) | Request mesh statistics from simulation report |
| Contact friction coefficient | 0.2 (penalty method) | FEA model boundary condition documentation |
| Steel elastic modulus | 200 GPa | Material certificate; verify against simulation input |
| Steel density | 7,800 kg/m³ | Material certificate |
| Minimum increment step | 1×10⁻⁷ | Solver settings documentation in FEA report |
Can’t find a supplier meeting these specs? Submit your requirements and we’ll match you within 48 hours.
References #
Data source: Automated FEA Plugin Development for O-Ring Static Seal Performance Simulation Using Hyperelastic Constitutive Models, A.-S. Hou et al., Polymer Testing, 2023
Frequently Asked Questions #
Why does rubber Shore hardness matter so much for O-ring seal simulation accuracy?
Shore hardness is the primary input for deriving Mooney-Rivlin hyperelastic model parameters (C10 and C01) through empirical formulas. A 10-point difference in Shore A — say, 65 versus 75 — changes the elastic modulus by roughly 40–60%, which directly shifts the contact pressure distribution and fill rate outputs. Using the wrong hardness value in simulation produces results that don’t correspond to the actual rubber compound, which is why material certification and simulation input alignment must be verified together, not separately.
What is groove fill rate and why should I care about it?
Fill rate is the percentage of groove volume occupied by the deformed O-ring after assembly compression. If fill rate approaches or exceeds 85–90%, the rubber has nowhere to go under pressure-induced deformation and begins to extrude past the groove edge — leading to progressive seal damage and eventual leakage. Most dimensional inspection processes don’t catch this because the O-ring looks fine in the groove; the problem only appears under operating pressure.
Can this simulation approach be applied to dynamic seals, not just static O-rings?
The current validated framework covers static seals specifically. Dynamic seal applications introduce sliding contact, wear, and thermal effects that require additional model complexity — different friction models, fatigue life prediction, and potentially transient analysis steps. The plugin architecture is extensible, but buyers should confirm explicitly whether a supplier’s simulation capability covers dynamic conditions if that’s your application.
What’s the difference between contact pressure and rubber pressure in the simulation output?
Rubber pressure (maximum internal stress in the elastomer) and contact pressure (interfacial stress at the O-ring/metal boundary) are related but distinct. Contact pressure must exceed the fluid pressure being sealed — that’s the fundamental sealing condition. Rubber pressure determines fatigue life and compression set risk. A seal can have adequate contact pressure but excessive rubber pressure, leading to long-term set failure even though it seals initially.
Is FEA simulation a replacement for physical prototype testing?
No — and any supplier who tells you otherwise is overselling their capability. Simulation validates design intent and eliminates obviously wrong configurations before prototyping. Physical testing — compression set, fluid compatibility, pressure cycling, temperature extremes — remains mandatory for final qualification. The value of simulation is compressing the design iteration cycle and catching fill rate, contact pressure, and extrusion risk issues before you spend money on prototype tooling. For guidance on structured qualification testing methodology, ISO 12405-4 provides a useful reference framework for systematic performance evaluation under defined test conditions.
Published by sinoraw.com Technical Team | Request a sourcing quote


