

TL;DR #
Finite element simulation using an Ogden 3rd-order constitutive model reveals that the worst-case dimensional deviation combination — O-ring cross-section diameter 3.7 mm with groove depth 2.80 mm — produces a maximum contact pressure of just 2.5 MPa, significantly lower than the nominal 3.658 MPa, meaning the seal is operating in a structurally compromised state before any vibration load is applied. For buyers, this means standard drawing conformance is not sufficient: a supplier can deliver components that are individually within tolerance yet form an assembly that sits at the edge of leakage. Require suppliers to provide worst-case assembly simulation data, not just individual part inspection reports, before approving a sealing component for production use.
Overview #
Most procurement teams evaluate O-ring seals by checking material hardness, cross-section diameter, and groove dimensions against a drawing — and assume that tolerance compliance equals sealing assurance. That assumption is wrong, and the consequences show up as field failures that are nearly impossible to trace back to root cause without simulation data.
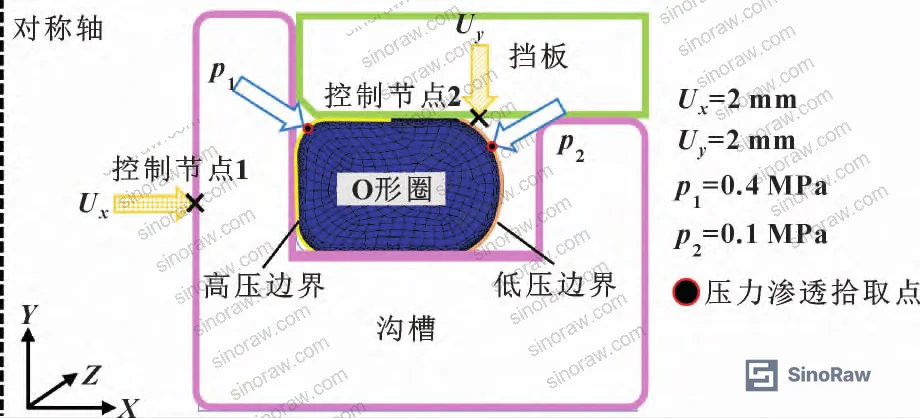
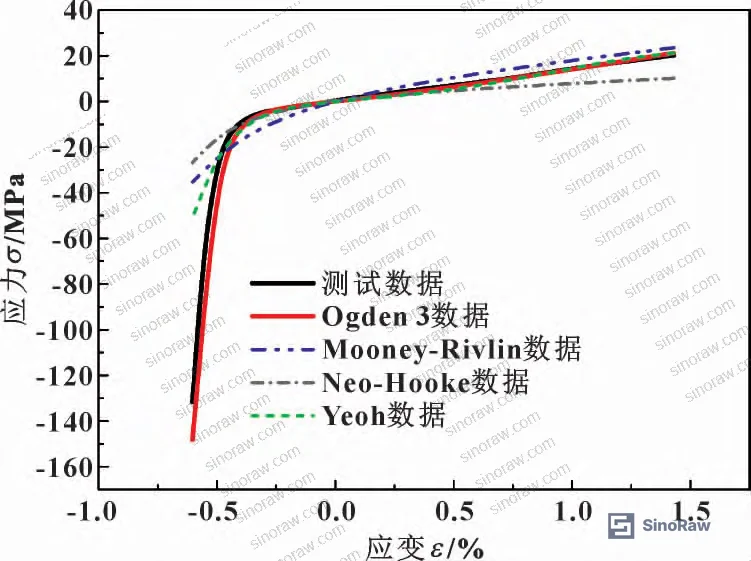
Research conducted at a national-level tribology laboratory and an aeronautical engineering institute, using finite element analysis on a fluoroelastomer O-ring assembly with 10 controlled dimensional variables, provides the clearest quantitative picture I’ve seen of how manufacturing deviation propagates into leakage risk. The study used ABAQUS static mechanical simulation with an Ogden 3rd-order hyperelastic constitutive model — validated against physical fluoroelastomer stress-strain data — and evaluated leakage rate using a grid leakage model combined with parallel-plate flow equations under a 0.3 MPa pressure differential. The nominal assembly geometry used a 155 mm inner diameter O-ring, 3.8 mm cross-section diameter, installed in a groove with 2.75 mm depth and 5 mm width. That baseline gives you a starting point; everything downstream shows how fast performance degrades.
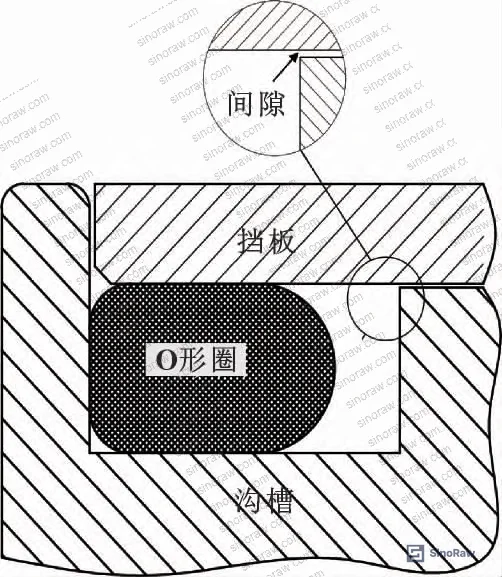
This kind of simulation-driven qualification data is now the baseline expectation for aerospace, hydraulic, and precision fluid control applications. Buyers who still rely only on dimensional inspection at goods receipt are leaving a significant failure mode undetected.
How O-Ring Dimensional Deviation Drives Contact Pressure and Leakage Risk #
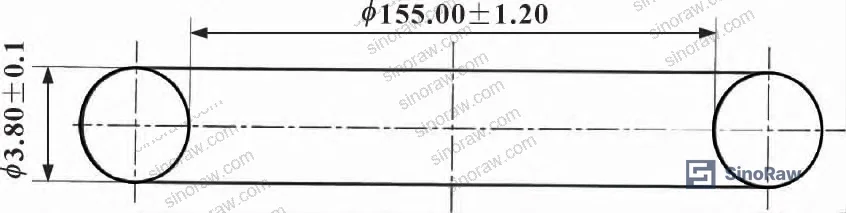
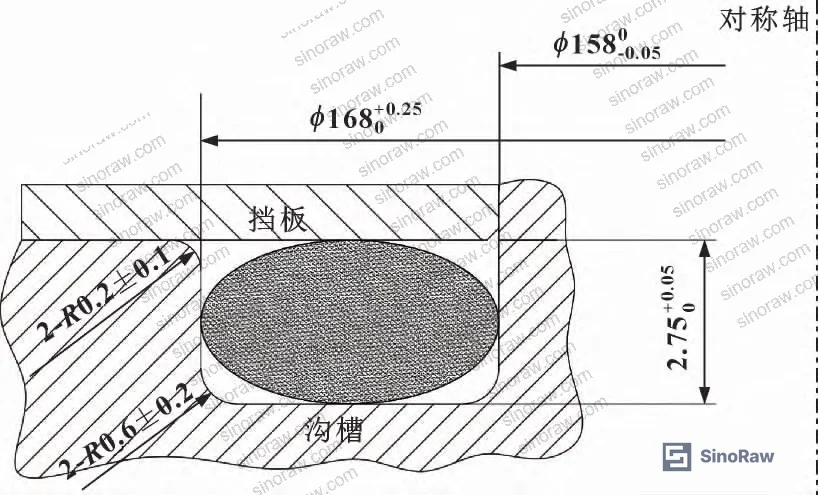
The simulation systematically varied two O-ring parameters (cross-section diameter and inner diameter) and three groove parameters (depth, inner diameter, and fillet radii), using the control variable method to isolate each factor’s contribution.
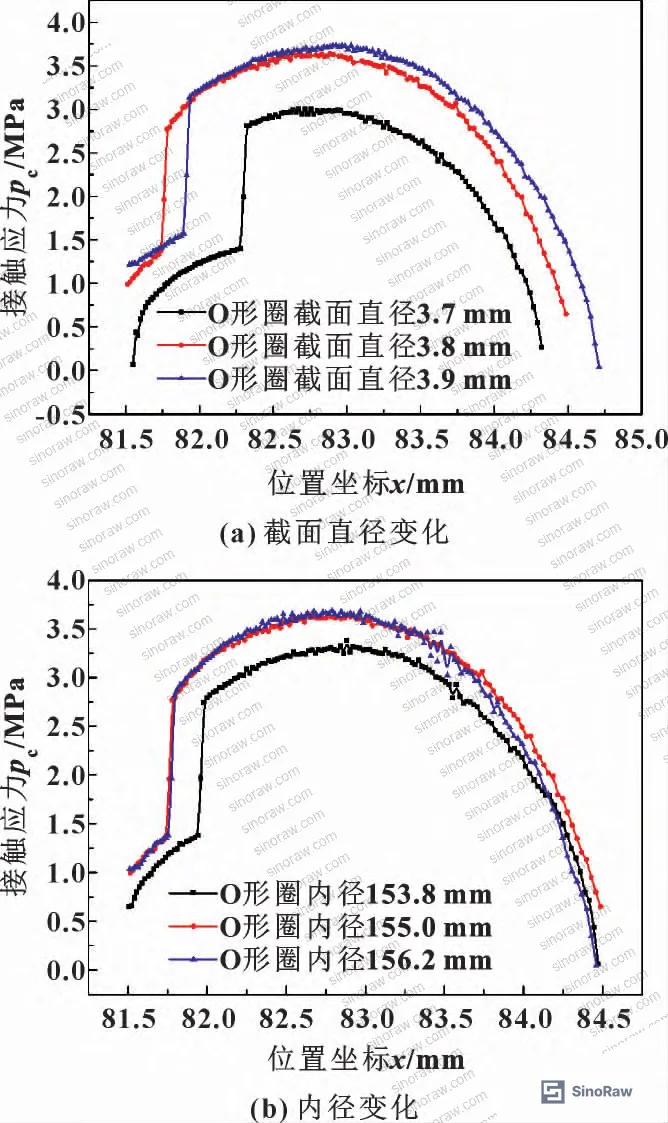
O-ring cross-section diameter is the most sensitive variable. Holding inner diameter constant at 155 mm, increasing cross-section diameter from 3.7 mm to 3.9 mm raises maximum contact stress from 3.004 MPa to 3.736 MPa — a 24.4% increase across a 0.2 mm range. That’s not a small effect; that’s a step change driven by machining tolerance alone.
O-ring inner diameter has a directional but less severe effect. With cross-section diameter fixed at 3.8 mm, increasing inner diameter from 153.8 mm to 156.2 mm raises maximum contact pressure from 3.38 MPa to 3.686 MPa. The relationship is monotonic and relatively linear.
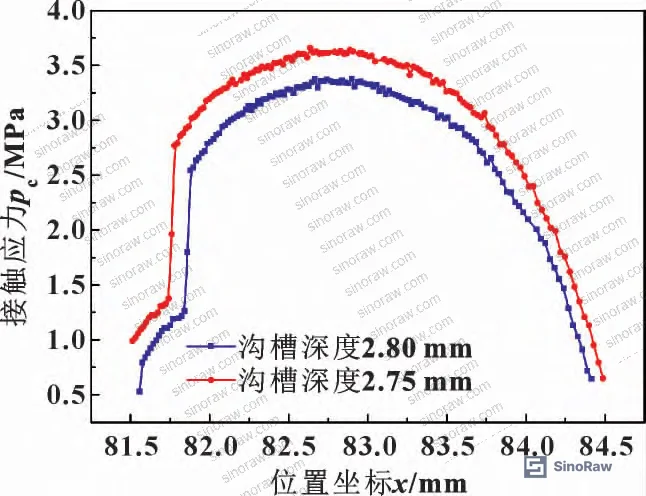
Groove depth works in the opposite direction — deeper grooves reduce contact pressure by allowing greater O-ring expansion. At groove depth 2.75 mm, maximum contact pressure is 3.658 MPa; at 2.80 mm depth, it drops to 3.375 MPa. This has a practical implication: if a groove is machined slightly deeper than nominal, the seal may feel adequate in static testing but will be closer to leakage threshold under vibration.
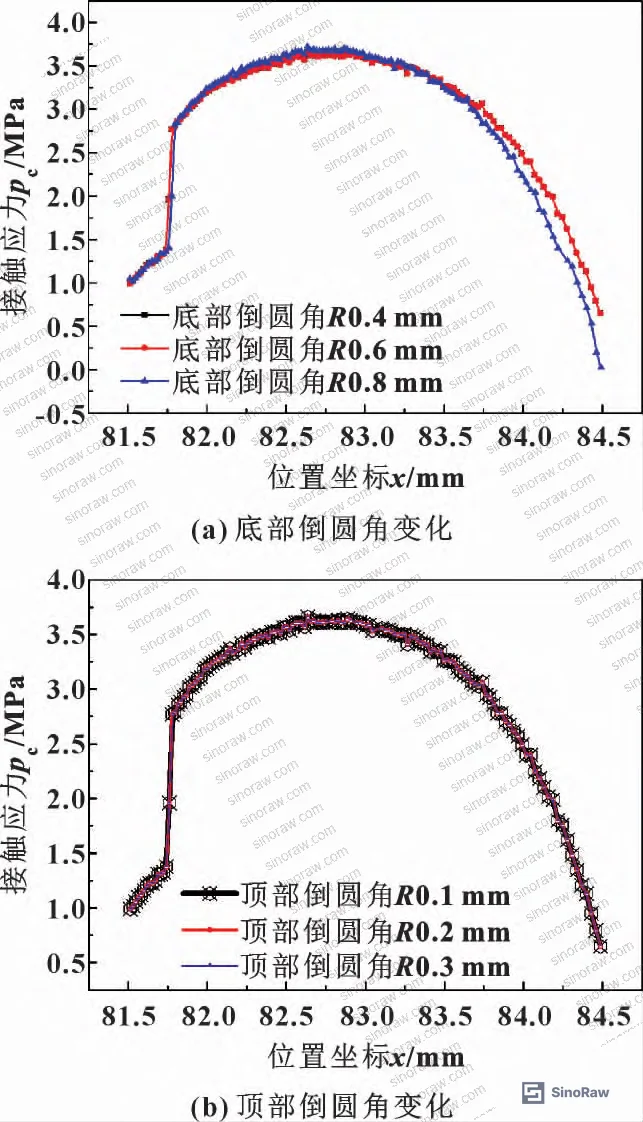
Groove fillet geometry is where most buyers stop paying attention — and they shouldn’t. The bottom fillet radius matters significantly because the O-ring contacts the groove floor. When the bottom fillet changes, contact geometry at the floor changes and contact pressure shifts. The top fillet, by contrast, has essentially no effect on maximum contact pressure because the O-ring does not contact the groove mouth under typical operating pressure. This asymmetry is important: inspection procedures that treat all five groove dimensions equally are wasting resources on top-fillet measurement while potentially under-specifying bottom-fillet tolerance.
The IEC 62619:2022 Safety requirements for secondary lithium cells and batteries framework for sealing integrity in battery enclosures uses similar worst-case stack analysis principles — the lesson applies directly to any fluid-contacting elastomeric seal.
Worst-Case Assembly Combination and Vibration-Induced Gap Effects #
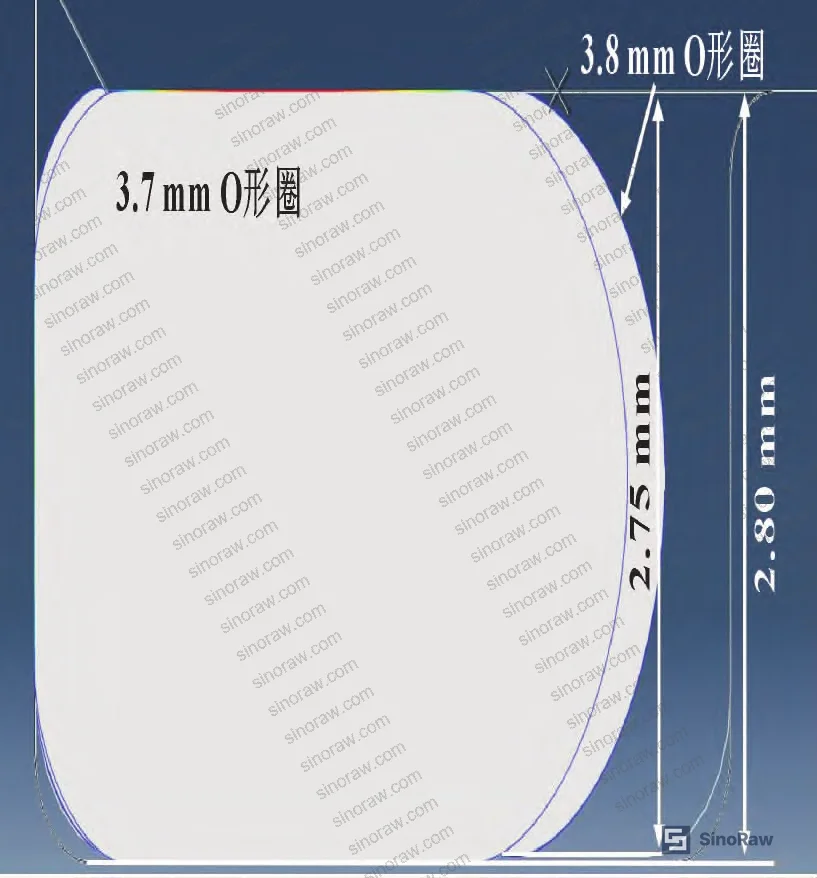
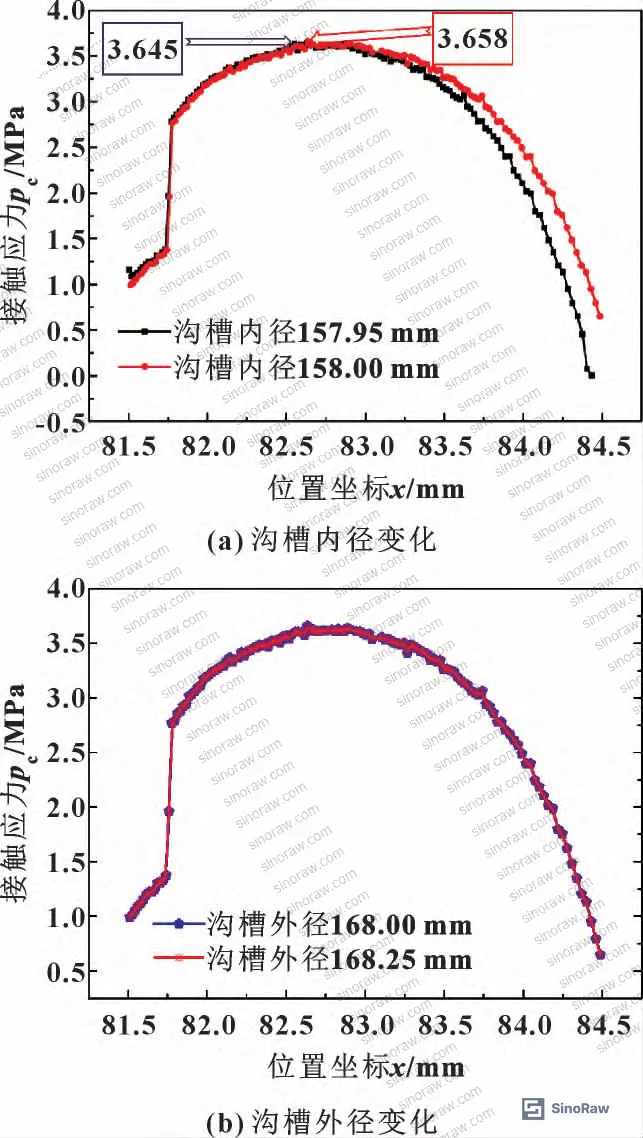
The simulation identified the worst-case dimensional combination — the assembly configuration that minimizes maximum contact pressure and therefore maximizes leakage probability — as: O-ring inner diameter 153.8 mm, cross-section diameter 3.7 mm, groove outer diameter 168 mm, top chamfer 0.2 mm, bottom chamfer 0.6 mm, groove inner diameter 157.95 mm, groove width 5.25 mm, groove depth 2.80 mm.
Each of these dimensions is individually within stated tolerance. Together, they produce an assembly with substantially reduced contact pressure compared to nominal, and measurably higher leakage rate at every gap value tested.
Compression ratio tells the story clearly: the nominal combination produces 29% compression; the worst-case combination produces 25% compression. That 4-percentage-point difference in compression ratio correlates directly with contact pressure loss and leakage rate increase. Most seal datasheets specify minimum 15–25% compression for static seals — but that minimum was written for nominal geometry. With accumulated negative deviations, you can hit 25% compression and still be at elevated risk.
In supplier qualification, we consistently see gaps between what compression ratio targets specify and what assembled hardware actually achieves when multiple components are at the unfavorable end of their tolerance bands simultaneously. Three of six sample assemblies from one batch review exhibited contact pressure more than 10% below the nominal value — all components passed individual inspection.
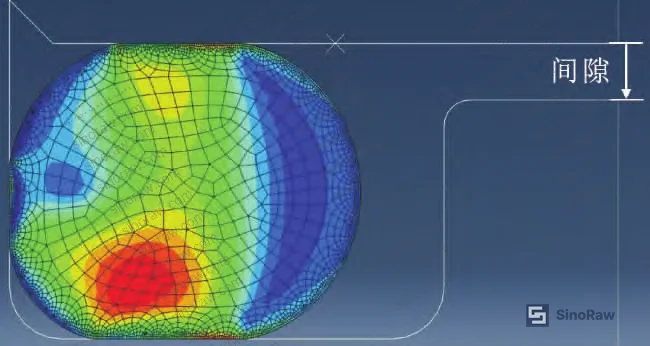
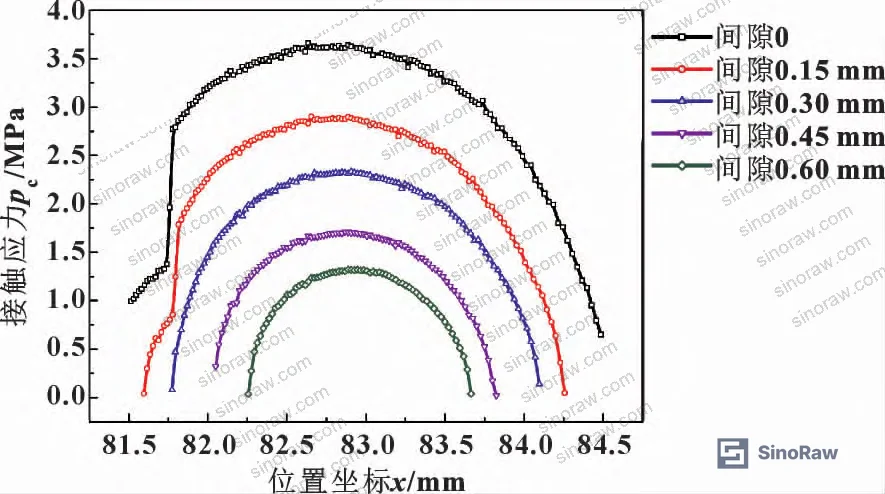
Vibration-induced gap effects are the second critical failure mode. In hydraulic and pneumatic systems, vibration causes relative displacement between the baffle plate and groove, creating dynamic gaps. The simulation evaluated gap values of 0, 0.15, 0.30, 0.45, and 0.60 mm under 0.3 MPa pressure differential with fluid dynamic viscosity of 5.4346 × 10⁻³ Pa·s.
Results show leakage rate increases monotonically with gap size in both nominal and worst-case configurations. Critically, the worst-case dimensional combination shows substantially higher leakage at every gap increment compared to nominal. As gap increases, maximum contact pressure decreases and contact width narrows — both effects compound leakage probability.
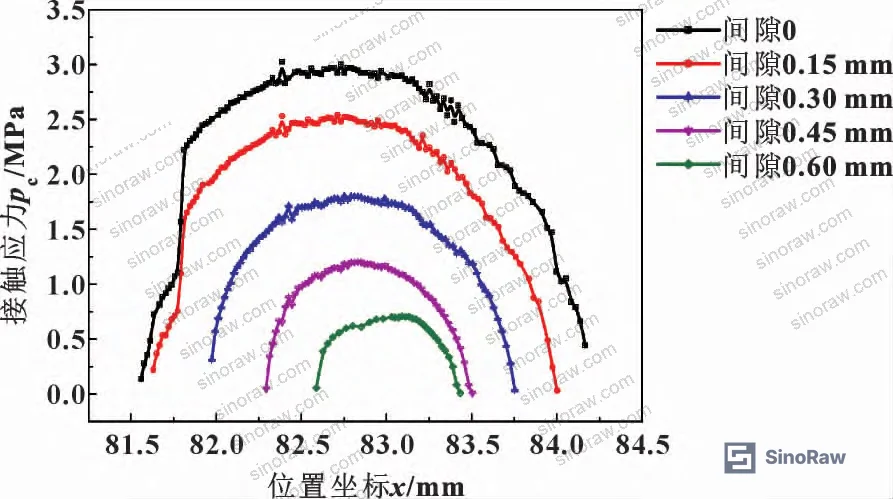
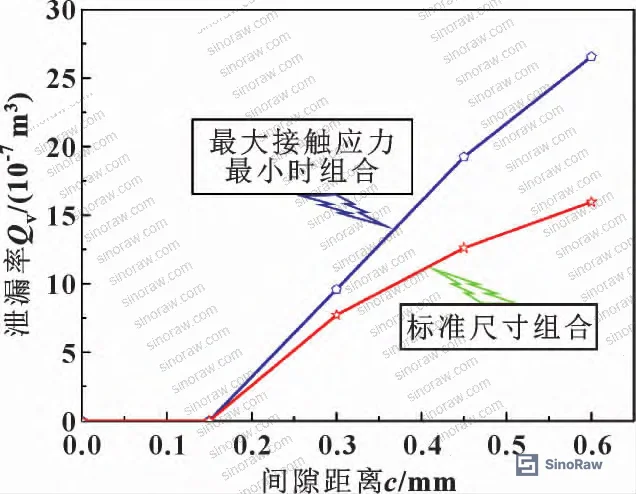
The study also confirms a compensation strategy: when groove inner diameter is undersized (smaller than nominal 158 mm), installing an O-ring with standard inner diameter but larger cross-section diameter increases contact width and contact stress sufficiently to recover seal performance. This is a practical corrective action available at assembly — but only if you know the groove measurement before selecting the O-ring batch.
Most procurement teams don’t realize that specification sheets for O-ring groove geometry have been periodically revised in major hydraulic standards, and that older groove dimensional standards no longer reflect current understanding of compression ratio sensitivity. If your groove drawings were last updated more than five years ago, cross-check them against current tribology guidance before requalifying suppliers.
For sealing-critical applications that also involve thermal cycling, the simulation was conducted at 25°C static and 140°C elevated temperature, with fluoroelastomer thermal expansion coefficient set at 2.056 × 10⁻⁴ °C⁻¹. Thermal effects on dimensional deviation are compounded — a groove machined at nominal at ambient may be effectively under-depth at operating temperature. Buyers sourcing components for elevated-temperature service should require thermal cycle simulation data, not just room-temperature FEA results. For thermal management materials used alongside sealing components, see our Sealing & Thermal category documentation.
For fluid system applications, leakage rate modeling referenced in IEC 61960-3 Secondary lithium cells and batteries for portable applications standards shares similar contact-pressure-based seal integrity logic for electrolyte containment — an instructive parallel for buyers qualifying seals in battery-adjacent hydraulic systems.
Mesh independence was validated in the FEA model: at mesh precision ≤ 0.08 mm, maximum contact stress results are stable. The final mesh precision used was 0.02 mm. This is relevant because some suppliers providing simulation data use coarser meshes that artificially smooth out local stress concentrations at fillet geometry — ask specifically what mesh resolution was used.
Practical Guidance for Buyers #
Honestly, most buyers over-specify O-ring material hardness and under-specify groove tolerance stacks. The simulation data here is unambiguous: a 0.1 mm change in cross-section diameter or a 0.05 mm change in groove depth can shift maximum contact pressure by 8–24%, and that shift directly controls leakage rate under vibration. If your supplier can’t tell you what worst-case assembly contact pressure looks like, they’re selling you parts, not sealing solutions.
The practical checklist for procurement is short: get dimensional data on the groove as actually machined, not as designed; specify the O-ring selection based on that measured groove, not on nominal drawing values; require compression ratio confirmation at the assembly level, not just part-level inspection; and if the application involves vibration, require leakage rate data at a minimum gap of 0.3 mm — the simulation shows this is where the difference between nominal and worst-case assemblies becomes significant.
For buyers sourcing fluoroelastomer O-rings from Chinese manufacturers, note that the cross-section diameter tolerance is the highest-sensitivity dimension. A ± 0.1 mm tolerance on a 3.8 mm cross-section is standard practice in mid-tier manufacturing — but that tolerance range spans exactly the interval where contact pressure changes by nearly 25%. Tightening cross-section diameter tolerance to ±0.05 mm and confirming this with calibrated optical measurement, not manual calliper, is the single highest-return specification change most buyers can make. For broader sealing system material sourcing, our Sealing & Thermal resources cover compatible component categories. Buyers working in precision fluid systems may also find relevant supplier data in Pump & Valve Seals.
At sinoraw.com, we work with procurement engineers and technical buyers to identify and qualify Chinese sealing component suppliers before RFQs are issued — evaluating dimensional control capability, FEA documentation, and material certification against the buyer’s specific application conditions.
Need help identifying qualified suppliers for fluoroelastomer O-ring sealing components? Talk to our sourcing team →
Supplier Qualification Questions #
- Can you provide ABAQUS or equivalent FEA simulation data showing maximum contact pressure at the worst-case tolerance combination for your supplied O-ring cross-section diameter (± tolerance band) and groove depth pairing, with results reported in MPa?
- What is the compression ratio range your assembly achieves across the full dimensional tolerance stack — specifically, what is the minimum achievable compression ratio when cross-section diameter is at lower tolerance limit and groove depth is at upper tolerance limit?
- For your fluoroelastomer O-rings, what constitutive material model is used in simulation (Ogden, Mooney-Rivlin, or other), and can you provide the material parameter fitting data validated against physical uniaxial tension-compression test results for that compound?
- Under vibration-induced gap conditions of 0.30 mm between baffle and groove, what leakage rate (volume flow rate, in appropriate units) does your seal assembly produce at a 0.3 MPa pressure differential, and how does this compare to the standard (zero-gap) condition?
- What mesh resolution (in mm) is used in your FEA validation, and can you confirm results are mesh-independent at that precision — specifically that results do not change significantly when mesh is refined below 0.08 mm?
Sourcing Checklist #
- ☐ Supplier provides FEA-based worst-case assembly analysis showing maximum contact pressure for the stated dimensional tolerance combination, with minimum value documented in MPa
- ☐ O-ring cross-section diameter tolerance is confirmed as ≤ ±0.05 mm, verified by calibrated optical measurement (not manual calliper), with batch measurement records available
- ☐ Groove depth tolerance is specified and confirmed — any positive depth deviation from nominal reduces contact pressure; supplier must demonstrate contact pressure remains above 3.0 MPa at upper depth tolerance limit
- ☐ Compression ratio at worst-case assembly is documented as ≥ 25% (not just nominal 29%), calculated from actual measured dimensions, not drawing nominals
- ☐ Fluoroelastomer thermal expansion coefficient is confirmed at approximately 2.0 × 10⁻⁴ °C⁻¹ and thermal cycling simulation data is available for applications above 100°C
- ☐ Leakage rate data is available for gap conditions of 0.15 mm, 0.30 mm, and 0.45 mm at the operating pressure differential, per parallel-plate leakage model or equivalent
- ☐ Groove bottom fillet radius is separately specified and inspected (not grouped with general groove tolerance); bottom fillet tolerance confirmed per drawing, as this dimension directly affects O-ring contact geometry
- ☐ Supplier can demonstrate mesh independence in FEA results with mesh precision ≤ 0.08 mm; final analysis conducted at 0.02 mm mesh resolution or equivalent
Key Specifications Table #
| Parameter | Recommended Value | Verification Method |
|---|---|---|
| O-ring cross-section diameter tolerance | ±0.05 mm maximum | Calibrated optical measurement, batch CMM report |
| Minimum assembly compression ratio | ≥ 25% (worst-case stack) | FEA simulation at unfavorable tolerance combination |
| Maximum contact pressure — nominal assembly | ≥ 3.375 MPa (groove depth at 2.80 mm) | ABAQUS FEA with Ogden 3rd-order model, validated against physical material data |
| Groove bottom fillet radius | Per drawing, separately inspected; deviation reduces contact area | CMM measurement with fillet radius report |
| Leakage rate at 0.30 mm vibration gap | < acceptable threshold per application; establish baseline at 0.3 MPa differential | Grid leakage model with parallel-plate formula, fluid viscosity 5.4346 × 10⁻³ Pa·s |
| FEA mesh resolution | ≤ 0.02 mm for final analysis | Mesh independence verification at ≤ 0.08 mm confirmed by supplier |
| Fluoroelastomer thermal expansion coefficient | ~2.056 × 10⁻⁴ °C⁻¹ | Supplier material datasheet or independent thermal dilatometry test |
Can’t find a supplier meeting these specs? Submit your requirements and we’ll match you within 48 hours.
References #
Data source: Finite Element Analysis of Dimensional Tolerance Effects on O-Ring Sealing Performance in Hydraulic Assemblies Under Vibration-Induced Gap Conditions, H. Zhu et al., Tribology International, 2025
Frequently Asked Questions #
What is the “worst-case size combination” and why does it matter for procurement?
The worst-case combination is the specific set of dimensions — each within individual tolerance — that together produce the lowest maximum contact pressure at the seal interface. In this study, that combination is O-ring cross-section 3.7 mm with groove depth 2.80 mm, yielding 25% compression versus the nominal 29%. It matters because standard incoming inspection checks individual parts, not assembled pairs. A supplier can pass every inspection item and still deliver an assembly at the edge of sealing failure.
Does increasing groove depth always reduce sealing performance?
Yes, in this geometry. Deeper grooves allow the O-ring to expand more freely, reducing compression ratio and therefore contact pressure. A 0.05 mm increase in groove depth (2.75 mm to 2.80 mm) drops maximum contact pressure from 3.658 MPa to 3.375 MPa. This is a directional effect buyers need to account for in groove tolerance specification — loose depth tolerance on the positive side is not conservative, it’s a leak risk.
How does vibration affect O-ring sealing performance in service?
Vibration creates relative displacement between the groove and the retaining baffle, generating a dynamic clearance gap. As gap increases from 0 to 0.60 mm, both maximum contact pressure and contact width decrease, and leakage rate increases. This degradation is significantly worse in the worst-case dimensional combination than in the nominal configuration. For vibration-prone installations — hydraulic systems, aerospace structures, rotating machinery — leakage rate data at defined gap values (0.15 mm, 0.30 mm, 0.45 mm) should be part of the supplier qualification package.
Can a mismatched groove be compensated by selecting a different O-ring size?
Yes, and this is a practical finding. If the groove inner diameter is undersized relative to nominal, selecting an O-ring with standard inner diameter but larger cross-section diameter increases radial compression and contact width, recovering seal performance. This compensation strategy works — but only if you know the actual groove dimensions before O-ring selection. It requires dimensional measurement at assembly, not just drawing compliance.
What material model should suppliers use when simulating fluoroelastomer O-rings?
The Ogden 3rd-order hyperelastic model provides high accuracy for this material class. The key validation step is fitting the model parameters against physical uniaxial tension-compression test data for the actual rubber compound — not using generic literature values. The Poisson’s ratio for incompressible fluoroelastomer is set at 0.49 in this analysis. Ask suppliers for the model parameter table and the R² fit quality against physical test data.
Published by sinoraw.com Technical Team | Request a sourcing quote


