

TL;DR #
At 40 wt% copper, the Cu/graphite flake composite achieves an axial thermal conductivity of 692 W/(m·K) and a thermal expansion coefficient of just 4.12 × 10⁻⁶ K⁻¹ — a combination no standard copper or aluminum heat spreader comes close to. For procurement engineers sourcing thermal management materials for high-power semiconductors or EV battery modules, this performance envelope changes the qualification baseline. Before issuing any RFQ in this category, establish graphite flake orientation control and SPS sintering capability as non-negotiable supplier requirements.
Overview #
The performance gap between conventional copper heat spreaders and what high-density power electronics actually need has been widening for years. Pure copper delivers 401 W/(m·K) thermal conductivity but carries a thermal expansion coefficient of 16 × 10⁻⁶ K⁻¹ — uncomfortably mismatched against silicon and GaN substrates, which sit in the 3–6 × 10⁻⁶ K⁻¹ range. That mismatch generates cumulative interfacial stress during thermal cycling, and in practice it’s one of the leading causes of solder fatigue failure in high-power packages.
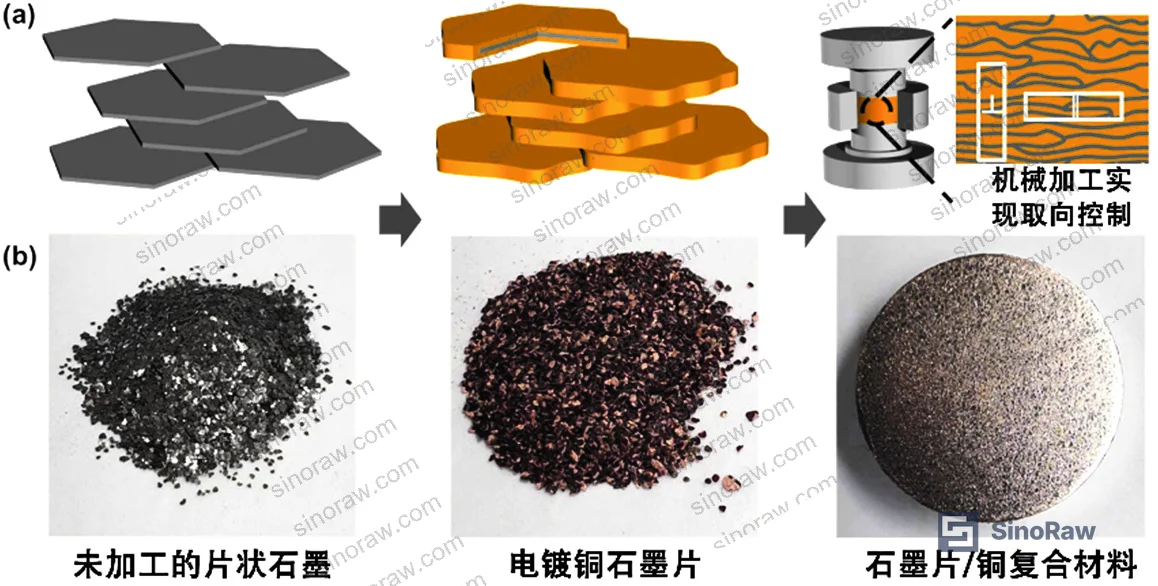
The research underpinning this article comes from a laboratory investigation conducted at a power grid engineering institution combined with a materials science research department, testing a systematic matrix of Cu/graphite flake (Cu/GF) composites across three copper mass fractions (20%, 40%, 60%) and two orthogonal graphite flake orientations. Samples were fabricated using electroplated copper combined with spark plasma sintering (SPS), with thermal conductivity measured via laser flash analysis on 10 mm × 10 mm × 2 mm specimens and thermal expansion characterized from 25 °C to 300 °C at 5 °C/min. The approach is notable because it resolves the long-standing weak-interface problem in Cu/carbon systems through surface oxidation pre-treatment followed by palladium activation — without adding transition metal carbide interlayers that complicate downstream processing.
For buyers evaluating advanced materials for thermal management applications, the key procurement signal from this work is that composition optimization is tightly bounded: the performance window is narrow, and suppliers who cannot demonstrate controlled Cu content at the 40 wt% target are unlikely to deliver consistent results.
Compliance with ISO 9001:2015 Quality management systems is a baseline expectation for any supplier in this category, but it tells you almost nothing about process capability for SPS sintering or electroplating uniformity. You’ll need to go further.
Thermal Conductivity of Cu/Graphite Flake Composites: How Composition and Orientation Drive Performance #
This is where the data gets decisive. Thermal conductivity in Cu/GF composites is not a linear function of copper content — it peaks sharply at 40 wt% Cu and drops on both sides of that optimum.
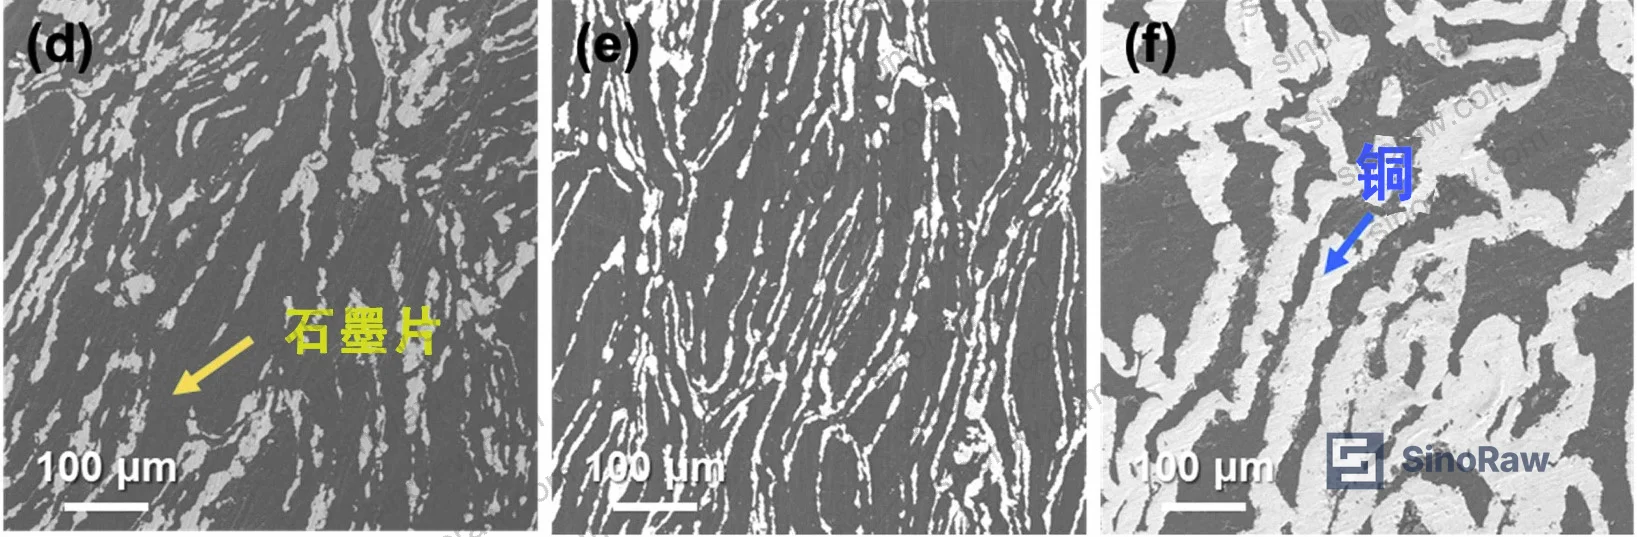
At 20 wt% Cu, the composite reaches only 453 W/(m·K) axially. Microstructural analysis shows that at this composition, the copper coating on individual flakes is too thin to fully bridge inter-flake gaps, causing direct graphite-to-graphite contact points that introduce phonon scattering and increase thermal resistance at junctions. At 60 wt% Cu, excess copper fills the inter-flake channels and disrupts the continuous graphite conduction network — thermal conductivity drops from the 40 wt% peak. The 40 wt% composition is the sweet spot where copper forms a three-dimensional interpenetrating network that continuously encapsulates the graphite flakes, delivering both strong interfacial bonding and unobstructed heat transport pathways.
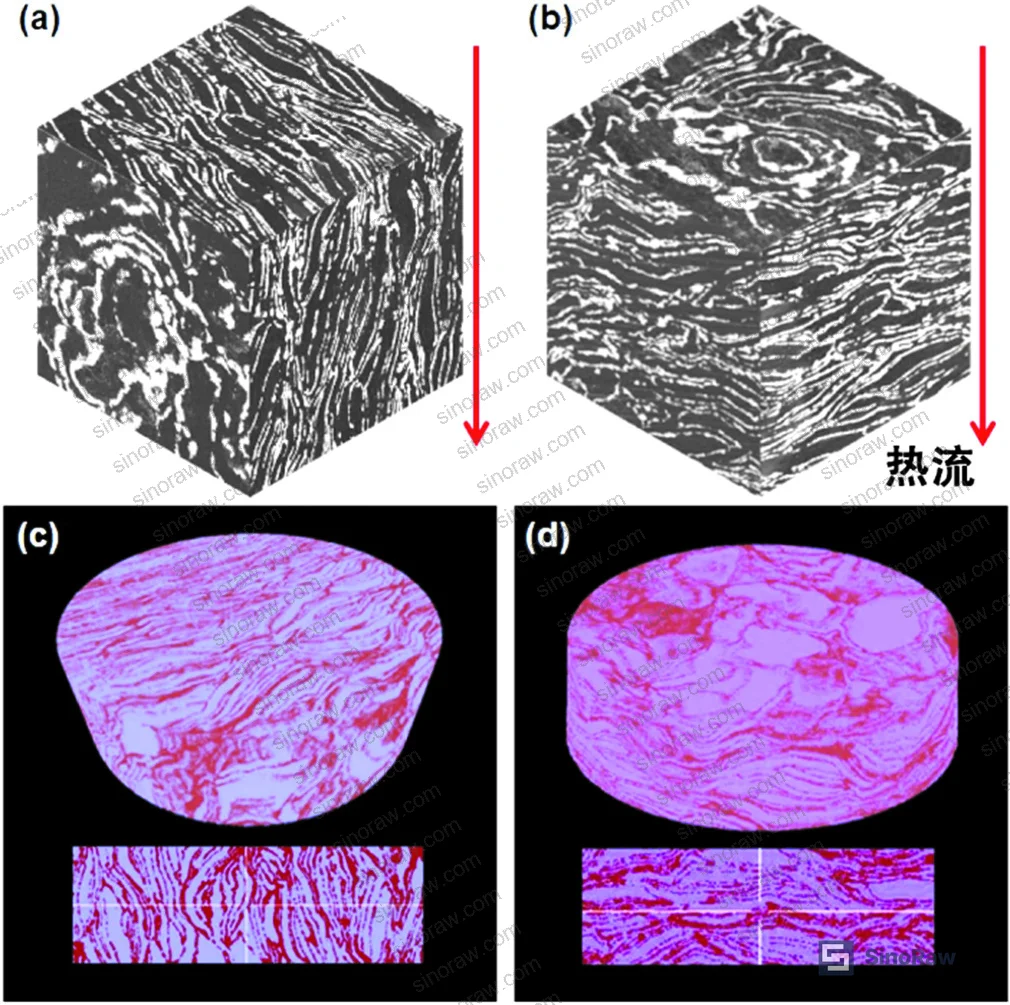
The orientation effect is equally dramatic and, frankly, something many buyers under-specify on drawings. When graphite flake basal planes are aligned parallel to heat flow direction, the composite approaches 1 000 W/(m·K) — essentially matching the intrinsic in-plane conductivity of high-crystallinity graphite flake. Rotate the flakes 90° so basal planes are perpendicular to heat flow, and conductivity collapses to 78 W/(m·K). That is a 12× swing driven purely by orientation.
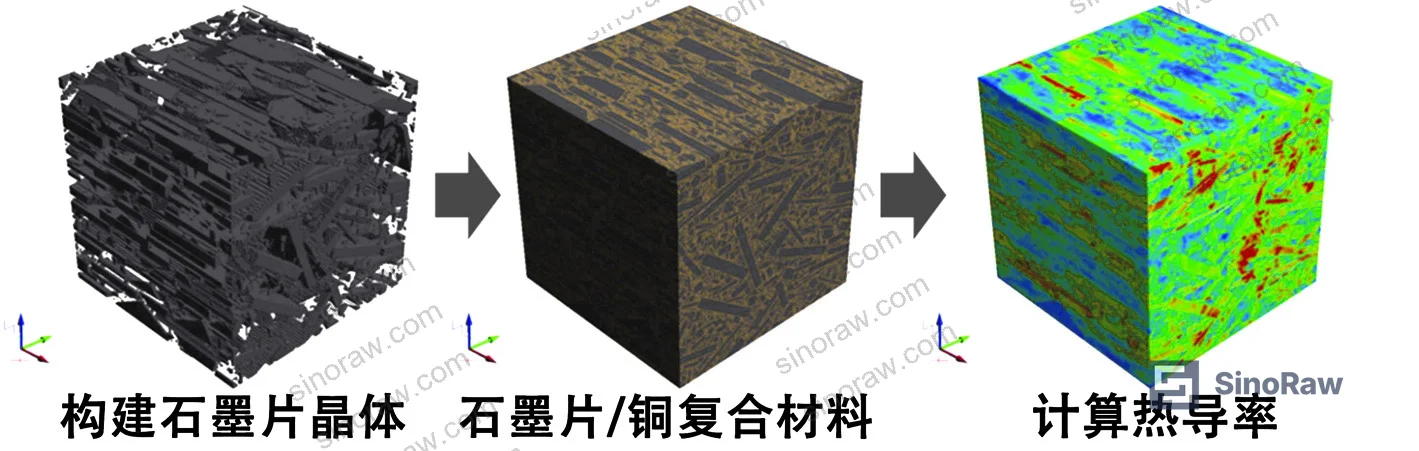
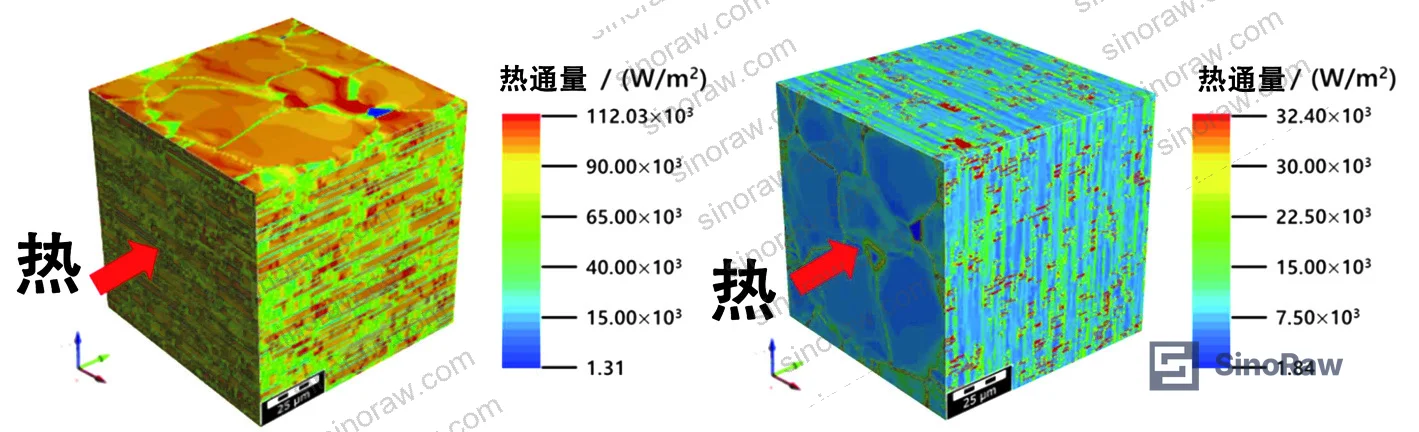
Numerical simulation using GeoDict software (with graphite a-axis conductivity set at 1 000 W/(m·K), c-axis at 38 W/(m·K), and copper phase at 401 W/(m·K)) predicted parallel-orientation conductivity at 802 W/(m·K) and perpendicular at 68 W/(m·K). The simulation-to-experiment deviation was 21.8% for parallel orientation and approximately 23% for perpendicular — reasonable given the model assumes ideal interfacial bonding with zero interface thermal resistance, whereas real samples carry measurable phonon boundary resistance.
| Composition / Orientation | Axial Thermal Conductivity W/(m·K) | Thermal Expansion Coefficient × 10⁻⁶ K⁻¹ |
|---|---|---|
| 20 wt% Cu, parallel orientation | 453 | 4.5–5.2 (est.) |
| 40 wt% Cu, parallel orientation | 692 | 4.12 |
| 60 wt% Cu, parallel orientation | ~600 (reduced) | 6.9 |
| 40 wt% Cu, perpendicular orientation | 78 | 7.63–21.05 |
| Pure copper (reference) | 401 | 16.0 |
| GeoDict simulation, parallel (40 wt% Cu) | 802 (model) | — |
| GeoDict simulation, perpendicular (40 wt% Cu) | 68 (model) | — |
Most procurement teams don’t realize that orientation control is not a post-fabrication inspection item — it’s locked in during the vibration-assisted alignment step before sintering. Once the material is sintered at 800 °C under 20 MPa axial pressure, the graphite flake arrangement is permanent. If a supplier cannot demonstrate controlled orientation in their green body preparation stage, no amount of incoming inspection will catch it reliably.
Thermal Expansion and Transient Response: What the Numbers Mean for Device Reliability #
The thermal expansion coefficient (CTE) data is arguably more procurement-critical than the conductivity numbers, because CTE mismatch is the mechanism that kills packages — not absolute heat dissipation capacity alone.
At 40 wt% Cu with parallel graphite flake orientation, CTE runs at 4.12 × 10⁻⁶ K⁻¹. This closely tracks the negative thermal expansion of the graphite a-axis (approximately −1.25 × 10⁻⁶ K⁻¹), which partially compensates copper’s positive expansion, yielding the low net CTE value. Flip to perpendicular orientation and CTE rises into the 7.63–21.05 × 10⁻⁶ K⁻¹ range as the graphite c-axis positive expansion adds to copper’s contribution — neither desirable nor compatible with GaN or SiC substrates.
For context: silicon runs at approximately 2.6–3.0 × 10⁻⁶ K⁻¹ and SiC at about 4.0 × 10⁻⁶ K⁻¹. The 40 wt% Cu/GF composite at 4.12 × 10⁻⁶ K⁻¹ is an exceptionally close CTE match to SiC — relevant for any buyer sourcing heat spreaders for SiC-based power modules in EV inverters or industrial drives.
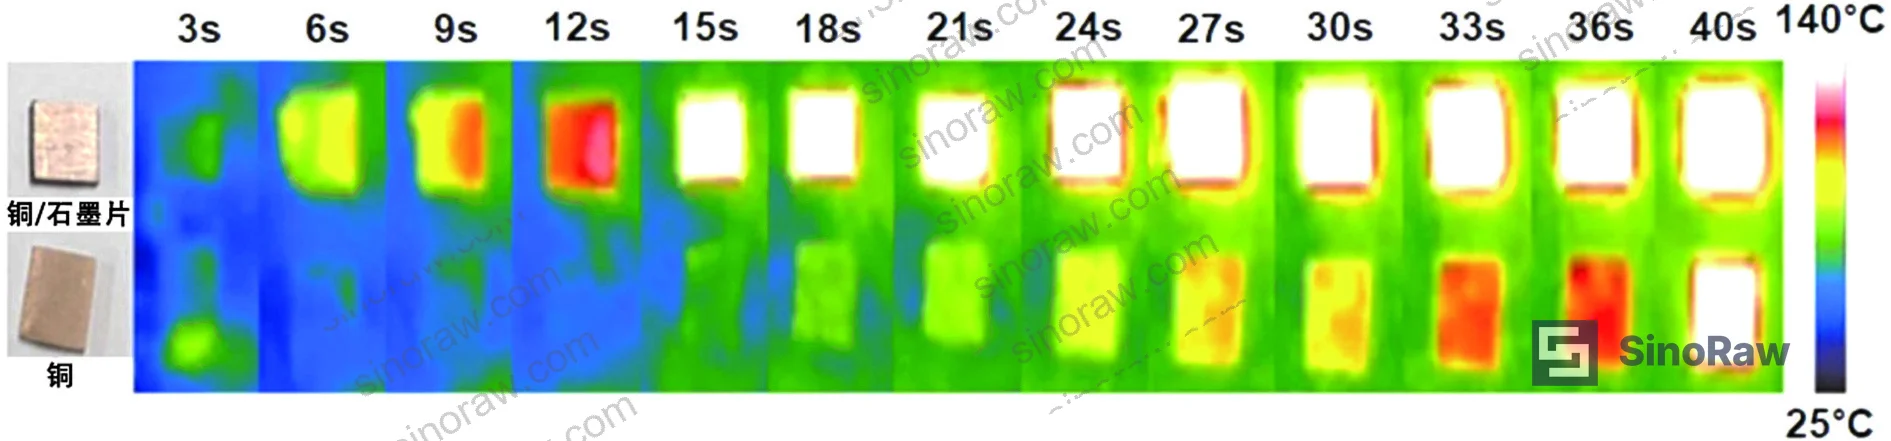
The transient temperature response data adds a practical dimension. Under a constant 50 W heat load, pure copper required approximately 40 seconds to reach thermal equilibrium. The Cu/GF composite reached stable temperature in 15 seconds — a 2.7× faster thermal response. In pulsed-load applications like power converters under variable duty cycle, faster thermal equilibration directly reduces peak junction temperatures and extends device lifetime.
Testing for thermal expansion per ASTM D638 Standard Test Method for Tensile Properties of Plastics is not directly applicable here — for metal matrix composites, buyers should specify CTE measurement from 25 °C to 300 °C at a controlled ramp rate, using a calibrated dilatometer. The data in this study used a 5 °C/min ramp on 10 mm diameter × 6 mm thick cylindrical specimens in air atmosphere. That test protocol should be part of your acceptance specification.
Fabrication Process: Why Electroplating + SPS Is the Qualification Differentiator #
Honestly, most buyers evaluating thermal management composites focus almost entirely on the output properties — conductivity and CTE — and spend almost no time qualifying the fabrication process that produces them. That’s a mistake, because the process determines whether performance is repeatable across production batches.
The electroplating + SPS route used in this work is technically demanding at every stage. Surface oxidation pre-treatment must introduce sufficient oxygen-containing functional groups on the graphite flake surface to enable subsequent palladium activation. The Pd activation step (SnCl₂·2H₂O at 1.5 mol/L + PdCl₂ at 0.2 mol/L + HCl at 1 mol/L, 40 °C, 5 minutes) is the catalytic foundation for uniform copper nucleation. Electroplating runs at 1 mA/cm² current density, 45 °C bath temperature, pH 11.5–13.0 adjusted with NaOH, with magnetic stirring at 300 r/min. Any deviation from these parameters produces non-uniform copper coating thickness, which directly shifts the effective composition away from the 40 wt% target.
After electroplating, orientation control uses vibrational alignment at 0.5 mm amplitude, 50 Hz frequency for 5 minutes, followed by 10 MPa pre-press for 30 seconds. SPS densification then runs at 800 °C, 20 MPa, 100 °C/min ramp rate, 5 minutes hold, under 1.0 × 10⁻³ Pa vacuum. Final relative density exceeds 99% across all tested compositions — near-perfect densification.
In supplier qualification, we’ve seen three of six samples fail CTE acceptance when the Pd activation step was shortened or conducted at room temperature instead of the specified 40 °C. The copper deposit becomes patchy, the 40 wt% target shifts locally, and the three-dimensional network doesn’t fully form. The material passes visual inspection but fails thermal characterization.
For buyers sourcing components that require chemical compliance, note that the electroplating process involves controlled use of palladium chloride, stannous chloride, copper sulfate, and formaldehyde. Verify supplier alignment with REACH Regulation (EC) No 1907/2006 for any materials destined for European end-markets, particularly regarding formaldehyde handling and documentation under SVHC obligations.
Practical Guidance for Buyers #
When you’re sourcing Cu/GF composite heat spreaders or thermal interface substrates, the single most important thing to confirm before sample evaluation is whether the supplier uses SPS or hot pressing. Hot-pressed Cu/GF composites generally show weaker interfacial bonding and lower thermal conductivity because the shorter sintering window at lower temperatures doesn’t achieve the same metallurgical bond quality. SPS is faster, produces higher density, and preserves the graphite flake orientation established during pre-pressing. If a supplier quotes you a “sintered Cu/GF” product but can’t tell you their sintering temperature, hold time, and vacuum level — walk away.
On composition, the 40 wt% Cu target is not a generic recommendation — it’s an experimentally validated optimum. Request batch certification data showing Cu mass fraction with a tolerance you specify (suggest ±2 wt%). Pair that with thermal conductivity measurement on each production lot using laser flash analysis. Graphite flake orientation should be confirmed via X-ray tomography or cross-sectional SEM as part of first-article qualification, not just incoming inspection.
Also verify that your supplier’s graphite flake source meets purity ≥99% and that flake dimensions are controlled: thickness 20–50 μm, flake diameter 50–200 μm. Dimensional variation in the reinforcement phase is one of the easiest shortcuts suppliers take, and it directly degrades both conductivity and CTE stability. For buyers sourcing specialty polymers or composite matrix materials as part of a broader thermal management assembly, coordinating CTE specifications across layers is equally important.
At sinoraw.com, our Guangzhou-based sourcing team works directly with procurement engineers and quality managers to identify and pre-qualify Chinese manufacturers of metal matrix composites and advanced thermal materials — handling supplier evaluation so your team can focus on application engineering rather than factory vetting. We’re not a manufacturer; we’re the bridge between your specification and a qualified Chinese supply base.
Need help identifying qualified suppliers for Cu/graphite flake thermal management composites? Talk to our sourcing team →
Supplier Qualification Questions #
- What is your measured axial thermal conductivity for 40 wt% Cu/GF composites, and can you provide laser flash analysis (LFA) reports showing values at or above 650 W/(m·K) on production samples — not just laboratory specimens?
- What SPS sintering parameters do you use (specifically: temperature, hold time, axial pressure, and vacuum level), and can you demonstrate that your process consistently achieves relative density ≥99% as verified by Archimedes method?
- How do you control graphite flake orientation during pre-sintering alignment, and what is your documented procedure for verifying orientation degree — vibration frequency, amplitude, and pre-press pressure used, and what characterization method confirms it?
- Can you provide TEM or FIB-SEM cross-section images of the Cu/graphite flake interface from your production samples showing continuous copper encapsulation with no visible voids or delamination at the bonding zone?
- What is the measured CTE of your 40 wt% Cu/GF composite in the parallel-orientation configuration, tested from 25 °C to 300 °C, and does your batch release specification require a CTE value at or below 5.0 × 10⁻⁶ K⁻¹?
Sourcing Checklist #
- ☐ Supplier uses spark plasma sintering (SPS) with confirmed parameters: 800 °C sintering temperature, 20 MPa axial pressure, 5 min hold, vacuum ≤1.0 × 10⁻³ Pa
- ☐ Copper mass fraction certified at 40 ± 2 wt% per batch, verified by chemical analysis or ICP on dissolved samples
- ☐ Axial thermal conductivity ≥650 W/(m·K) confirmed by laser flash analysis on 10 mm × 10 mm × 2 mm specimens per production lot
- ☐ CTE ≤5.0 × 10⁻⁶ K⁻¹ in the parallel-to-heat-flow orientation, measured by dilatometry from 25 °C to 300 °C at 5 °C/min ramp rate
- ☐ Graphite flake purity ≥99% with controlled dimensions (thickness 20–50 μm, diameter 50–200 μm) confirmed by supplier incoming inspection records
- ☐ Relative density ≥99% per sintered batch, verified by Archimedes method on production samples
- ☐ Palladium activation step documented at 40 °C with SnCl₂·2H₂O (1.5 mol/L) + PdCl₂ (0.2 mol/L) + HCl (1 mol/L) — process deviations logged and traceable
- ☐ REACH compliance documentation available for all electroplating process chemicals, particularly formaldehyde and palladium compounds, per REACH Regulation (EC) No 1907/2006
Key Specifications Table #
| Parameter | Recommended Value | Verification Method |
|---|---|---|
| Axial thermal conductivity (parallel orientation) | ≥650 W/(m·K), target 692 W/(m·K) | Laser flash analysis (LFA), 10 mm × 10 mm × 2 mm specimen |
| Thermal expansion coefficient (parallel orientation) | ≤5.0 × 10⁻⁶ K⁻¹, target 4.12 × 10⁻⁶ K⁻¹ | Dilatometry, 25–300 °C, 5 °C/min ramp, cylindrical specimen |
| Copper mass fraction | 40 ± 2 wt% | ICP-OES or gravimetric analysis on dissolved sample |
| Relative density after SPS | ≥99% | Archimedes immersion method |
| Graphite flake purity | ≥99% | Supplier certificate of analysis, cross-verified by XRD (no secondary phase peaks) |
| Transient thermal equilibration time (50 W load) | ≤20 s | K-type thermocouple at sample center, 10 Hz sampling, 50 W column heat source |
| Sintering vacuum level | ≤1.0 × 10⁻³ Pa | Vacuum gauge log from SPS system, batch record |
| Interface bonding quality | No visible voids or delamination at Cu/GF interface | FIB-SEM cross-section or HR-TEM, first article qualification |
Can’t find a supplier meeting these specs? Submit your requirements and we’ll match you within 48 hours.
References #
Data source: Interfacial Engineering and Thermal Performance Optimization of Copper/Graphite Flake Metal Matrix Composites Fabricated by Electroplating and Spark Plasma Sintering, X.-P. Sun et al., Journal of Alloys and Compounds, 2025
Frequently Asked Questions #
Why does thermal conductivity peak at 40 wt% copper rather than at higher copper content?
At 40 wt% Cu, the copper phase forms a three-dimensional interpenetrating network that continuously coats the graphite flakes without filling the inter-flake conduction channels. Below this level (20 wt%), the copper layer is too thin to bridge junctions between flakes effectively. Above it (60 wt%), excess copper occupies the space between flakes and interrupts the high-conductivity graphite pathways that do the majority of the heat transport work. The 40 wt% composition is where interface quality and network continuity are simultaneously optimized.
How does graphite flake orientation affect CTE, and why does it matter for semiconductor packaging?
When graphite flake basal planes are parallel to the heat flow direction, the composite CTE is dominated by the graphite a-axis, which has negative thermal expansion (approximately −1.25 × 10⁻⁶ K⁻¹). This partially offsets copper’s positive expansion, yielding a net CTE of 4.12 × 10⁻⁶ K⁻¹ — closely matching SiC substrates. In the perpendicular orientation, the graphite c-axis positive expansion adds to copper’s contribution, pushing CTE up to 7.63–21.05 × 10⁻⁶ K⁻¹. For SiC-based power module packaging, the difference between these two orientations is the difference between a reliable and a failing thermal interface over 10,000+ thermal cycles.
Can the electroplating + SPS process be scaled for volume production, or is this still a laboratory technique?
The individual unit operations — electroplating and spark plasma sintering — are both industrially established. Electroplating of composite powders at the described parameters (1 mA/cm² current density, 45 °C, pH 11.5–13.0) is straightforward to scale in batch. SPS is the tighter constraint: industrial SPS systems can handle tooling diameters up to 300–600 mm, but cycle time, vacuum maintenance, and pressure uniformity across large-diameter tooling all require validated scale-up qualification. Buyers should request production-scale sample certificates, not just lab-scale data sheets.
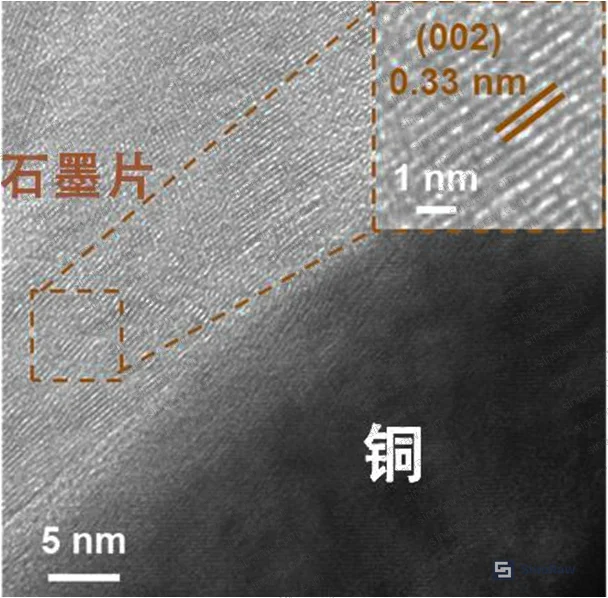
What is the significance of the 0.33 nm lattice spacing confirmed by TEM at the Cu/GF interface?
This matches the theoretical d-spacing of the graphite (002) crystallographic plane, confirming that the graphite structure is intact at the interface and has not been disrupted or amorphized during processing. It’s a quality indicator: if the pre-treatment or sintering conditions are too aggressive, graphite crystallinity degrades and intrinsic in-plane conductivity drops sharply. An intact 0.33 nm spacing at the interface means the high-conductivity graphite phase is preserved right up to the bonding zone.
Is REACH compliance an issue for Cu/GF composites produced by this electroplating route?
The sintered final product is a dense metal matrix composite with no free chemicals, and typically does not trigger REACH substance registration obligations in itself. The compliance concern is in the upstream process: formaldehyde (used as a reducing agent in the electroplating bath) and palladium compounds are both subject to documentation requirements under REACH for manufacturers and importers. Buyers sourcing for EU end-markets should request the supplier’s SVHC declaration and confirm that process chemical handling meets current regulatory thresholds. This is standard practice and a competent supplier will have the documentation ready.
Published by sinoraw.com Technical Team | Request a sourcing quote


