

TL;DR #
Fluid-structure interaction simulation of a 12-tonne double-acting hydraulic pile driver shows that increasing O-ring compression ratio from 10% to 25% reduces maximum Von Mises stress by 22.45% and minimum stress by 97.32%, while increasing pipe wall thickness from 4 mm to 10 mm reduces maximum strain by 17.90%. For buyers sourcing hydraulic sealing components for high-impact applications, compression ratio is the dominant design lever — not material hardness alone. Specify compression ratio range (15–25%) and wall thickness in your RFQ, not just cross-section diameter.
Overview #
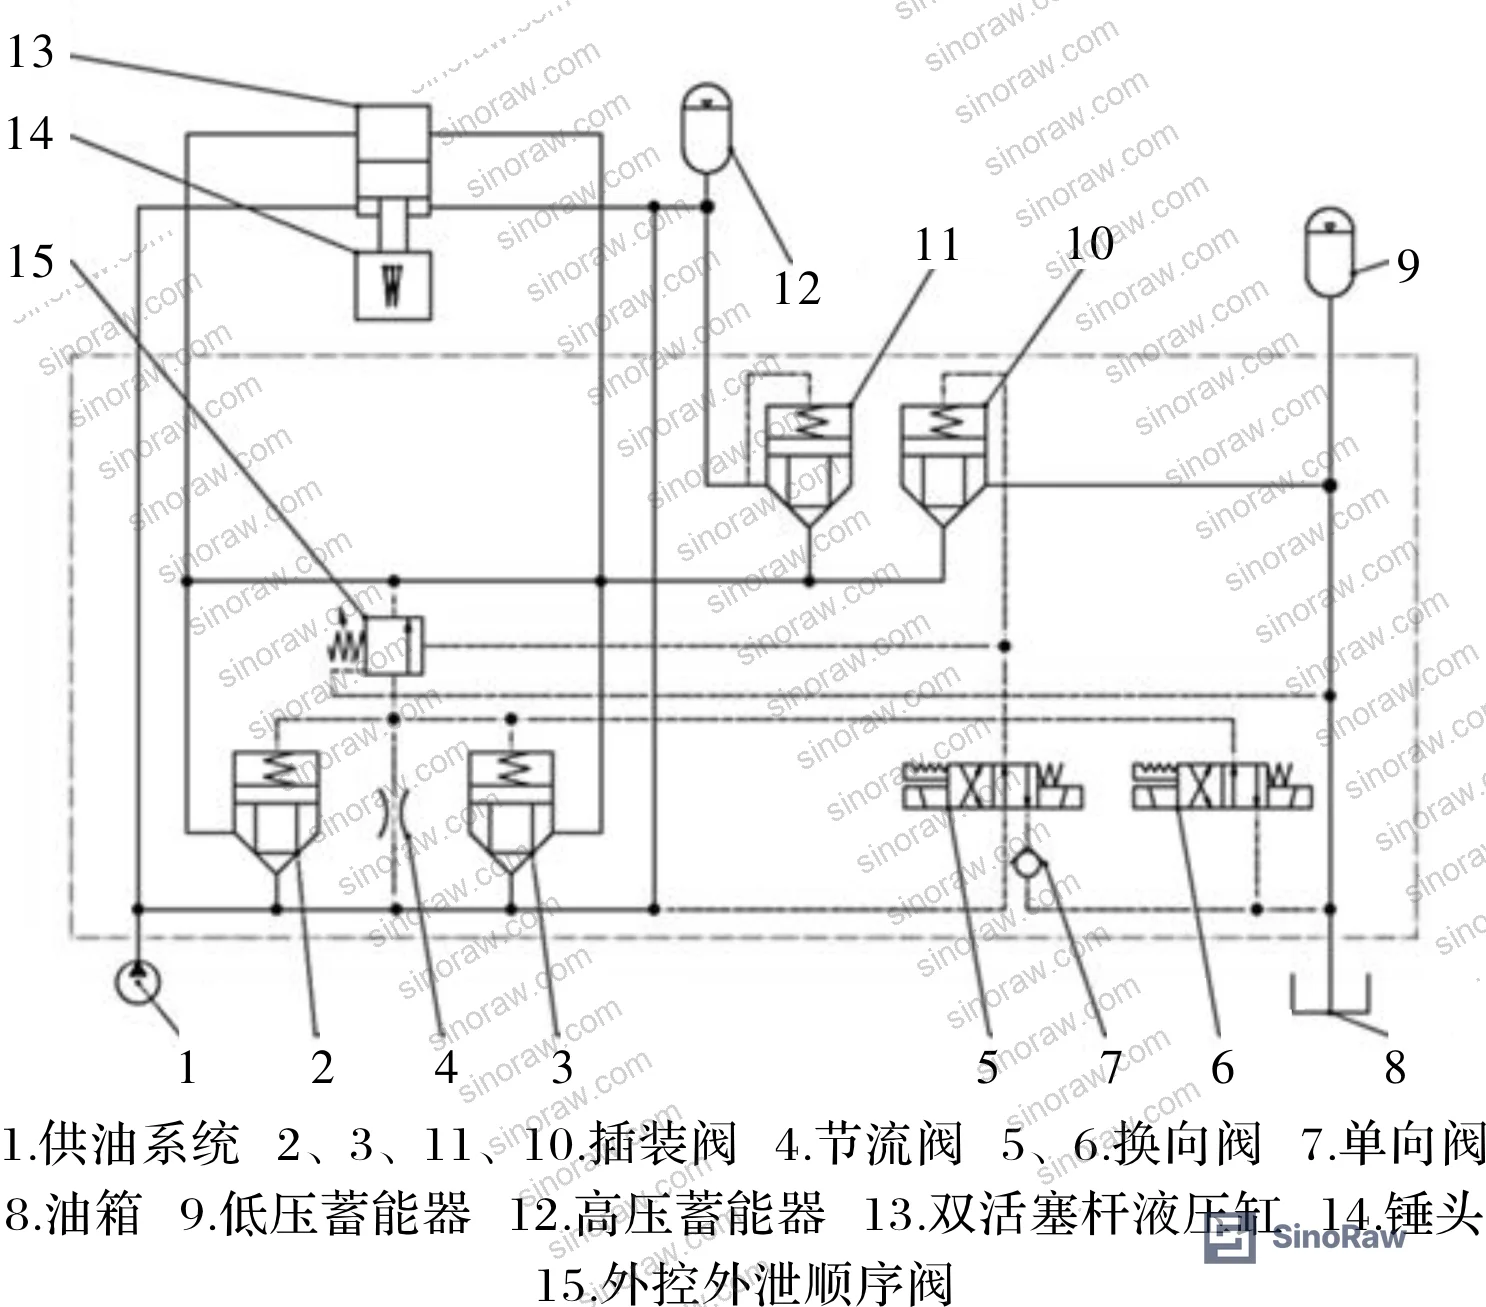
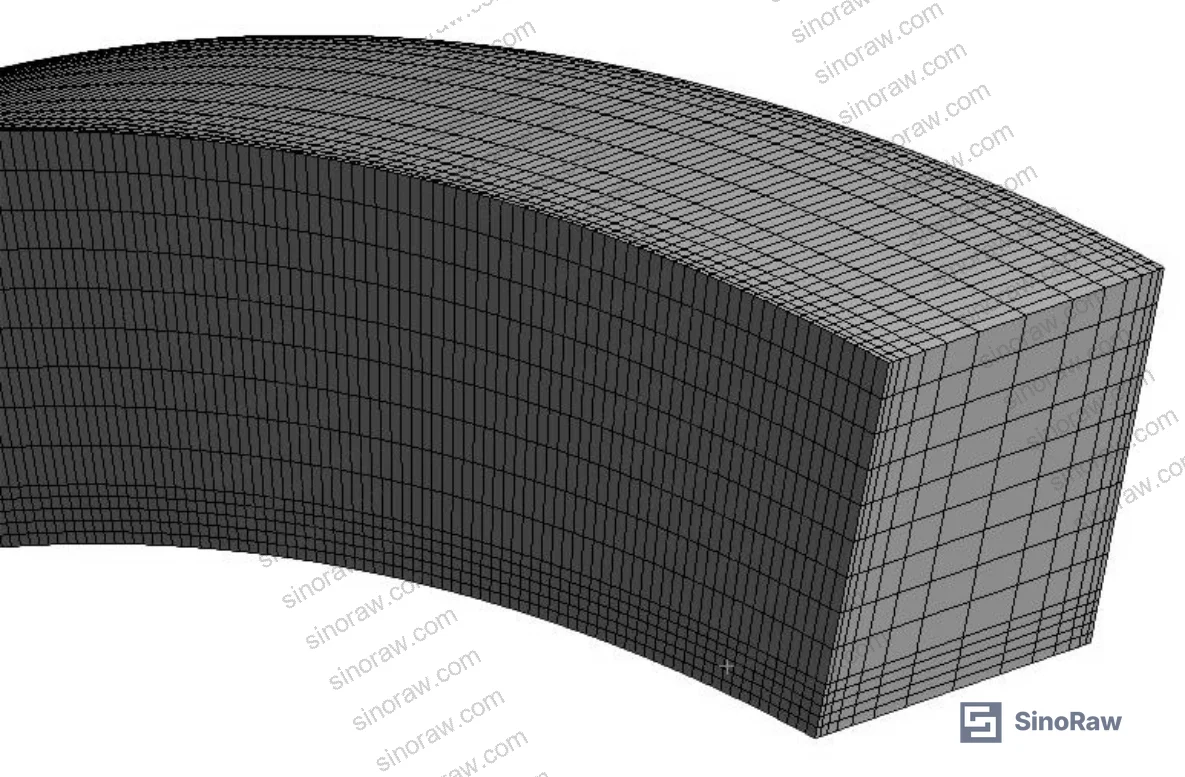
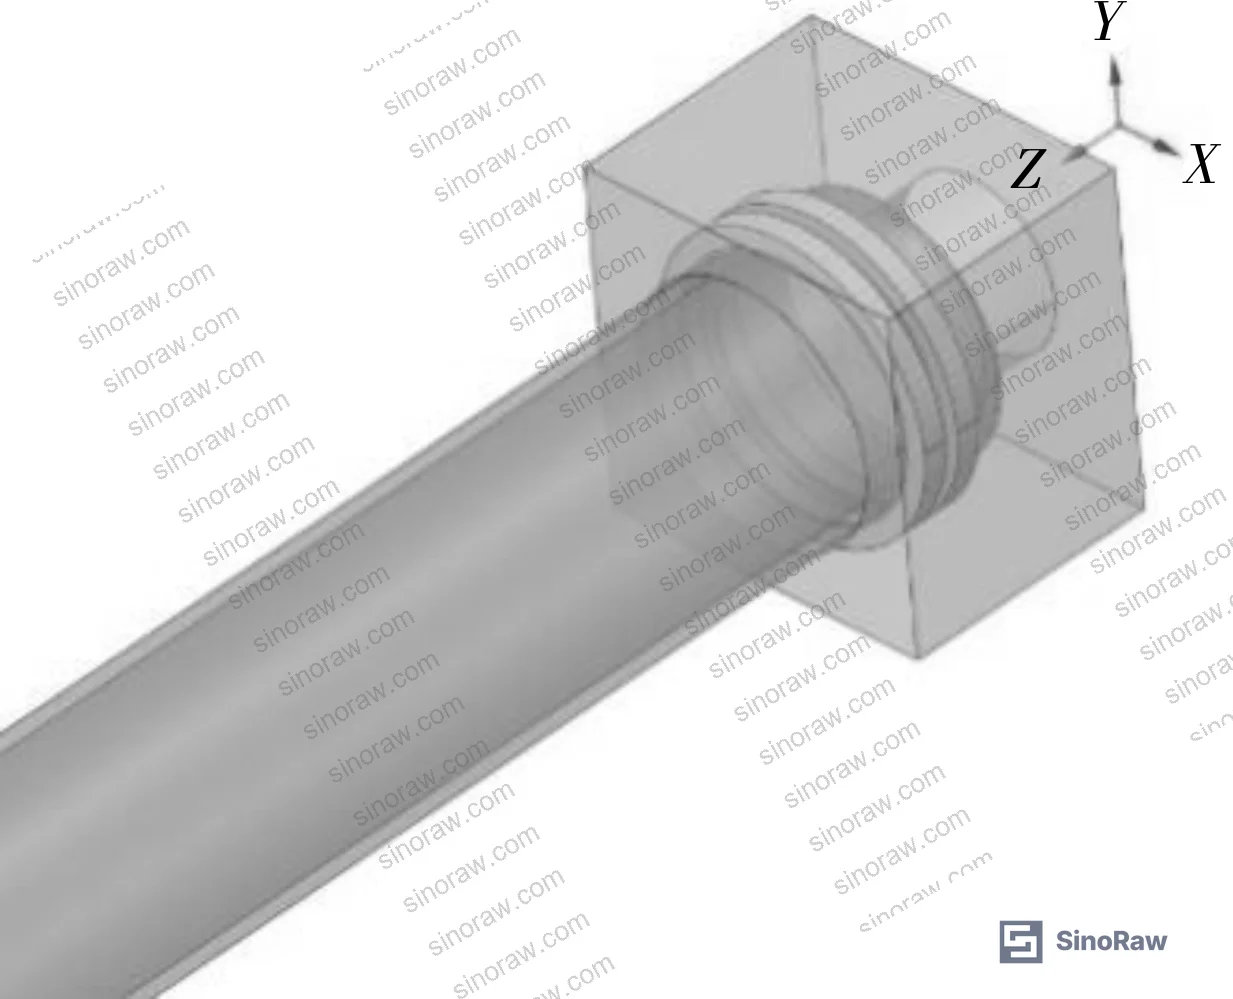
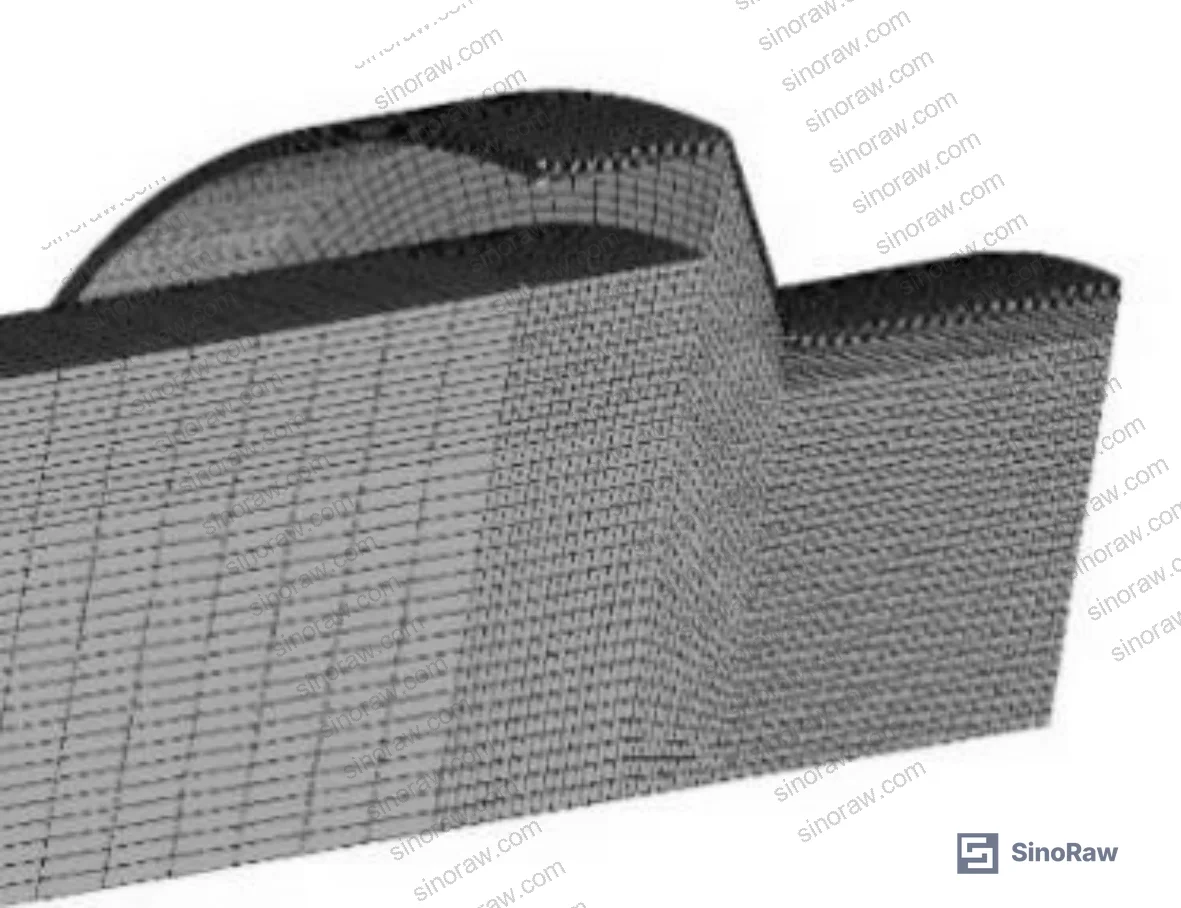
Most procurement teams treat O-ring selection as a commodity decision — pick the right cross-section, confirm the material, move on. That approach fails in high-pressure dynamic environments, and the failure mode is expensive: hydraulic fluid leakage under impact loading that wasn’t caught during static seal qualification. Fluid-structure interaction (FSI) analysis conducted at a Chinese mechanical engineering research institution on a production-representative 12-tonne double-acting hydraulic system — using a 215,822-element mesh with 81.2% of elements achieving quality scores above 0.9 — makes the failure mechanism quantitatively clear. The simulation modeled transient pressure events across the O-ring coupling surface, solving for Von Mises stress and elastic strain at peak stress moments under operating hydraulic fluid conditions (density 850 kg/m³, dynamic viscosity 0.048 kg/(m·s), inlet velocity 6.9 m/s).
The core finding is structural: compression ratio and pipe wall thickness are the two controllable parameters that govern seal integrity under hydraulic shock, and their effects are measurable, not estimated. For buyers sourcing sealing and thermal components or pump and valve seals for demanding hydraulic applications, understanding these parameters separates a durable specification from one that will leak in the field.
O-Ring Compression Ratio: The Parameter That Actually Controls High-Pressure Seal Performance #
Standard O-ring installation practice specifies a radial compression range of 10–25%, and most buyers treat anything within that band as acceptable. The simulation data says otherwise — position within that band has a dramatic effect on stress and strain distribution under dynamic loading.
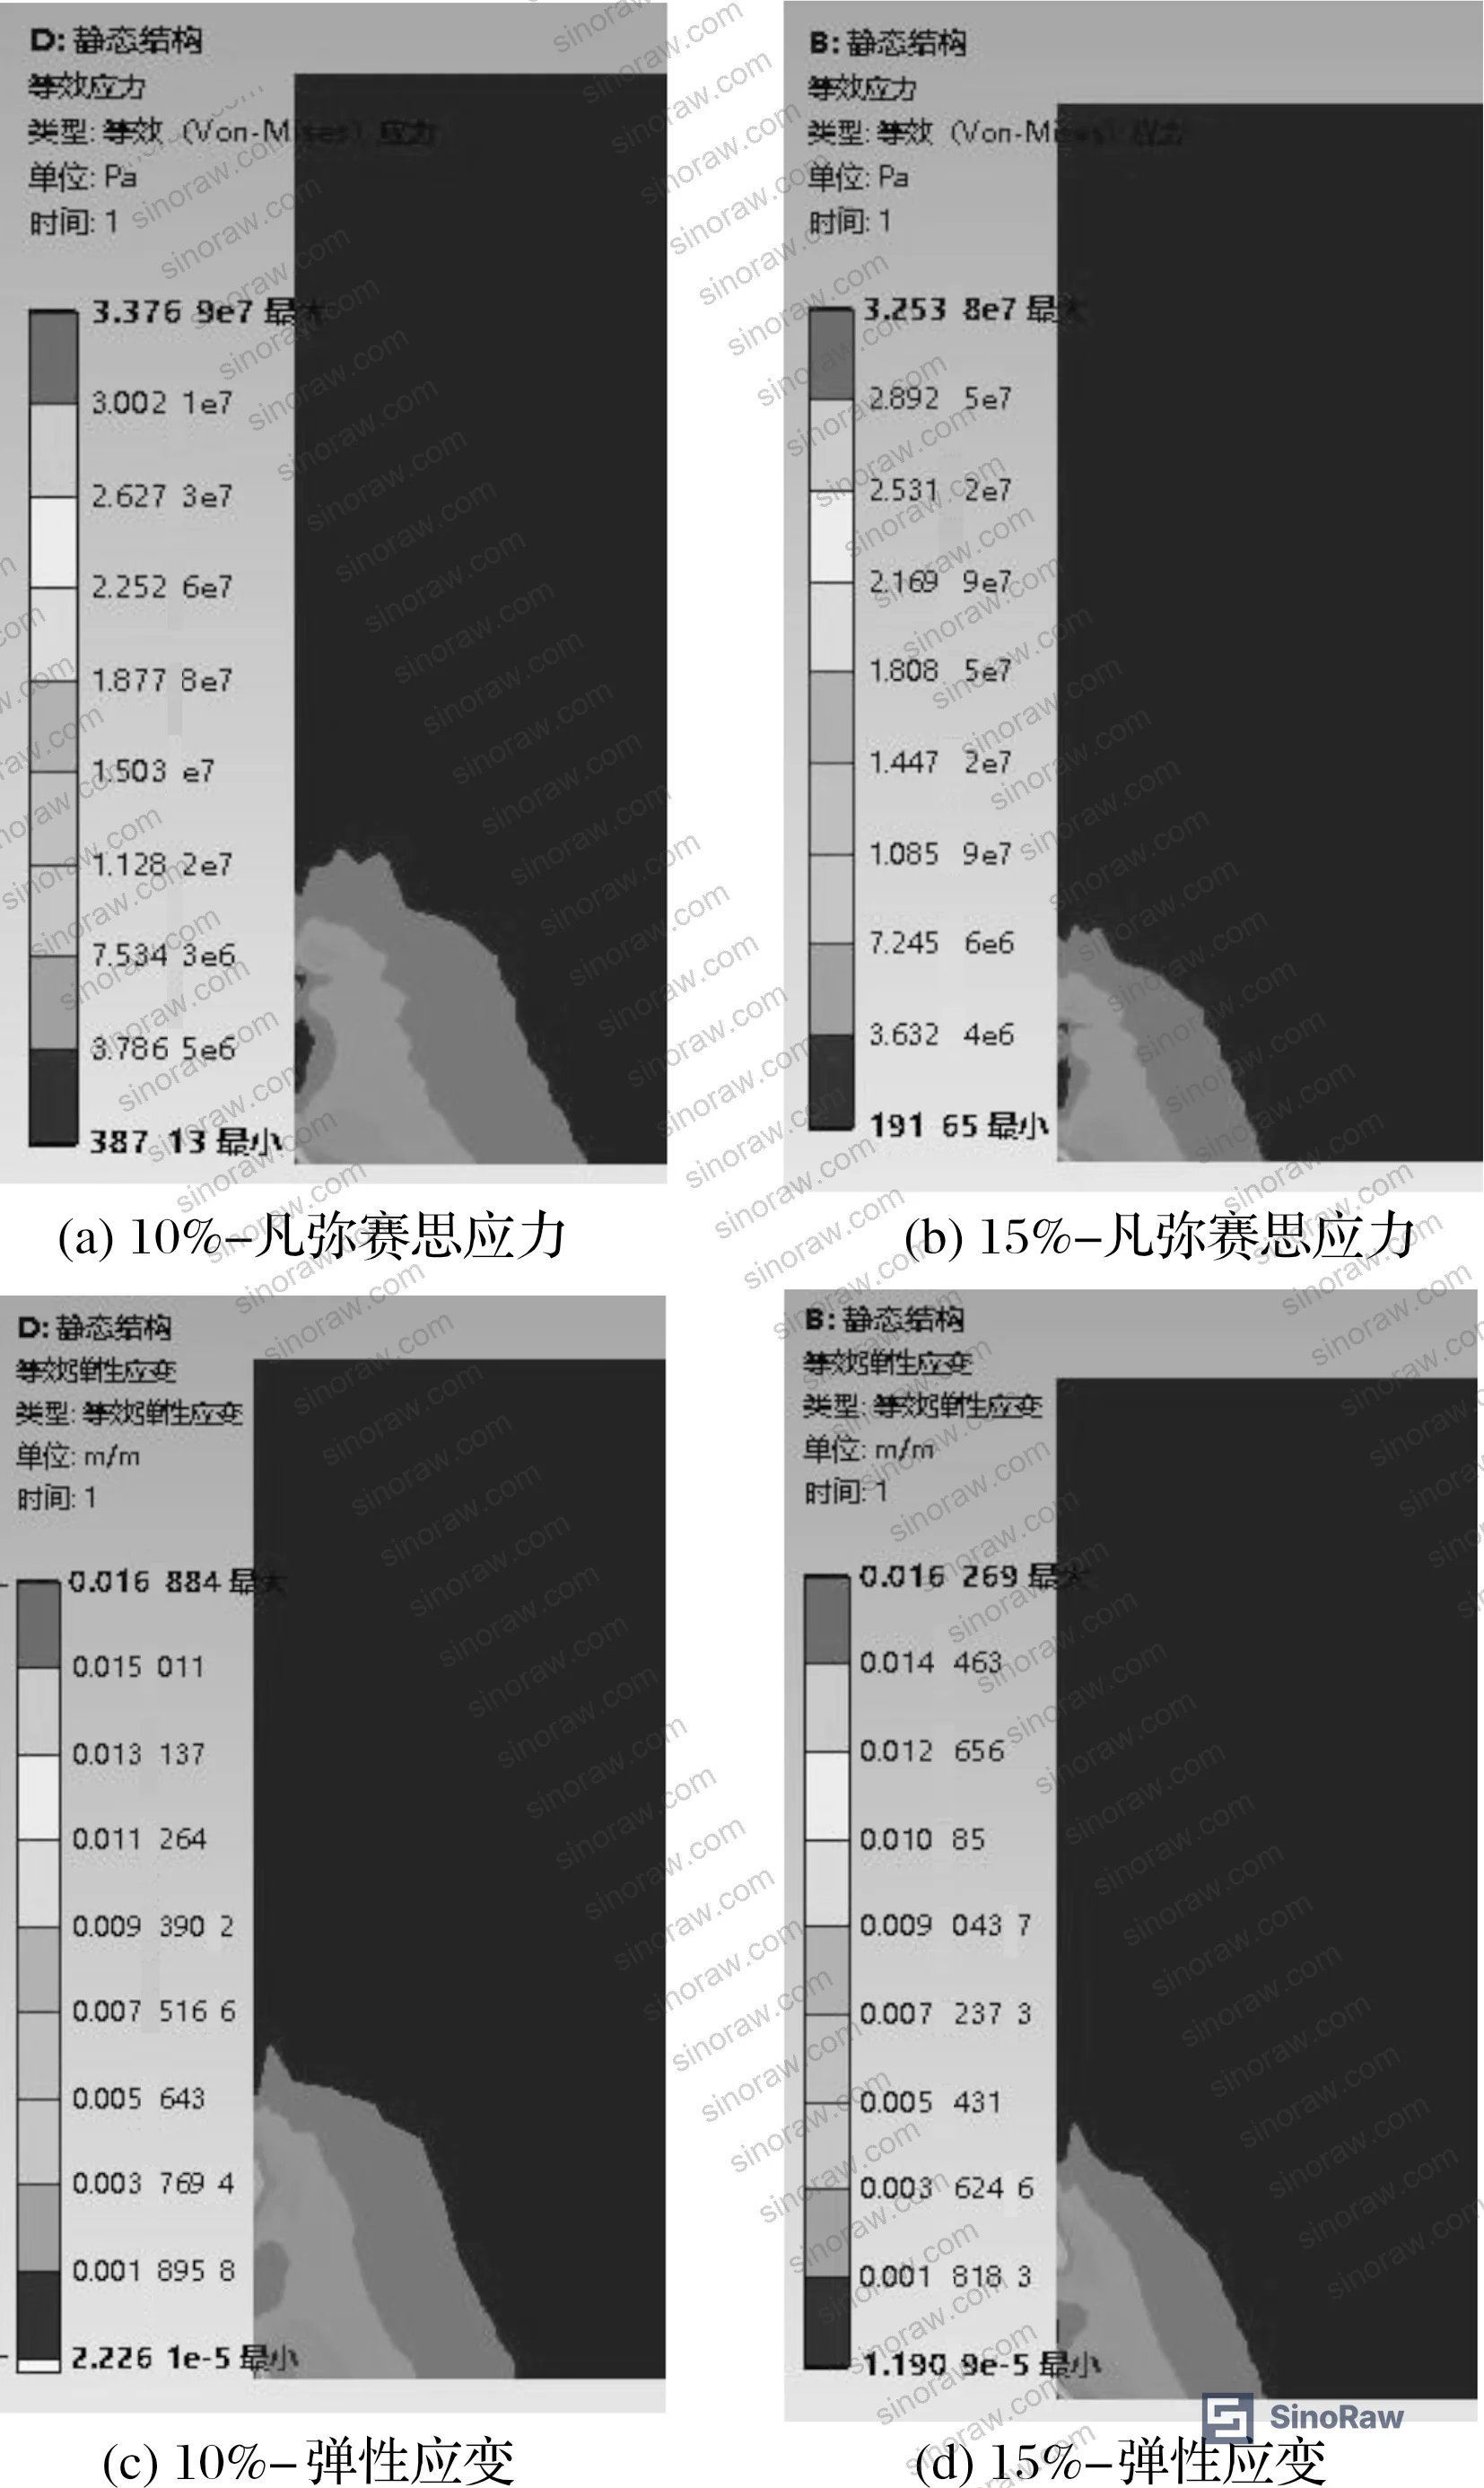
The FSI analysis separated two mechanisms: the effect of initial deformation from compression alone, and the effect of gap geometry on hydraulic fluid pressure acting on the O-ring surface. At 10% compression, maximum Von Mises stress measured 3.37×10⁷ Pa and maximum elastic strain reached 1.68×10⁻². At 25% compression, those values dropped to 2.33×10⁷ Pa and 1.17×10⁻² respectively. The minimum stress reduction is even more striking — from 3.87×10⁴ Pa at 10% compression down to 1.04×10³ Pa at 25%, a reduction of 97.32%. Minimum strain dropped 97.52% across the same range.
| Compression Ratio | Max Von Mises Stress (Pa) | Min Stress (Pa) | Max Strain (m/m) | Min Strain (m/m) |
|---|---|---|---|---|
| 10% | 3.37×10⁷ | 3.87×10⁴ | 1.68×10⁻² | 2.22×10⁻⁵ |
| 15% | 3.25×10⁷ | 1.92×10⁴ | 1.62×10⁻² | 1.19×10⁻⁵ |
| 20% | 2.89×10⁷ | 6.05×10³ | 1.29×10⁻² | 3.60×10⁻⁶ |
| 25% | 2.33×10⁷ | 1.04×10³ | 1.17×10⁻² | 5.51×10⁻⁷ |
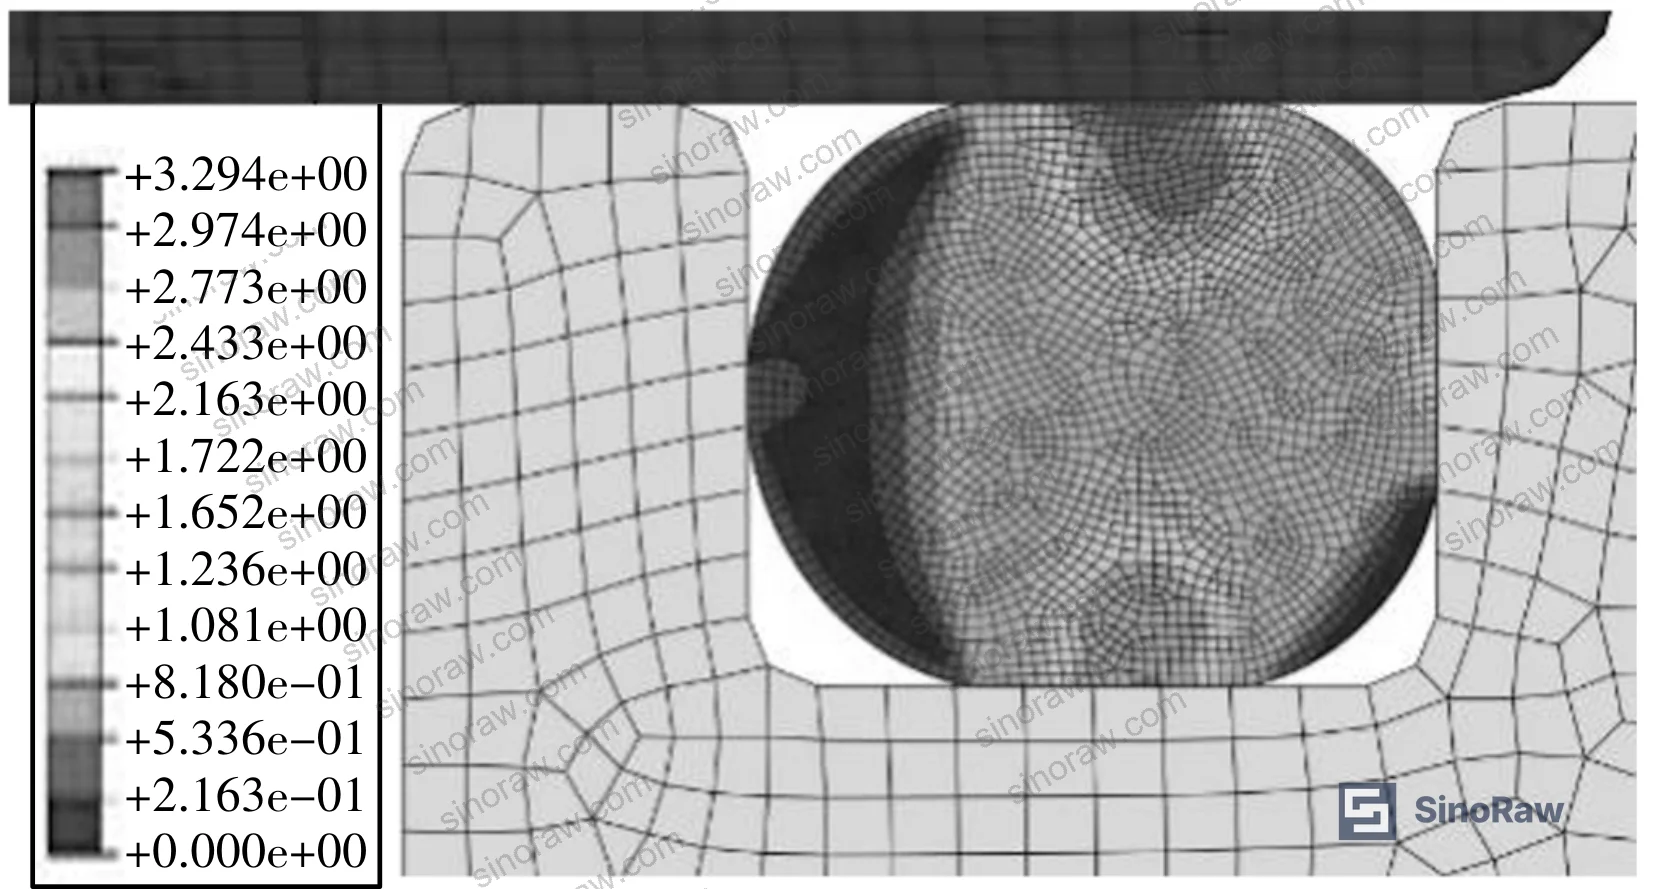
The mechanism is counterintuitive. Higher compression reduces the gap between the O-ring and pipe wall, which changes the hydraulic fluid flow regime around the seal. Under high-pressure impact, it’s the fluid pressure acting on the O-ring surface — not just the mechanical squeeze — that drives stress peaks. Reducing that gap reduces the fluid’s leverage on the seal face. At the same time, higher compression distributes initial deformation more uniformly, lowering stress concentrations.
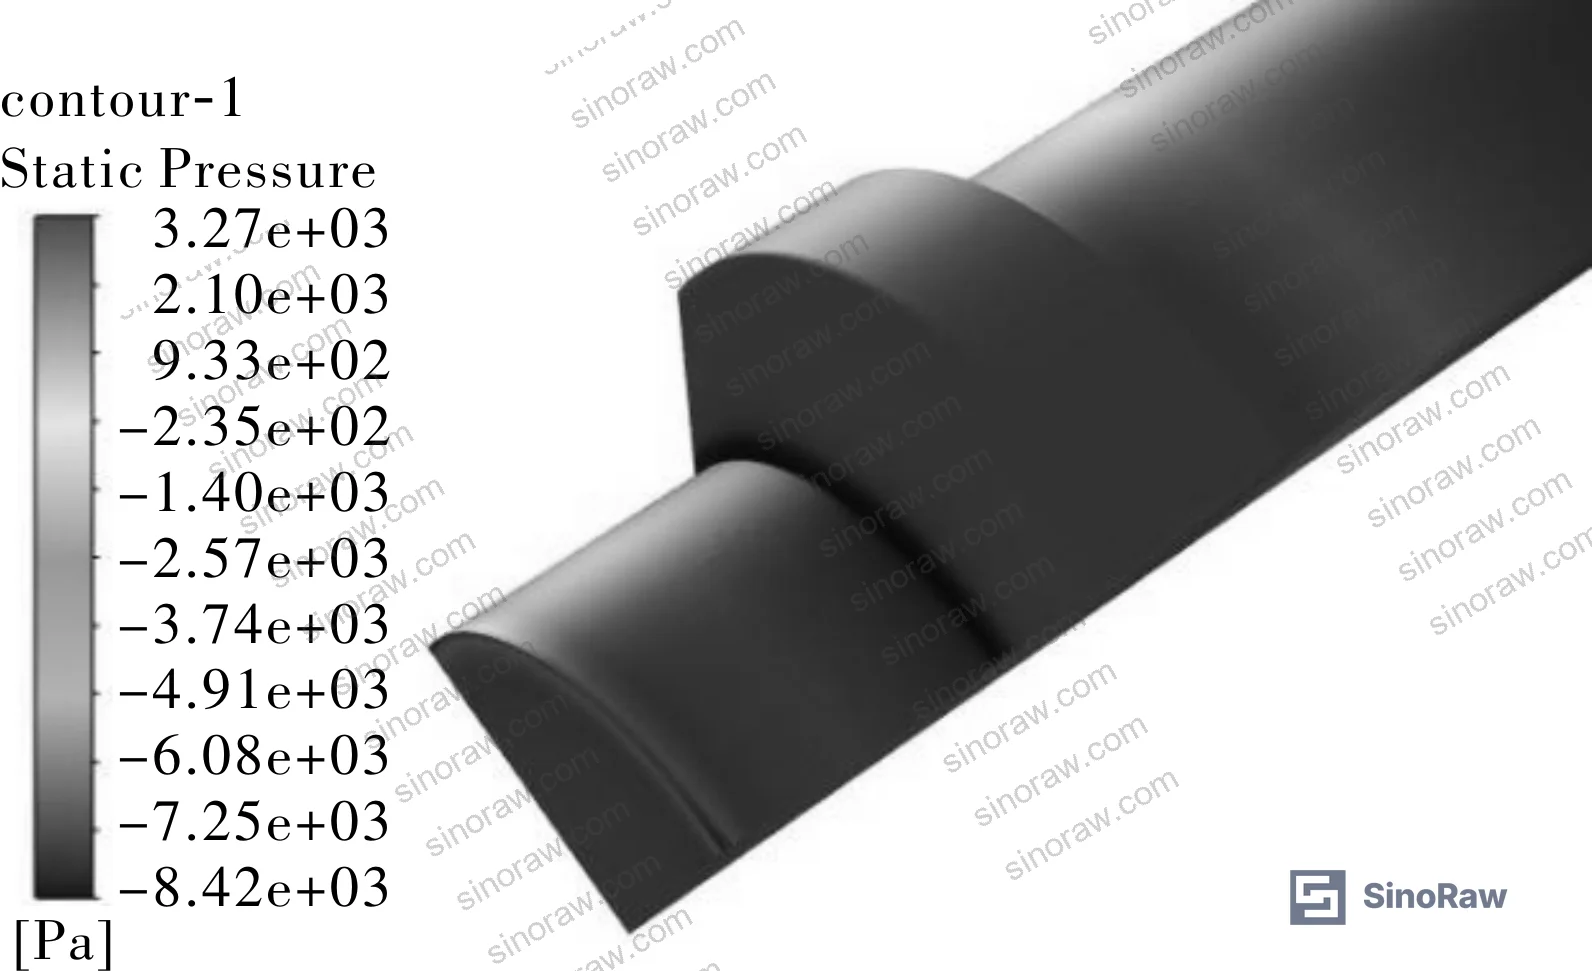
The fluid pressure differential across the coupling surface at baseline conditions (10% compression, 4 mm wall) measured 13,402.3 Pa — small in absolute terms, but directionally significant for understanding where leakage initiates. Inlet edge pressure is highest; coupling surface pressure is lowest; and this gradient reverses approaching the outlet.
Honestly, most procurement specs for hydraulic seals in impact applications stop at material grade and hardness. Specifying a fluoroelastomer compound and a shore hardness value is necessary but not sufficient — if you’re not specifying compression ratio range and groove geometry, you’re leaving the most important performance variable undefined.
For components subject to ISO 9001:2015 Quality management systems traceability requirements, compression ratio should be a documented parameter in the component drawing, not left to the assembler’s discretion.
Pipe Wall Thickness: Real Effect, But Diminishing Returns #
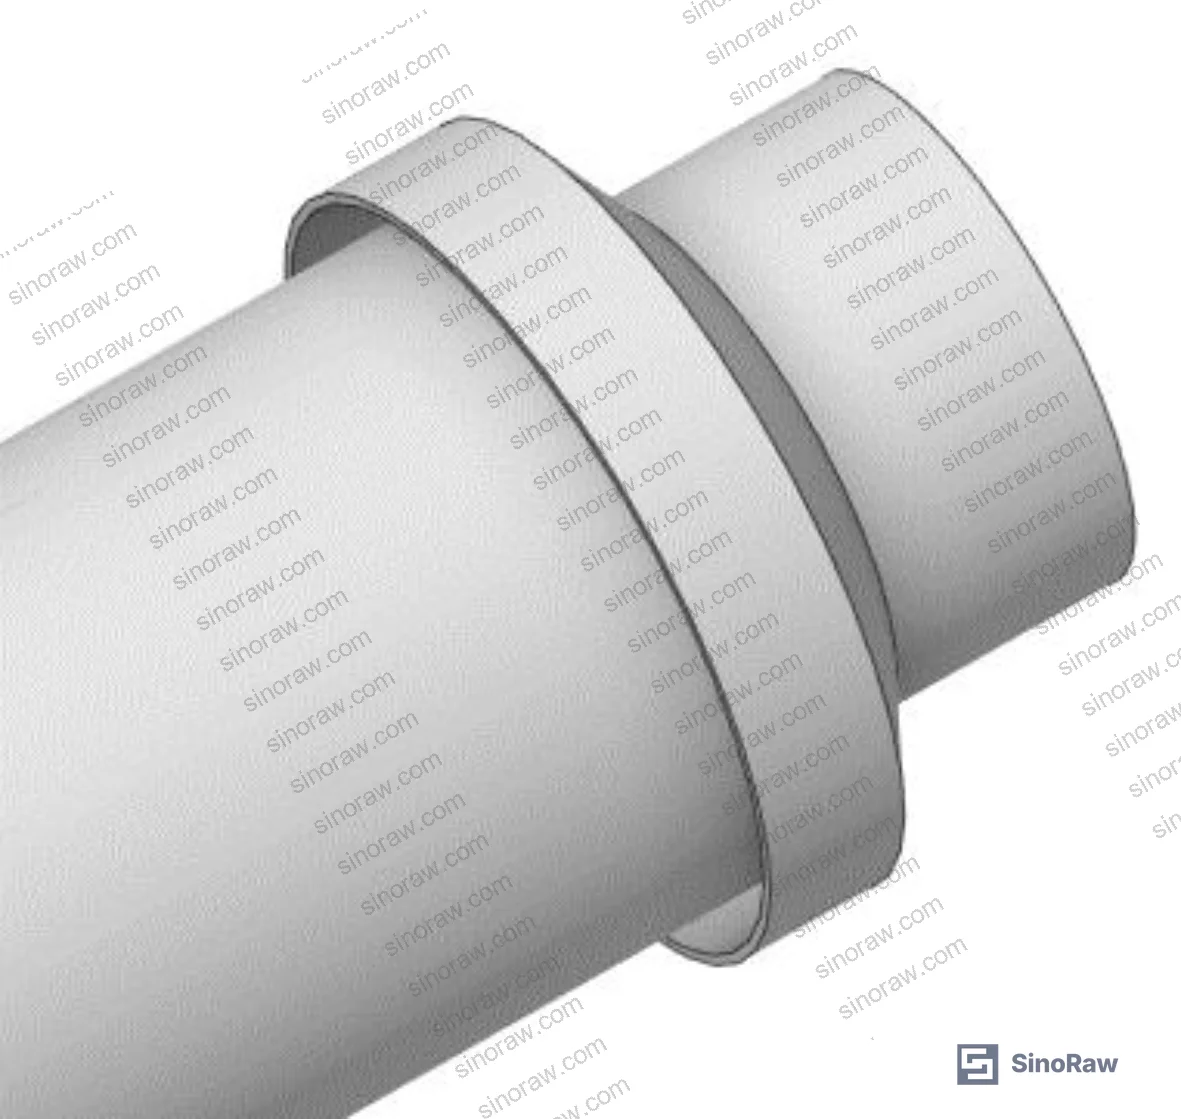
Increasing wall thickness changes the pipe’s internal diameter, which reshapes the fluid domain and shifts the pressure distribution reaching the O-ring. The effect is real but smaller in magnitude than compression ratio adjustment.
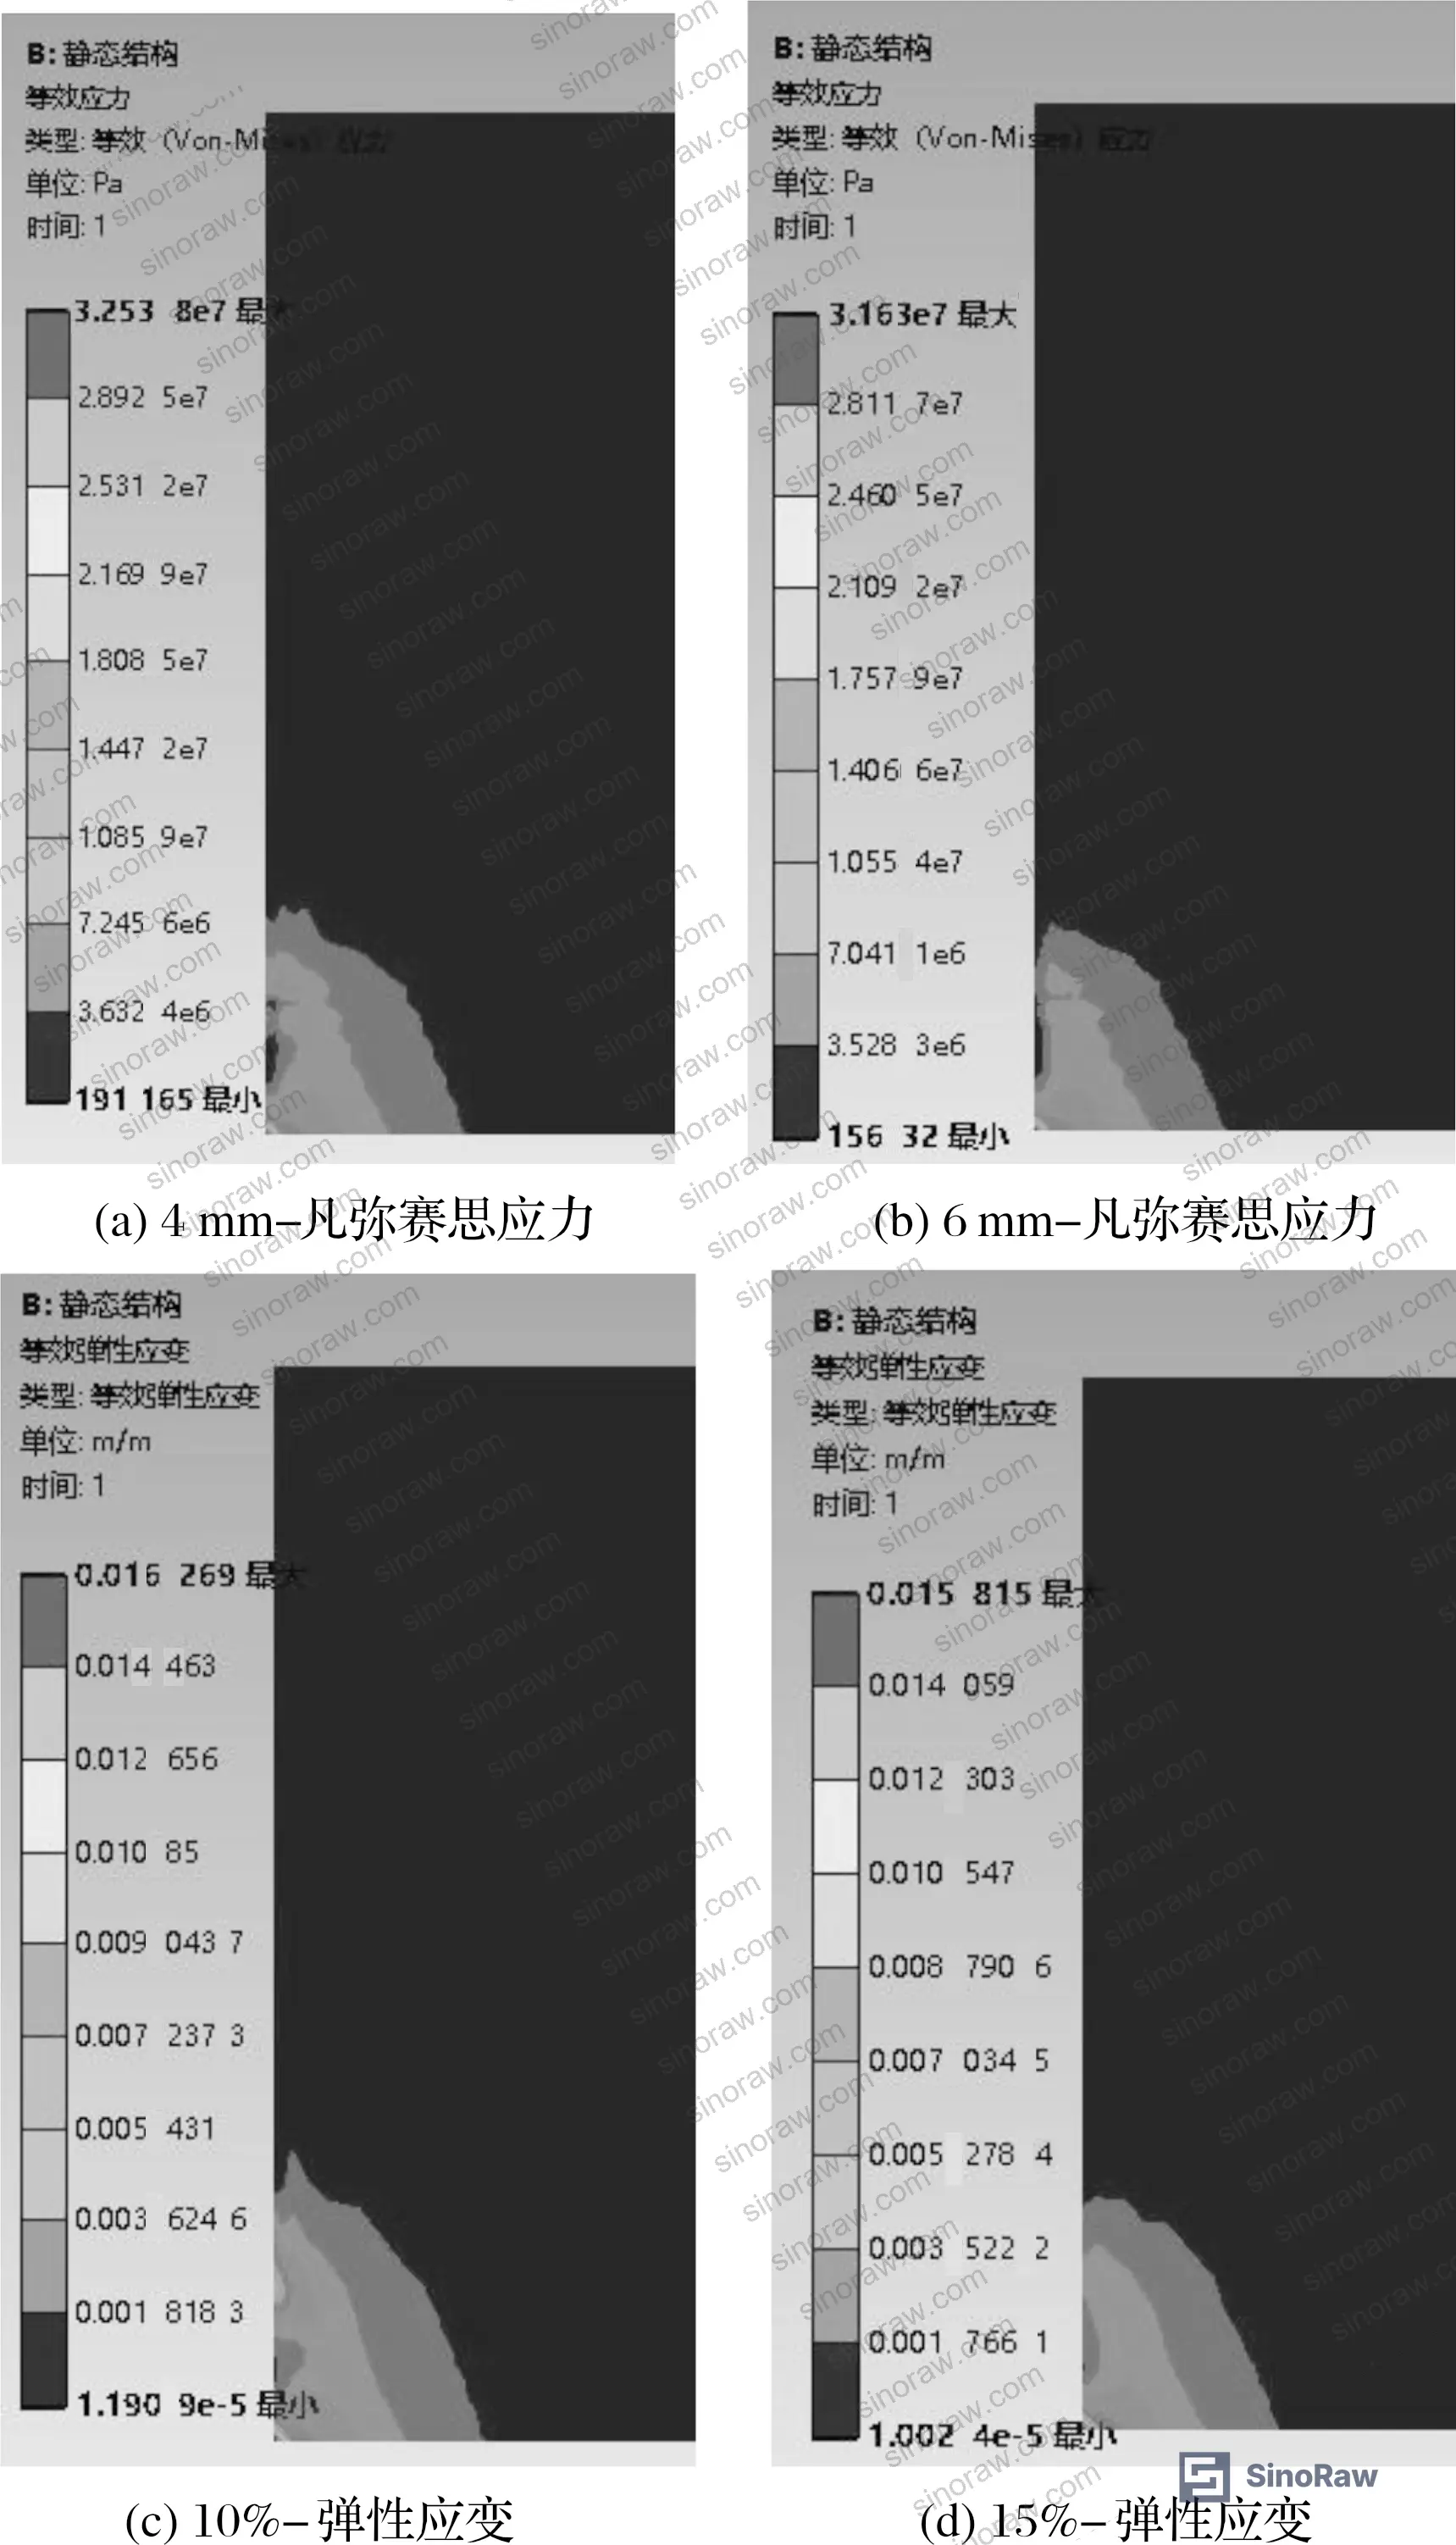
Simulation results across 4–10 mm wall thickness (at 15% compression ratio) show the following:
| Wall Thickness (mm) | Max Stress (Pa) | Min Stress (Pa) | Max Strain (m/m) | Min Strain (m/m) |
|---|---|---|---|---|
| 4 | 3.25×10⁷ | 1.92×10⁴ | 1.62×10⁻² | 1.19×10⁻⁵ |
| 6 | 3.16×10⁷ | 1.56×10⁴ | 1.58×10⁻² | 1.00×10⁻⁵ |
| 8 | 3.14×10⁷ | 1.39×10² | 1.46×10⁻² | 9.84×10⁻⁶ |
| 10 | 3.10×10⁷ | 1.27×10⁴ | 1.33×10⁻² | 8.86×10⁻⁶ |
Going from 4 mm to 10 mm wall thickness reduces maximum stress by 4.62%, minimum stress by 33.85%, maximum strain by 17.90%, and minimum strain by 25.55%. Meaningful reductions — but they come with weight, cost, and space envelope consequences that have to be weighed against application requirements.
Worth noting: stress and strain distribution topology remains essentially unchanged as wall thickness varies — the overall pattern doesn’t shift, just the magnitudes. This tells you that wall thickness is a tuning parameter, not a design corrective. If the stress pattern itself is problematic, increasing wall thickness won’t fix the geometry of the problem; it’ll just reduce the numbers slightly.
Most procurement teams don’t realize that current design guidance for high-pressure hydraulic O-ring assemblies has moved toward prescribing compression ratio as a primary specification item rather than a manufacturing tolerance band. Treating it as tolerance leaves systematic performance on the table. Compliance with REACH Regulation (EC) No 1907/2006 also makes documented material and geometry traceability increasingly important for fluoroelastomer components in hydraulic systems.
Failure Mode Analysis: Where the Seal Actually Breaks Down #
In supplier qualification reviews for hydraulic sealing components, a consistent failure pattern emerges: samples that pass static pressure tests fail under simulated dynamic loading. The reason is that static qualification doesn’t reproduce the fluid-structure interaction at the coupling surface under transient pressure spikes.
The simulation data makes this concrete. Total O-ring stress is the superposition of two contributions: stress from initial deformation (the mechanical compression effect) and stress from hydraulic fluid pressure acting through the gap geometry. At 10% compression, the gap-geometry stress contribution (3.37×10⁷ Pa) dominates over the deformation-only stress contribution (5.56×10⁵ Pa) by more than 60-fold. This means a seal that looks fine when statically loaded can experience dramatically higher stresses when hydraulic shock occurs — and static qualification completely misses that failure mode.
Elastic strain is the other failure vector. Excessive local strain accelerates rubber degradation and, critically, creates pathways for fluid communication between the high-pressure side and the environment. The minimum strain values dropping by 97.52% between 10% and 25% compression is significant: it means the low-strain regions that previously existed (which can act as weak points in the sealing contact) are effectively eliminated at higher compression.
Fluoroelastomer (FKM) material was used throughout this analysis, consistent with standard practice for hydraulic applications at elevated temperatures. For buyers specifying materials, this matters: NBR compounds may meet static specifications but will show accelerated degradation under the thermal cycling and high-strain conditions characteristic of impact hydraulics. The test verification method recommended is ASTM D882 Standard Test Method for Tensile Properties of Thin Plastic Sheeting extended to elastomeric seal cross-sections, alongside cyclic pressure testing above rated system pressure.
Practical Guidance for Buyers #
When you’re qualifying suppliers of hydraulic O-ring seals or pre-assembled hydraulic connector components for high-pressure dynamic service, the compression ratio specification is where most buyers under-specify. A supplier who can only quote you on cross-section diameter, material grade, and hardness — but cannot discuss compression ratio validation or groove geometry tolerances — is not equipped for demanding hydraulic applications.
Ask for FSI or FEA analysis documentation demonstrating seal performance at your operating pressure and expected pressure transient amplitude. This isn’t exotic — any technically competent seal manufacturer for industrial hydraulics should be able to provide it. If they can’t, that tells you something important before you’ve issued a single purchase order.
Wall thickness decisions are engineering tradeoffs. For applications where weight is constrained, maximize compression ratio before increasing wall thickness — the compression ratio effect on stress reduction (22.45% on maximum stress across the full range) is significantly larger than the wall thickness effect (4.62% for the same stress metric). Pursue both levers where the application permits.
At sinoraw.com, our team works with Guangzhou-based sourcing operations that specialize in connecting overseas procurement engineers with verified Chinese manufacturers of hydraulic sealing components — including O-ring assemblies for MRO and new-build hydraulic systems. If you need qualified suppliers who can provide compression ratio specifications and test documentation, we can get you in front of the right manufacturers quickly.
Need help identifying qualified suppliers for hydraulic O-ring seals and high-pressure pipe connectors? Talk to our sourcing team →
Supplier Qualification Questions #
- What is your documented compression ratio specification range for O-rings in high-pressure hydraulic applications, and can you provide groove geometry drawings showing how compression ratio is controlled to remain within the 15–25% band under production tolerances?
- Can you provide Von Mises stress and elastic strain simulation data (or equivalent FEA documentation) for your O-ring seal under transient pressure loading conditions, showing maximum stress values at or below 2.33×10⁷ Pa at 25% compression?
- What is your minimum mesh quality threshold in computational validation models, and how do you verify that at least 80% of mesh elements achieve quality scores above 0.9 — consistent with the simulation accuracy standard used in current FSI-based seal qualification?
- For fluoroelastomer O-rings supplied for hydraulic impact applications, what cyclic pressure fatigue test protocol do you use, and at what pressure amplitude relative to rated system pressure are samples qualified?
- How do you separately characterize the deformation-induced stress contribution versus the fluid-pressure-induced stress contribution in your seal performance data, given that gap-geometry fluid effects can exceed deformation effects by more than 60-fold at low compression ratios?
Sourcing Checklist #
- ☐ Supplier documents O-ring compression ratio on component drawings, confirmed within the 15–25% radial compression range per groove geometry specification
- ☐ Simulation or FEA validation data available showing maximum Von Mises stress ≤ 2.33×10⁷ Pa at target compression ratio under dynamic loading conditions
- ☐ Material confirmed as FKM (fluoroelastomer) with hardness specification; NBR substitution not acceptable for high-pressure impact hydraulic service without explicit approval
- ☐ Pipe wall thickness specified on component drawings with minimum 4 mm, and maximum strain performance documented per wall thickness variant
- ☐ Supplier can provide transient pressure test data showing seal integrity at operating pressure with pressure spike amplitude representative of hydraulic impact loading (inlet velocity ≥ 6.9 m/s equivalent)
- ☐ Mesh quality documentation for any computational validation model confirms minimum element quality ≥ 0.48 and ≥ 81.2% of elements above 0.9 quality threshold
- ☐ Material traceability records available for fluoroelastomer compound, with chemical compliance documentation per applicable regulations
- ☐ Static pressure qualification test results accompanied by dynamic/cyclic test results — static-only qualification not accepted for impact hydraulic applications
Key Specifications Table #
| Parameter | Recommended Value | Verification Method |
|---|---|---|
| O-ring compression ratio | 15–25% radial compression | Groove geometry dimensional inspection; FSI simulation confirming max Von Mises stress ≤ 2.33×10⁷ Pa |
| Pipe wall thickness | ≥ 6 mm for high-impact service | Engineering drawing review; strain simulation confirming max elastic strain ≤ 1.58×10⁻² m/m |
| O-ring material | FKM (fluoroelastomer) | Material certification; hardness test; chemical composition report |
| Maximum Von Mises stress at peak compression | ≤ 2.33×10⁷ Pa (at 25% compression) | FSI/FEA simulation documentation under transient loading conditions |
| Minimum elastic strain (coupling surface) | ≤ 5.51×10⁻⁷ m/m at peak compression | Structural simulation with coupled fluid pressure boundary conditions |
| Hydraulic fluid inlet velocity (design basis) | 6.9 m/s | System flow calculation; UDF-defined transient pressure boundary verification |
| Fluid domain mesh element count | ≥ 200,000 elements with min quality 0.48 | Mesh quality report from simulation package |
Can’t find a supplier meeting these specs? Submit your requirements and we’ll match you within 48 hours.
References #
Data source: Fluid-Structure Interaction Analysis of O-Ring Sealing Performance in High-Pressure Hydraulic Piping Systems Under Impact Loading, Q.-T. Zhao et al., Journal of the Mechanical Engineering Science, 2025
Frequently Asked Questions #
Why does increasing compression ratio reduce O-ring stress rather than increase it?
It seems backward — more squeeze should mean more stress. But in high-pressure dynamic systems, the dominant stress driver isn’t the mechanical compression; it’s the hydraulic fluid pressure acting on the O-ring through the annular gap. Higher compression reduces that gap, changes the fluid flow regime, and cuts the fluid’s effective pressure on the seal face. At 10% compression, the fluid-gap stress contribution (3.37×10⁷ Pa) exceeds the deformation-only contribution (5.56×10⁵ Pa) by over 60 times. So compressing the O-ring more actually reduces the net stress by closing off the dominant stress pathway.
What material should be specified for O-rings in hydraulic impact applications?
Fluoroelastomer (FKM) is the appropriate material for this service class. It has better resistance to thermal cycling, hydraulic fluid compatibility, and fatigue under repeated high-strain events than NBR. The simulation data in this analysis was derived using FKM material properties, so the stress and strain thresholds cited here are specific to FKM. NBR may meet static qualification criteria but should not be accepted as a substitute without specific dynamic fatigue test data.
Is wall thickness or compression ratio more effective for improving seal life?
Compression ratio. Increasing compression from 10% to 25% reduces maximum stress by 22.45% — roughly five times the improvement you get from going from 4 mm to 10 mm wall thickness (4.62% max stress reduction). Wall thickness helps, and the strain reduction is more meaningful (17.90% on maximum strain), but if you’re resource-constrained, optimize compression ratio first.
How do I verify a supplier’s O-ring compression ratio in production?
Compression ratio is a function of O-ring cross-section diameter and groove depth. The practical verification is dimensional inspection of the groove geometry on the mating hardware, combined with the O-ring cross-section tolerance. Ask the supplier for groove geometry drawings with tolerances and cross-reference against the O-ring cross-section tolerance to calculate the compression ratio range actually achieved in production. A supplier who cannot provide this calculation has not engineered the seal system — they’ve just installed an O-ring.
Can this analysis apply to O-rings used in non-impact hydraulic systems?
The specific stress and strain values are calibrated to a hydraulic pile driver with its particular transient pressure profile. But the governing principles — that compression ratio controls gap geometry, which controls fluid pressure on the seal face, which drives peak stress — apply broadly to any hydraulic system where pressure transients occur. The practical recommendation (stay toward the upper end of the allowable compression ratio range) is sound guidance for most industrial hydraulic sealing applications.
Published by sinoraw.com Technical Team | Request a sourcing quote


