

TL;DR #
Frequency domain spectroscopy (FDS) measurements on oil-impregnated paper (OIP) bushings shift systematically along the frequency axis with temperature — at 80°C versus 20°C, the minimum dissipation factor value changes by up to 16.9% for 110 kV bushings and 15.7% for 72.5 kV units, making uncorrected field readings unreliable for insulation condition assessment. Buyers specifying transformer bushings or procuring high-voltage switchgear components must demand temperature-normalized FDS test data, not raw curves, or they risk accepting bushings with concealed moisture ingress or aging defects. Before issuing any RFQ, confirm that the supplier’s QC protocol applies Arrhenius-based temperature correction to a 20°C reference standard across the full 10⁻² Hz to 10³ Hz test range.
Overview #
If you’re evaluating oil-impregnated paper (OIP) bushings for transformer applications — whether at 72.5 kV, 110 kV, or 220 kV — the single most consequential thing you can do before qualifying a supplier is understand how their factory test data was generated and at what temperature. Most procurement teams simply look at the dissipation factor (tan δ) value and call it a day. That’s a mistake.
Research conducted by a high-voltage transmission maintenance and testing center examined the temperature-dependent behavior of OIP capacitor bushings across three voltage classes using controlled oven heating and a full FDS sweep from 10⁻² Hz to 10³ Hz. The test voltage was 1414 V. Samples were held at target temperature for 12 hours to ensure thermal equilibrium throughout the oil-paper insulation structure before any measurement was taken. This kind of thermal soak discipline is rarely replicated in factory QC environments, which is exactly why field-measured insulation data so often fails to match factory certificates.
The research provides a quantitative basis for what engineers have long suspected: temperature is not a secondary variable in FDS measurement — it is a dominant one. Ignoring it doesn’t just introduce small errors; it can invert your diagnostic conclusion entirely.
For buyers sourcing OIP bushings or MRO replacement components from Chinese manufacturers, this analysis is directly relevant to how you interpret incoming inspection data and what you should require in a supplier qualification protocol. Understanding these characteristics also connects closely to broader Sealing & Thermal material behavior and the dielectric performance of Specialty Polymers used in composite insulation systems.
Temperature Effects on OIP Bushing FDS Characteristics #
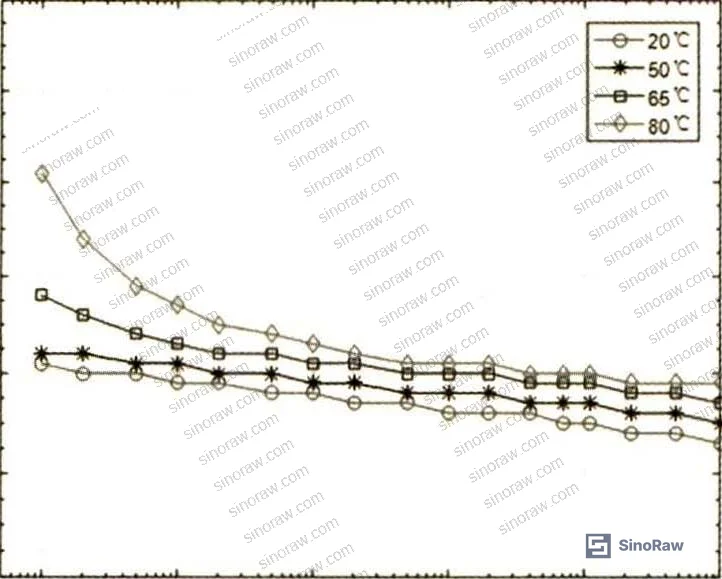
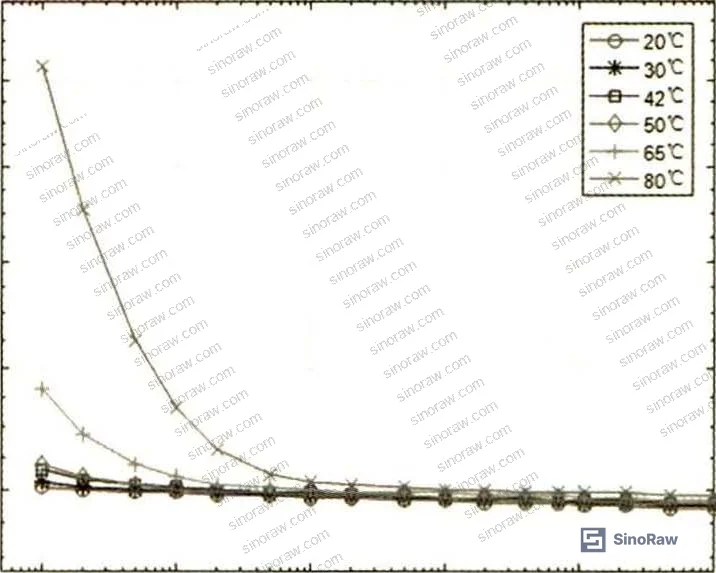
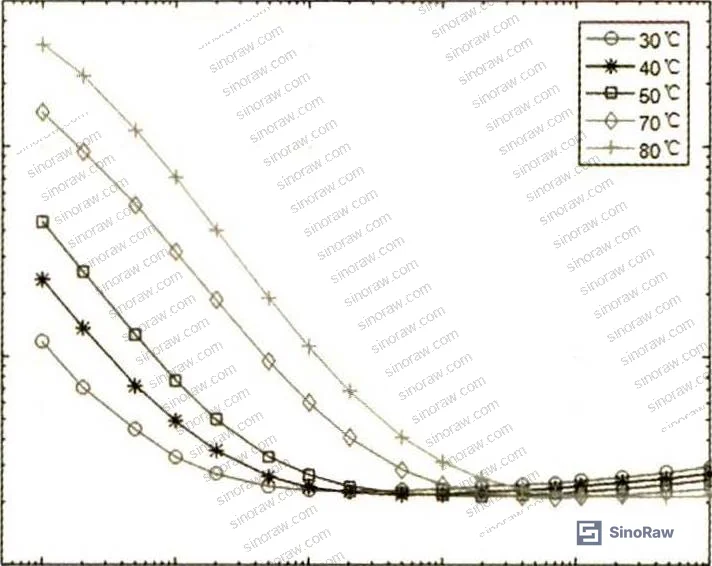
The core finding from testing 72.5 kV, 110 kV, and 220 kV OIP bushings across temperature ranges from 20°C to 80°C is consistent across all three voltage classes: the FDS curve shape remains largely unchanged, but the entire curve shifts toward higher frequencies as temperature increases. This is not a trivial offset — it represents a fundamental change in where the minimum dissipation factor occurs in the frequency domain.
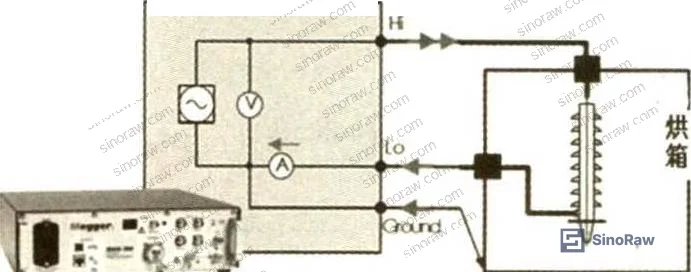
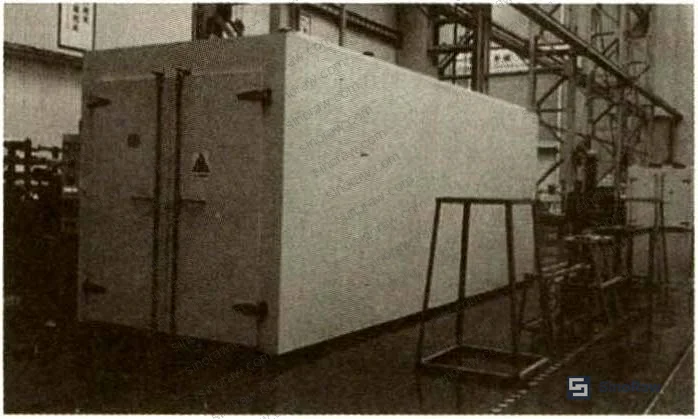
Four consistent behavioral patterns emerge across all voltage classes tested:
Low-frequency behavior: As temperature rises, tan δ increases in the low-frequency range. This is driven by conductance loss — higher temperature increases ion mobility and conductivity, which dominates at low frequencies. The conductance loss is inversely proportional to frequency, so the effect is strongest at 10⁻² Hz.
High-frequency behavior: At high frequencies, tan δ decreases as temperature rises. This is counterintuitive to many buyers. The mechanism is that higher temperature reduces dielectric relaxation time exponentially (Arrhenius relationship), which means relaxation polarization builds faster — and at high frequencies, the polarization loss actually diminishes.
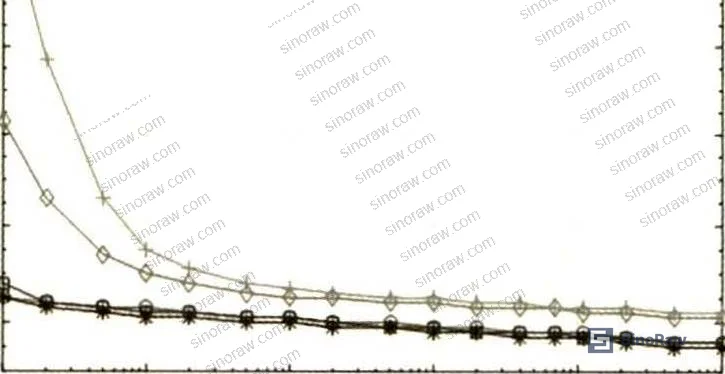
Capacitance trends: Capacitance increases with temperature across the full frequency range. At high frequencies the increase is modest; at low frequencies it becomes exponential. The ratio C(10 mHz)/C(1 kHz) increases as temperature rises, providing a useful diagnostic index.
Curve shift: The minimum tan δ frequency point shifts to higher frequencies with increasing temperature — explaining why a bushing that appears acceptable when tested warm may show insulation problems when the corrected 20°C curve is examined.
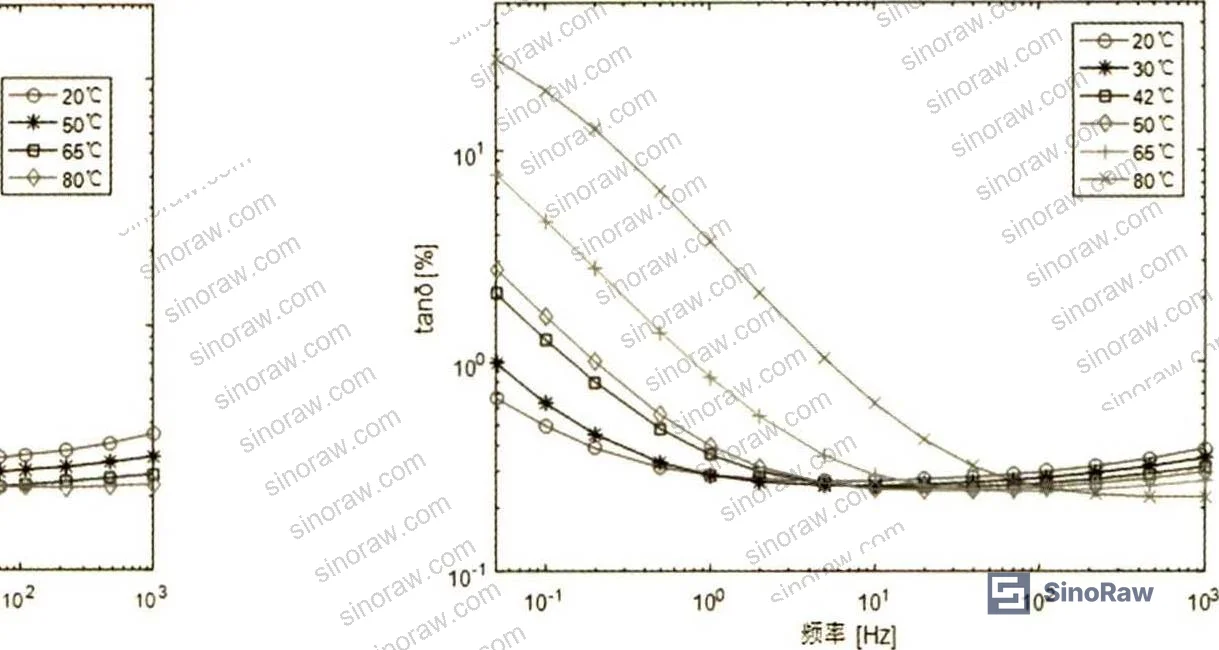
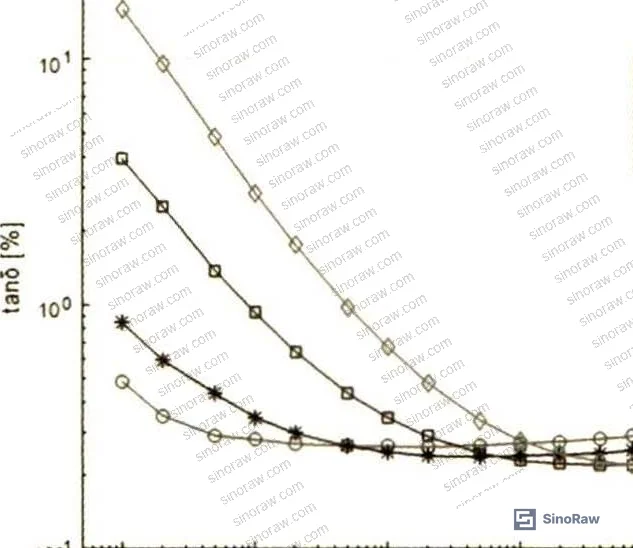
Comparison across voltage classes:
| Bushing Class | Temperature Range Tested | tan δ Shift (20°C vs 80°C) | C(10mHz)/C(1kHz) Trend |
|---|---|---|---|
| 72.5 kV OIP | 20°C, 50°C, 80°C | 15.7% minimum tan δ change | Increases with temperature |
| 110 kV OIP | 20°C, 30°C, 42°C, 50°C, 65°C, 80°C | 16.9% minimum tan δ change | Increases with temperature |
| 220 kV OIP | 30°C, 40°C, 50°C, 70°C, 80°C | Consistent curve shift pattern | Exponential increase at low Hz |
The Debye relaxation model explains these behaviors at a physics level — the dielectric loss decomposes into a conductance loss component and a relaxation polarization loss component, with temperature shifting which dominates at any given frequency. Buyers don’t need to work through the math, but they do need to understand the implication: a single tan δ reading without temperature context tells you almost nothing reliable about insulation condition.
Compliance with quality management practices under ISO 9001:2015 Quality management systems requires that test conditions be documented and controlled — and temperature is precisely the kind of environmental variable that must be recorded, not assumed.
Arrhenius Temperature Correction for FDS Measurements #
The Arrhenius equation provides the mathematical backbone for correcting FDS curves from any measurement temperature back to a 20°C reference standard. The correction works by shifting the entire curve along the frequency (log) axis by a correction factor L, calculated as:
L = (Ea / kb) × (1/T2 − 1/T1)
Where Ea is the dielectric activation energy in eV, kb is Boltzmann’s constant (8.617 × 10⁻⁵ eV/K), and T1 and T2 are the measurement and reference temperatures in Kelvin.
For oil-impregnated paper insulation systems, the activation energy generally falls in the 0.4 eV to 1.0 eV range. The specific values measured in this research provide a concrete calibration:
- 110 kV OIP bushing at 30°C → 20°C correction: Ea = 0.52 eV
- 110 kV OIP bushing at 42°C → 20°C correction: Ea = 0.54 eV
- 110 kV OIP bushing at 50°C → 20°C correction: Ea = 0.60 eV
- 110 kV OIP bushing at 65°C → 20°C correction: Ea = 0.64 eV
- 110 kV OIP bushing at 80°C → 20°C correction: Ea = 0.80 eV
- 72.5 kV OIP bushing at 50°C → 20°C correction: Ea = 0.42 eV
- 72.5 kV OIP bushing at 65°C → 20°C correction: Ea = 0.68 eV
- 72.5 kV OIP bushing at 80°C → 20°C correction: Ea = 0.76 eV
A broader benchmark from the electrical insulation literature places activation energy for oil-paper composite insulation systems in the 0.70 eV to 1.18 eV range, which the experimental values above fall mostly within or near. The trend is clear: the higher the measurement temperature relative to the 20°C reference, the higher the activation energy value required for accurate correction. This means you cannot use a single fixed Ea value for all field conditions — it must be temperature-specific.
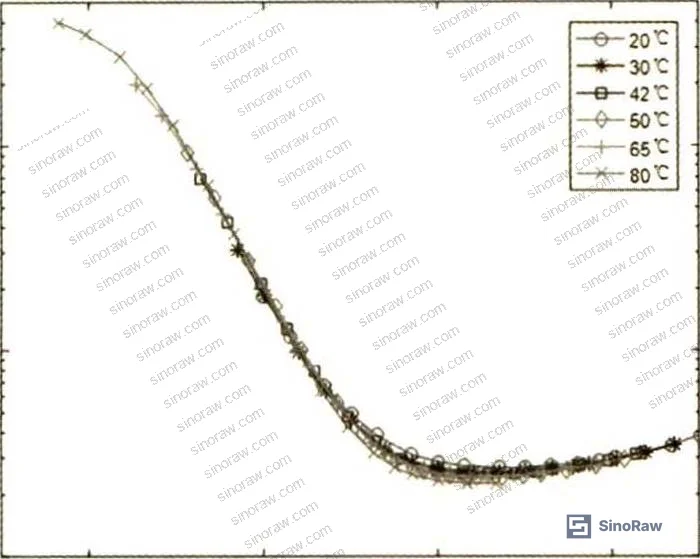
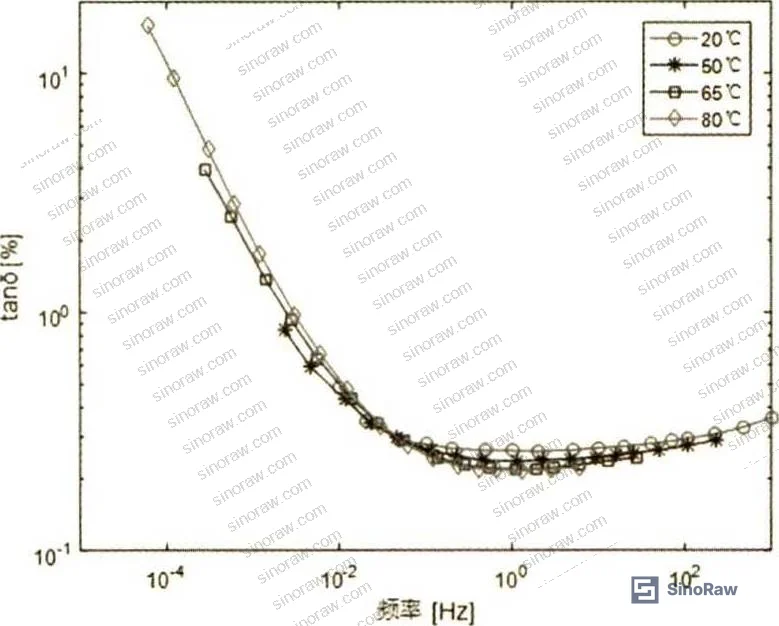
The correction works well across most of the frequency range, but it has a documented limitation: the region around the minimum tan δ frequency shows the highest residual error after correction. At the most problematic test conditions, the corrected curve can deviate from the actual 20°C measured curve by up to 20% in the minimum tan δ region. Outside that region, agreement is much tighter. This is a known limitation buyers should be aware of when interpreting correction-based reports.
Most procurement teams don’t realize that current FDS interpretation standards were developed primarily at laboratory reference temperatures and that supplier test reports generated at elevated ambient temperatures — common in summer field measurements — may carry systematic errors that make healthy bushings look deteriorated or vice versa. The Arrhenius correction methodology addresses this, but only if it’s actually being applied correctly by the supplier’s test team.
Practical Guidance for Buyers #
When you’re sourcing OIP bushings — whether for transformer MRO, substation upgrades, or new equipment qualification — the temperature correction question is non-negotiable. Ask every supplier to provide FDS test data corrected to 20°C using Arrhenius methodology, and ask them to document both the measurement temperature and the activation energy value used for correction. If they cannot answer that question, they are not running FDS-based insulation qualification correctly.
Honestly, most buyers over-specify the capacitance tolerance and under-specify the test conditions. A ±5% capacitance spec means nothing if the test was run at 60°C and no correction was applied. What you actually need is a corrected tan δ curve at 20°C reference, measured across the full 10⁻² Hz to 10³ Hz range at 1414 V test voltage, with the Ea value on record.
For incoming inspection, request the raw FDS data file, not just a pass/fail certificate. The curve shape tells you things the single-number summary cannot — particularly whether moisture ingress has pushed the low-frequency tan δ anomalously high or whether aging has flattened the curve in ways a single-point measurement misses entirely.
The C(10 mHz)/C(1 kHz) ratio is a useful screening index — it should be consistent with temperature-corrected baseline data for the bushing class. Any significant deviation warrants full FDS analysis.
Suppliers who manufacture OIP bushings to ISO 14001:2015 Environmental management systems standards generally have more disciplined process controls that extend to test methodology and environmental condition logging — worth factoring into your audit.
At sinoraw.com, our sourcing team works with verified Chinese manufacturers of high-voltage insulation components and helps overseas procurement engineers qualify suppliers before RFQs are issued — including verifying whether factory test protocols match the FDS temperature correction requirements described above.
Need help identifying qualified suppliers for oil-impregnated paper bushings? Talk to our sourcing team →
Supplier Qualification Questions #
- Can you provide FDS test data for your OIP bushings showing tan δ and capacitance curves across the full 10⁻² Hz to 10³ Hz frequency range, measured at 1414 V test voltage?
- What reference temperature do you use for FDS curve normalization, and do you apply Arrhenius-based correction to translate measurements taken at elevated temperatures back to the 20°C standard?
- For a 110 kV OIP bushing measured at 80°C, what activation energy value (Ea in eV) do you apply in your Arrhenius temperature correction, and how was this value determined?
- What is the C(10 mHz)/C(1 kHz) capacitance ratio for your 110 kV or 220 kV bushing models, and how does this ratio change across your production batch-to-batch variation?
- In your FDS temperature correction results, what is the maximum residual deviation between the corrected curve and an actual 20°C reference measurement — particularly in the minimum tan δ frequency region?
Sourcing Checklist #
- ☐ Supplier provides complete FDS test curves (tan δ and capacitance) measured from 10⁻² Hz to 10³ Hz at 1414 V test voltage
- ☐ FDS test data is normalized to a 20°C reference temperature using Arrhenius correction with documented activation energy values
- ☐ Documented Ea values fall within the 0.4 eV to 1.0 eV range appropriate for oil-paper composite insulation
- ☐ For test temperatures at or above 65°C, supplier uses Ea ≥ 0.64 eV for 110 kV class bushings (per Arrhenius correction data)
- ☐ Temperature correction residual error in the minimum tan δ region is documented and does not exceed 20%
- ☐ Factory test records include measurement temperature, soak duration (minimum 12 hours at target temperature), and ambient conditions
- ☐ Supplier’s quality management system is certified to ISO 9001:2015 Quality management systems
- ☐ Incoming sample inspection uses ISO 2859-1:1999 Sampling procedures for inspection by attributes with defined AQL for critical insulation parameters
Key Specifications Table #
| Parameter | Recommended Value | Verification Method |
|---|---|---|
| FDS test voltage | 1414 V AC sinusoidal | Review test protocol documentation |
| FDS frequency range | 10⁻² Hz to 10³ Hz (full sweep) | Verify raw data file, not summary report |
| Temperature soak duration before measurement | Minimum 12 hours at target temperature | Request test log with timestamps |
| Reference temperature for curve normalization | 20°C | Confirm on test certificate |
| Activation energy (Ea) for oil-paper insulation | 0.4 eV – 1.0 eV (temperature-dependent) | Request Arrhenius correction calculation sheet |
| Max tan δ correction residual error (minimum tan δ region) | ≤ 20% | Compare corrected vs. actual 20°C curve |
| tan δ change (80°C vs 20°C, 110 kV class) | Reference baseline: 16.9% | Cross-check against class-specific data |
| C(10 mHz)/C(1 kHz) ratio | Increasing with temperature — document baseline value | Request capacitance sweep data |
Can’t find a supplier meeting these specs? Submit your requirements and we’ll match you within 48 hours.
References #
Data source: Temperature-Dependent Frequency Domain Spectroscopy Characteristics of AC Oil-Impregnated Paper Insulated Bushings and Arrhenius-Based Correction Methods, W. Zhang et al., IEEE Transactions on Dielectrics and Electrical Insulation, 2025
Frequently Asked Questions #
Why does the FDS curve shift toward higher frequencies when bushing temperature increases?
Higher temperature reduces the dielectric relaxation time of the oil-paper insulation exponentially, following an Arrhenius relationship. As relaxation time shortens, the frequency at which polarization mechanisms dominate — and where the minimum tan δ occurs — shifts upward. The curve shape stays largely intact; its position along the frequency axis moves.
What activation energy value should I use for Arrhenius temperature correction?
It depends on the measurement temperature. Experimental data shows Ea ranges from approximately 0.42 eV (50°C correction to 20°C for 72.5 kV class) up to 0.80 eV (80°C correction to 20°C for 110 kV class). Using a single fixed value across all temperatures introduces systematic error — the correction must be temperature-specific.
Is the tan δ change between 20°C and 80°C large enough to affect a pass/fail insulation evaluation?
Yes, and this is the critical procurement issue. A change of 15–17% in minimum tan δ value between 20°C and 80°C is large enough to shift a borderline result across an acceptance threshold. Without temperature correction, a warm bushing with marginal insulation could pass, while a healthy bushing tested cold might generate unnecessary concern.
How accurate is the Arrhenius correction method in practice?
Well validated across most of the frequency range, but with a documented limitation: in the vicinity of the minimum tan δ frequency, the corrected curve can deviate from the actual 20°C measured curve by up to 20%. Outside that region, the corrected and reference curves show high agreement. Any FDS evaluation should note this limitation explicitly when interpreting results near the minimum loss frequency.
What is the C(10 mHz)/C(1 kHz) ratio and why does it matter for procurement?
This ratio reflects how strongly the low-frequency capacitance departs from the high-frequency value — a signature of dielectric polarization behavior in the oil-paper system. Higher temperature produces a larger ratio. It serves as a practical index for comparing bushings tested at different temperatures and for detecting anomalous insulation conditions that single-frequency capacitance measurements would miss entirely.
Published by sinoraw.com Technical Team | Request a sourcing quote


