

TL;DR #
Full-scale tunnel fire testing shows that cable tray fires in confined utility tunnels produce three distinct thermal stratification layers, with ceiling temperatures decaying asymmetrically — the sealed portal side cools 23% faster than the open end at equivalent distances from the fire source. For procurement engineers specifying fire-rated cable jacketing and cable tray systems destined for utility tunnel installations, this data directly informs minimum flame-spread and heat-release-rate thresholds that supplier specifications must meet. Before issuing any RFQ for cable management or fire barrier materials targeting underground utility tunnel applications, require suppliers to provide cone calorimeter data showing effective heat of combustion values for their cable insulation compounds.
Overview #
If you’re sourcing cable tray systems, fire-rated cable jacketing, or thermal barrier materials for underground utility tunnel (综合管廊) installations, the thermal performance data coming out of full-scale confined-space fire research should be your baseline — not the supplier’s brochure. Most procurement teams still rely on open-air cable fire ratings and assume the confined geometry won’t change the picture. It does, significantly.
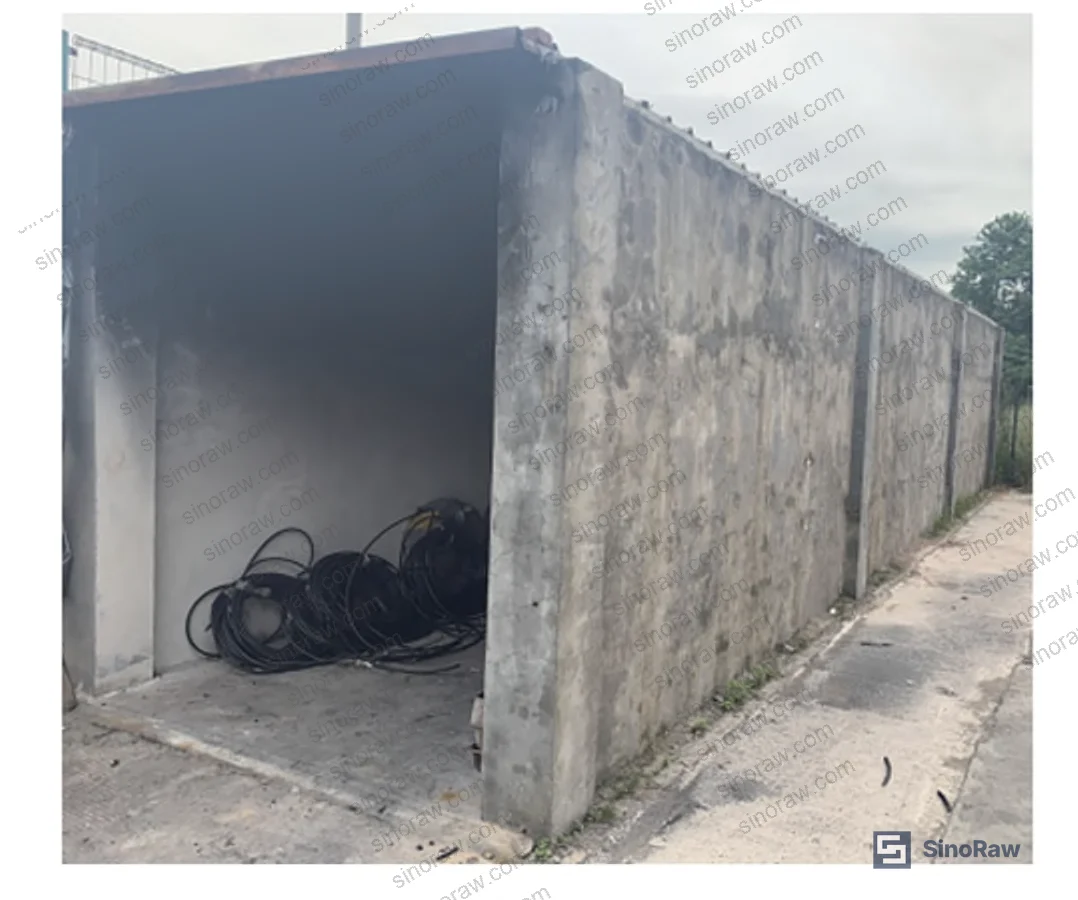
The data referenced in this article comes from 1:1 full-scale utility tunnel model experiments conducted at a Chinese university’s environmental and resources research facility. The test chamber replicated a real power compartment — 15 m long, 2.6 m wide, 2.9 m internal clear height, concrete walls, fire-resistant ceiling panels — with one portal sealed and one open. A three-tier cable tray assembly was installed, and nine distinct fire scenarios were tested using n-heptane pool fires ranging from 28 kW to 87 kW as ignition sources beneath the tray. Temperature mapping was performed via 32 K-type thermocouples: 19 on a vertical tree for stratification profiling, 13 mounted 40 mm below the ceiling along the longitudinal axis.
The cable type tested was YJV3×16 (10 kV) cross-linked polyethylene insulated cable — a common power distribution cable in Chinese utility tunnel installations. Cone calorimeter testing at 35 kW/m² heat flux confirmed an average effective heat of combustion of 13.27 kJ/g (range: 11.81–14.73 kJ/g across two test runs). This is the kind of material-level data that should appear on any supplier’s technical data sheet — if it doesn’t, that’s your first warning sign.
For overseas buyers working through platforms like sinoraw.com — which connects procurement engineers with verified Chinese manufacturers of cable management and industrial fire protection materials — this experimental dataset provides the specification anchors needed to write defensible technical requirements before supplier qualification begins.
Cable Tray Fire Temperature Stratification in Confined Utility Tunnels #
The vertical temperature structure in a sealed utility tunnel during a cable tray fire is not uniform, and treating it as such is one of the costlier assumptions a fire protection engineer can make when specifying heat-activated suppression systems or thermal barrier laminates.
Full-scale testing consistently confirmed three thermal zones within the tunnel cross-section:
Zone 1 — Ceiling Jet Layer: Extends from the ceiling down to approximately 0.20–0.25 m below the ceiling surface (between thermocouple positions T4 and T5 on the vertical tree). This is where peak temperatures concentrate and where ceiling-mounted detection or suppression components will see the most severe thermal loading.
Zone 2 — Hot Smoke Transition Layer: Spans from 0.20–0.25 m to 0.70–0.80 m below the ceiling (between T12 and T13). Temperature gradients here are steep and fire-load dependent.
Zone 3 — Cold Air Layer: Below 0.70–0.80 m from the ceiling. During the test scenarios, this lower zone remained comparatively cool regardless of fire source power — an important boundary condition for cable routing at floor level.
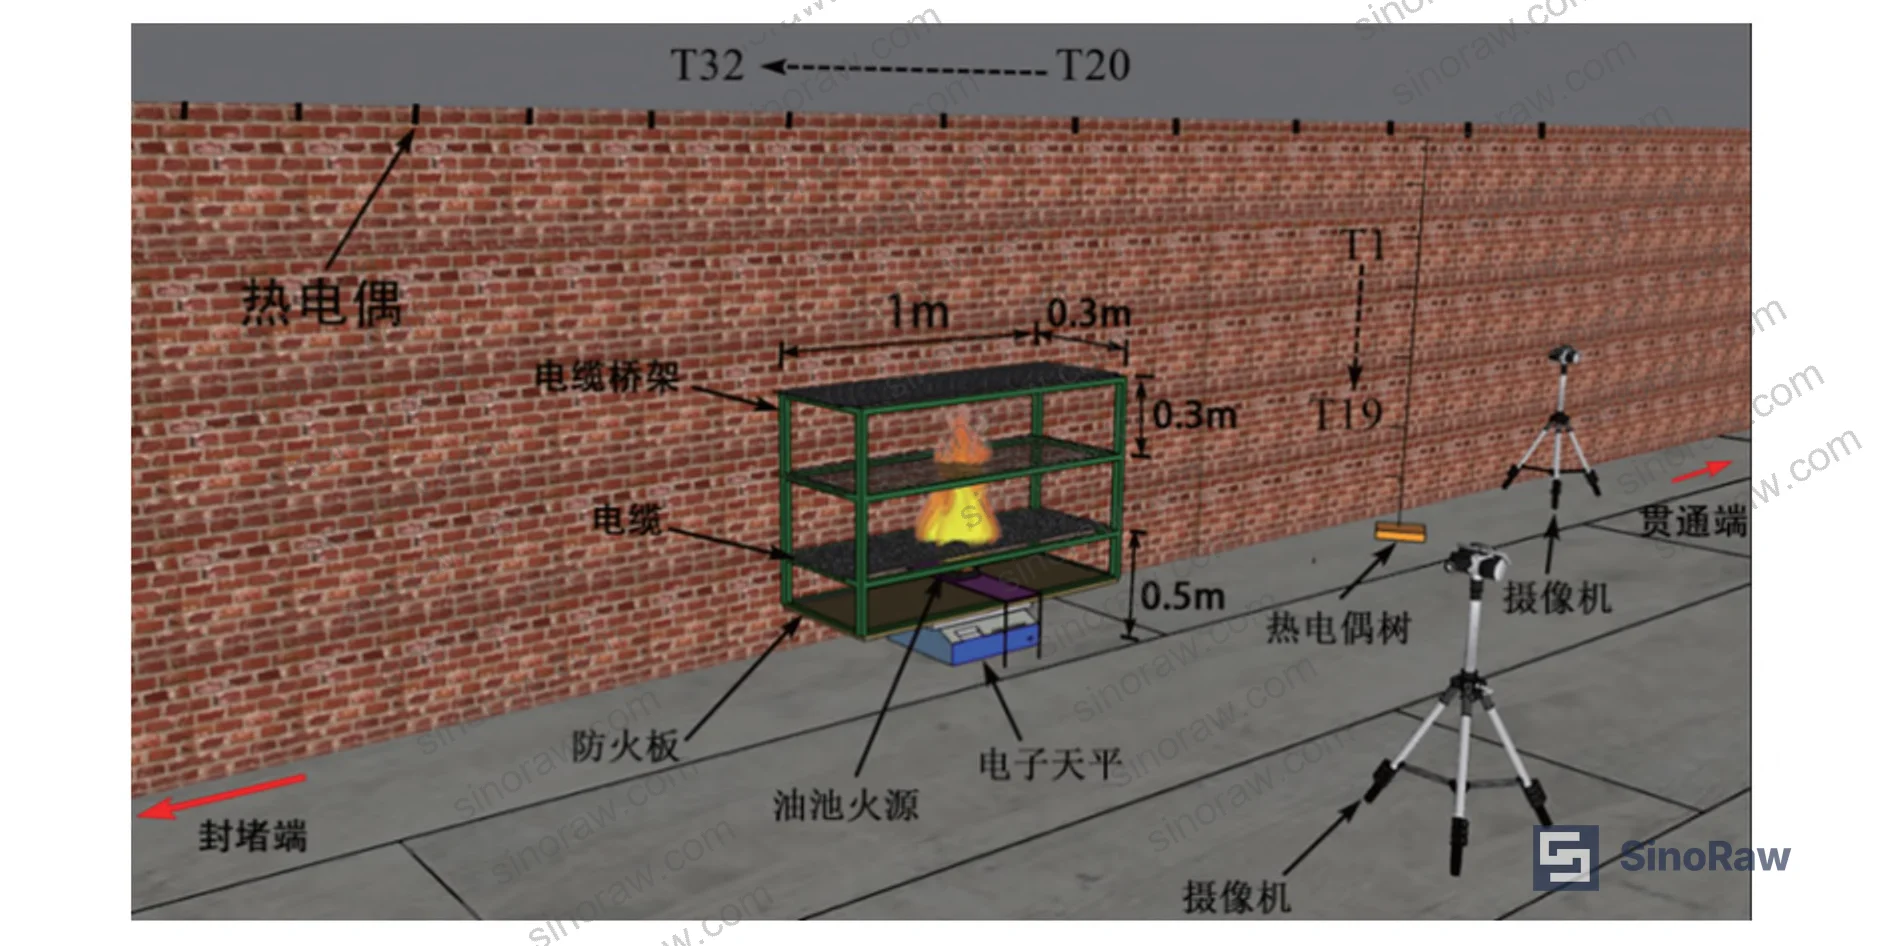
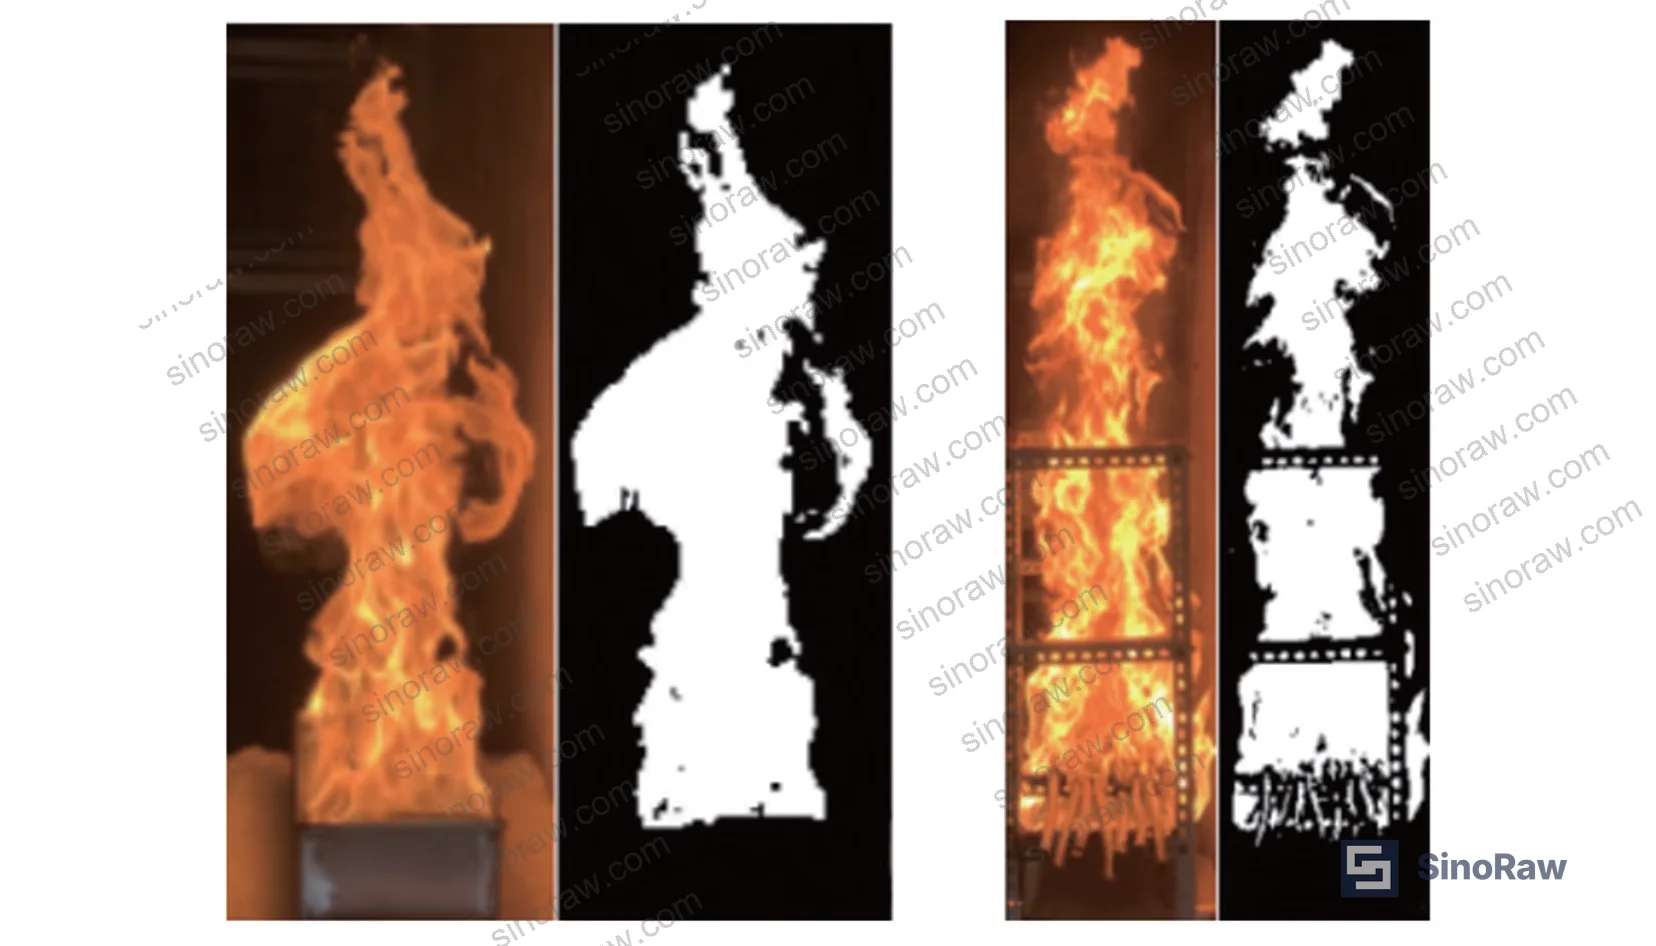
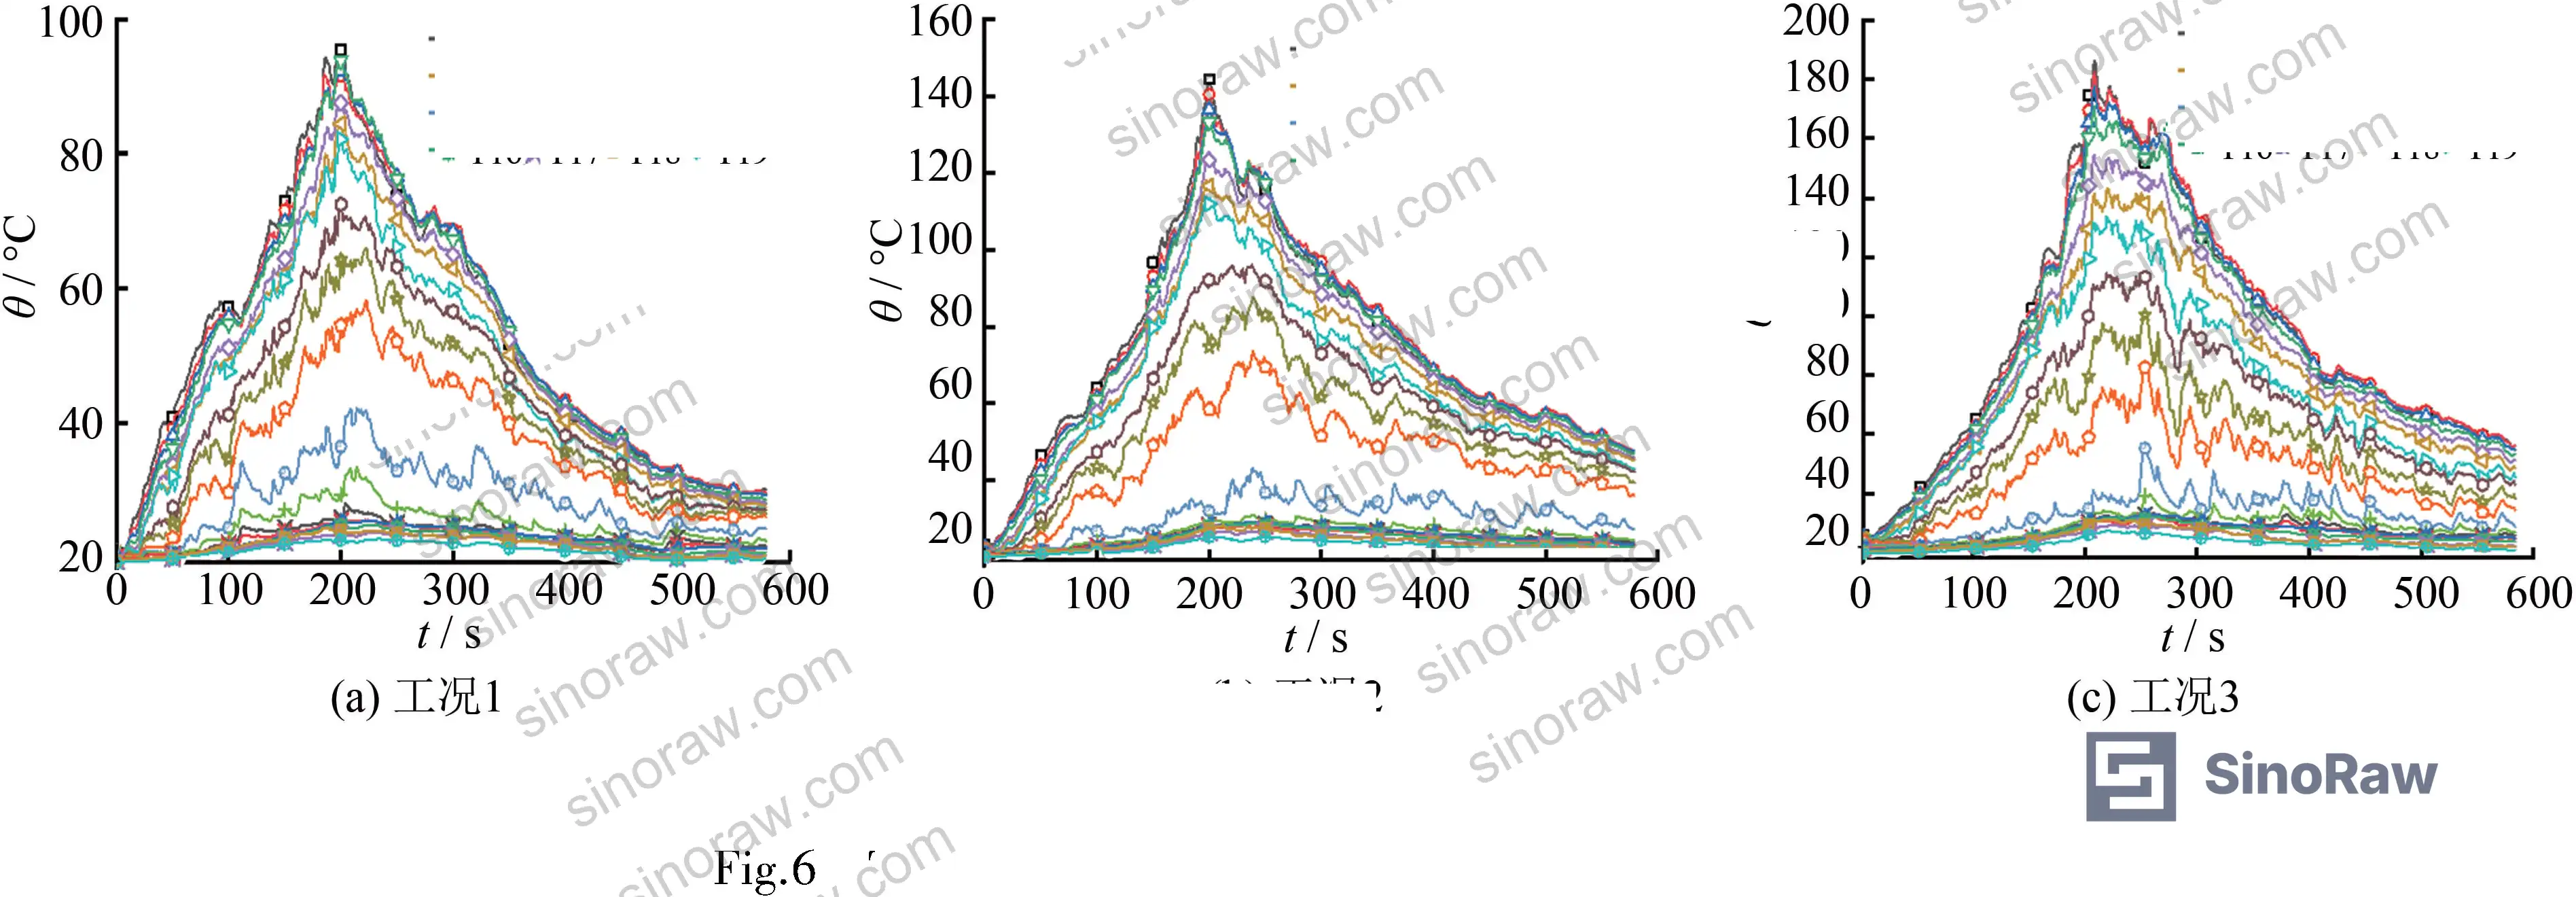
The boundaries shift with fire load, but the three-zone structure was stable across all nine test conditions — including fire source powers of 28, 45, 65, and 87 kW, and cable tray loadings of 1, 2, and 3 layers. The ceiling jet layer thickness is the critical parameter for specifying the temperature rating of cable tray mounting hardware and any thermally activated barrier films or intumescent coatings applied to the tray or surrounding structure.
For buyers sourcing Barrier Films for fire compartment applications, the 0.20–0.25 m ceiling jet boundary defines the zone where your material will see the highest sustained thermal exposure. Specifying a barrier film rated only to the average tunnel temperature is incorrect — the ceiling jet temperature in a 65 kW cable fire scenario exceeded 100°C above ambient.
| Test Condition | Fire Source Power (kW) | Cable Layers | Observed Ceiling Jet Layer Depth (m below ceiling) |
|---|---|---|---|
| Low load, 1-layer tray | 28 | 1 | 0.20–0.25 |
| Medium load, 2-layer tray | 45–65 | 2 | 0.20–0.25 |
| High load, 3-layer tray | 87 | 3 | 0.20–0.25 (jet; flame contact at ceiling in severe cases) |
| Transition zone boundary | All conditions | All | 0.70–0.80 (consistent across conditions) |
| Cold air lower zone | All conditions | All | Below 0.70–0.80 m |
Ceiling Temperature Decay and Fire-Side Asymmetry in Sealed Tunnel Conditions #
This is where the procurement data gets specifically actionable — and where most RFQs I’ve reviewed are written incorrectly.
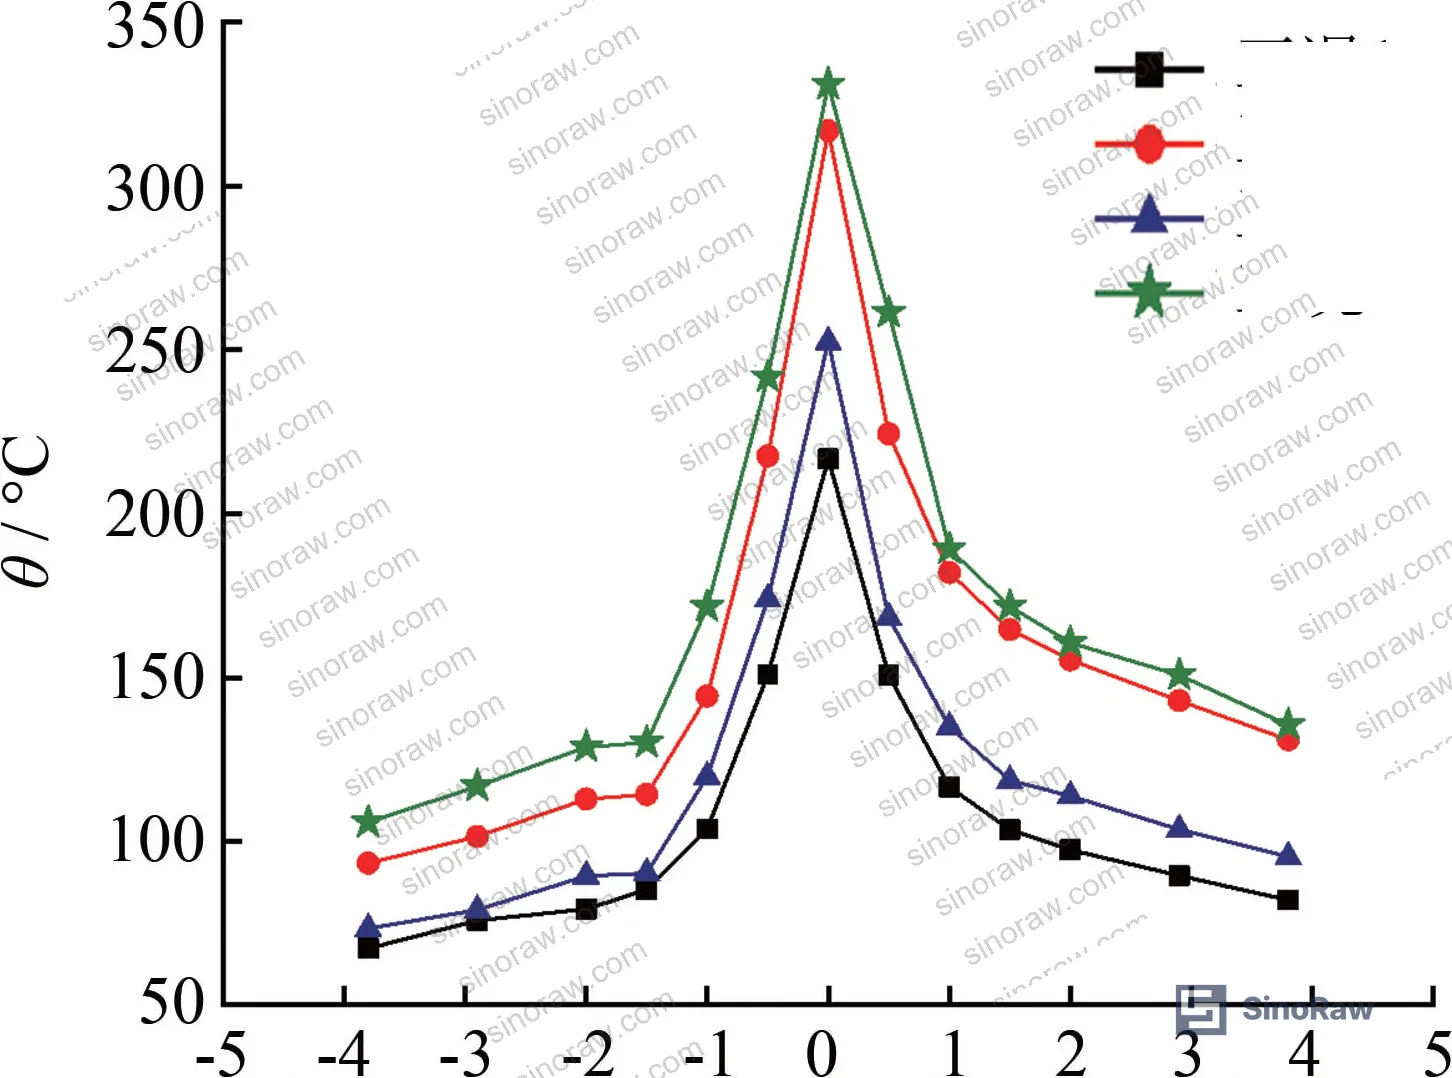
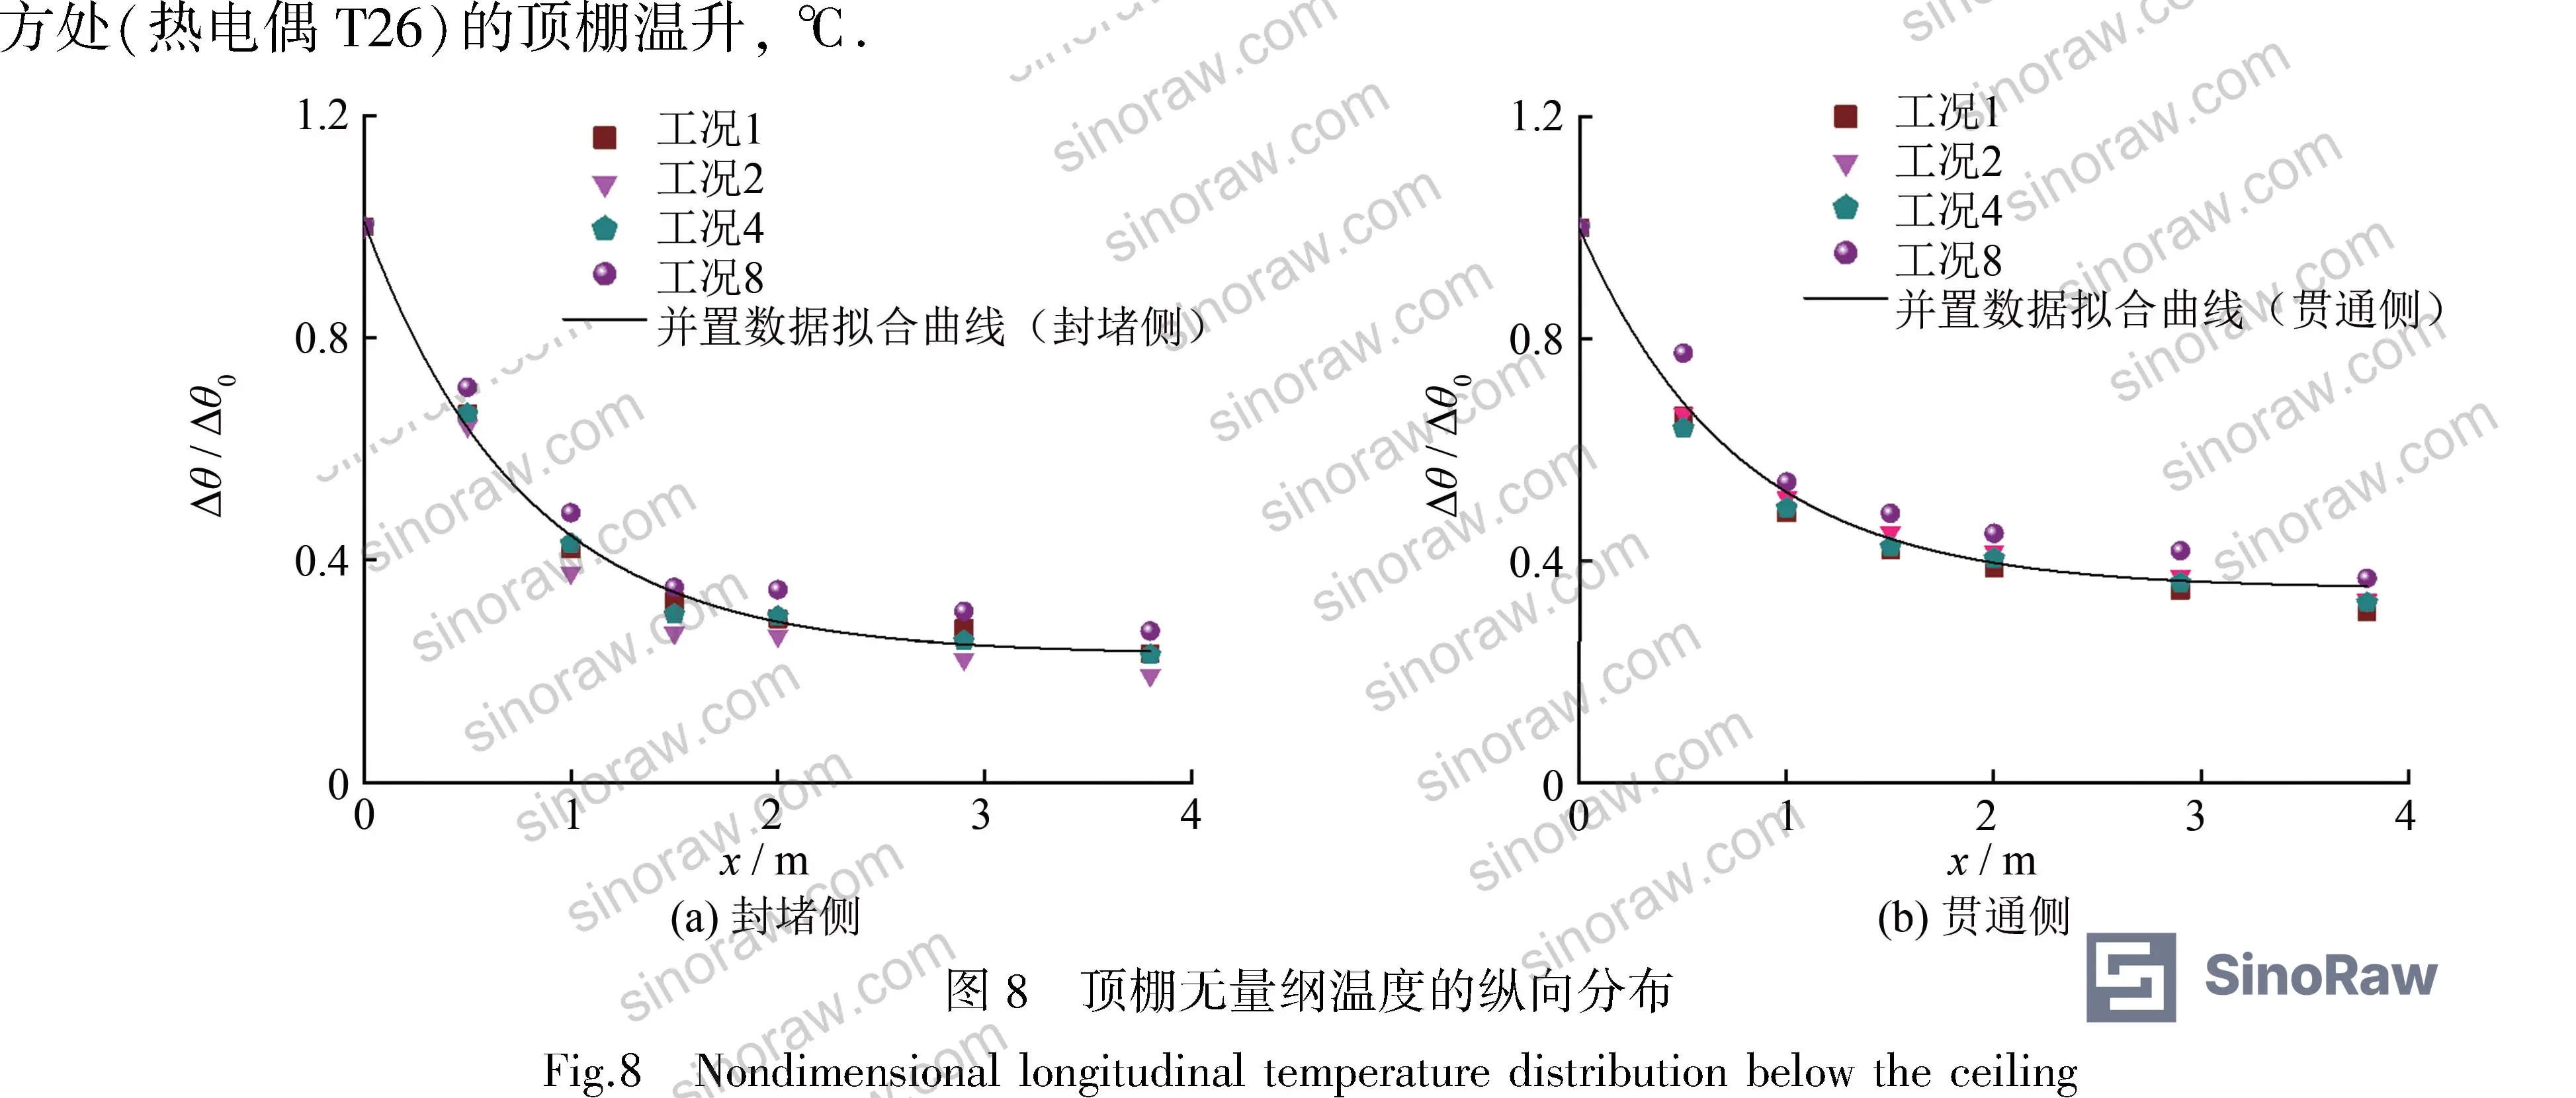
The sealed portal end (封堵端) accelerates longitudinal temperature decay compared to the open end. Hot smoke that travels toward the sealed wall rebounds, mixes with cooler entrained air, loses heat through increased wall contact, and results in lower ceiling temperatures at equivalent distances from the fire source compared to the open portal side. The fitted decay models from the experimental data are:
- Sealed portal side: ΔΘ/ΔΘ₀ = 0.78 × exp(−0.77x) + 0.23 (valid for 0 ≤ x ≤ 4 m)
- Open portal side: ΔΘ/ΔΘ₀ = 0.65 × exp(−decay coefficient × x) + 0.35 (valid for 0 ≤ x ≤ 4 m)
Where x is the distance from the fire source centerline (m) and ΔΘ₀ is the maximum ceiling temperature rise directly above the fire source.
The practical implication: if you’re specifying heat-sensitive labels, cable identification markers, or thermal barrier coatings for installation within 1–2 m of a sealed tunnel end, the thermal exposure envelope is different from the open-end specification — and not in the safer direction immediately adjacent to the fire. Any supplier claiming a single temperature rating covers the whole tunnel length is either oversimplifying or hasn’t tested in a confined geometry.
For buyers sourcing Sealing & Thermal materials for utility tunnel applications, the asymmetric decay profile means your temperature resistance specification needs to account for both portal conditions, not just the peak case.
Honestly, most procurement teams over-specify the sealed-end temperature resistance and under-specify the open-end sustained exposure duration. The open portal side maintains higher temperatures further from the fire source because hot smoke exits preferentially in that direction — sustained exposure at moderate temperatures can degrade materials that pass a short-duration peak temperature test.
Maximum Ceiling Temperature Rise Prediction and Cable Combustion Parameters #
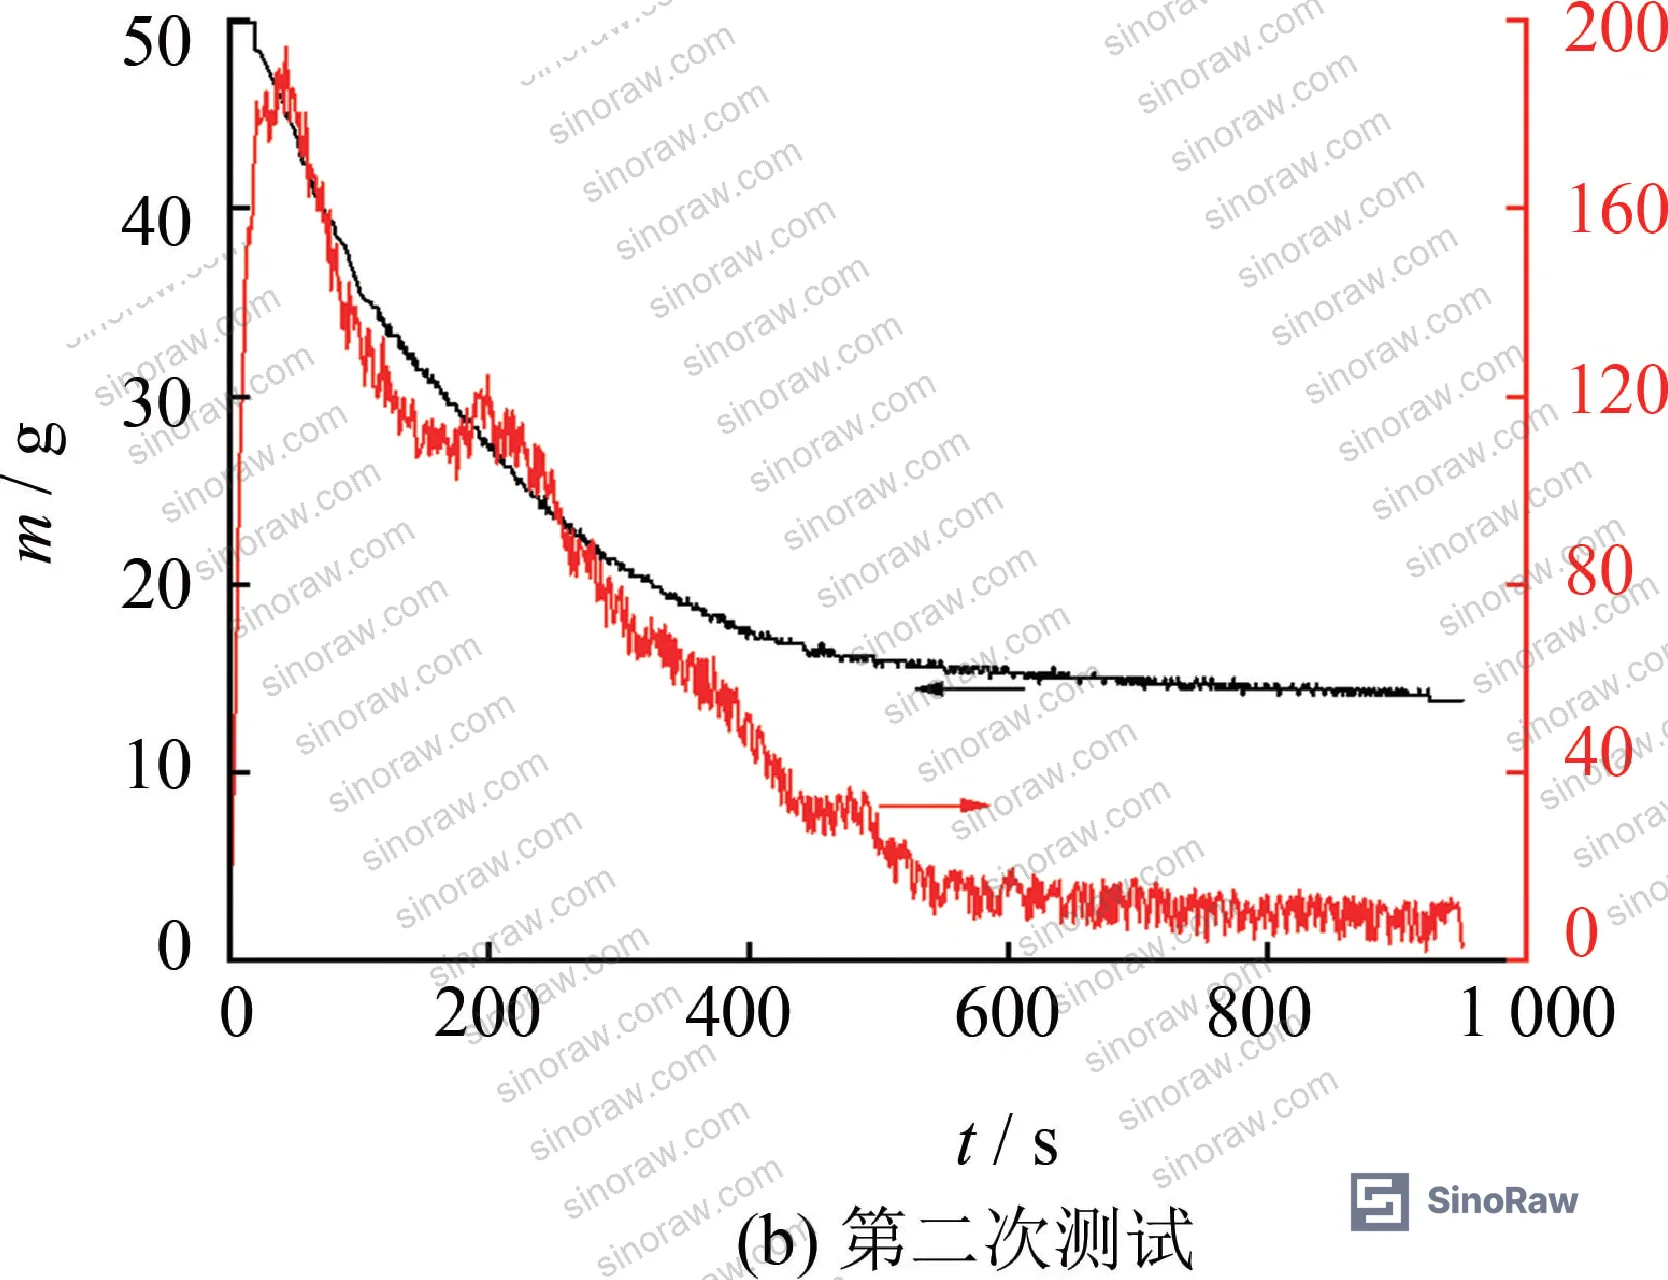
The prediction model for maximum ceiling temperature rise is built on two cable combustion parameters that every cable supplier should be able to provide: maximum heat release rate and maximum flame height.
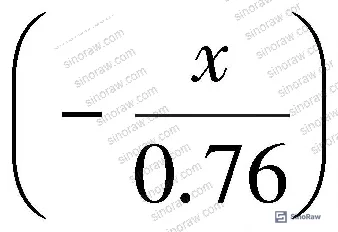
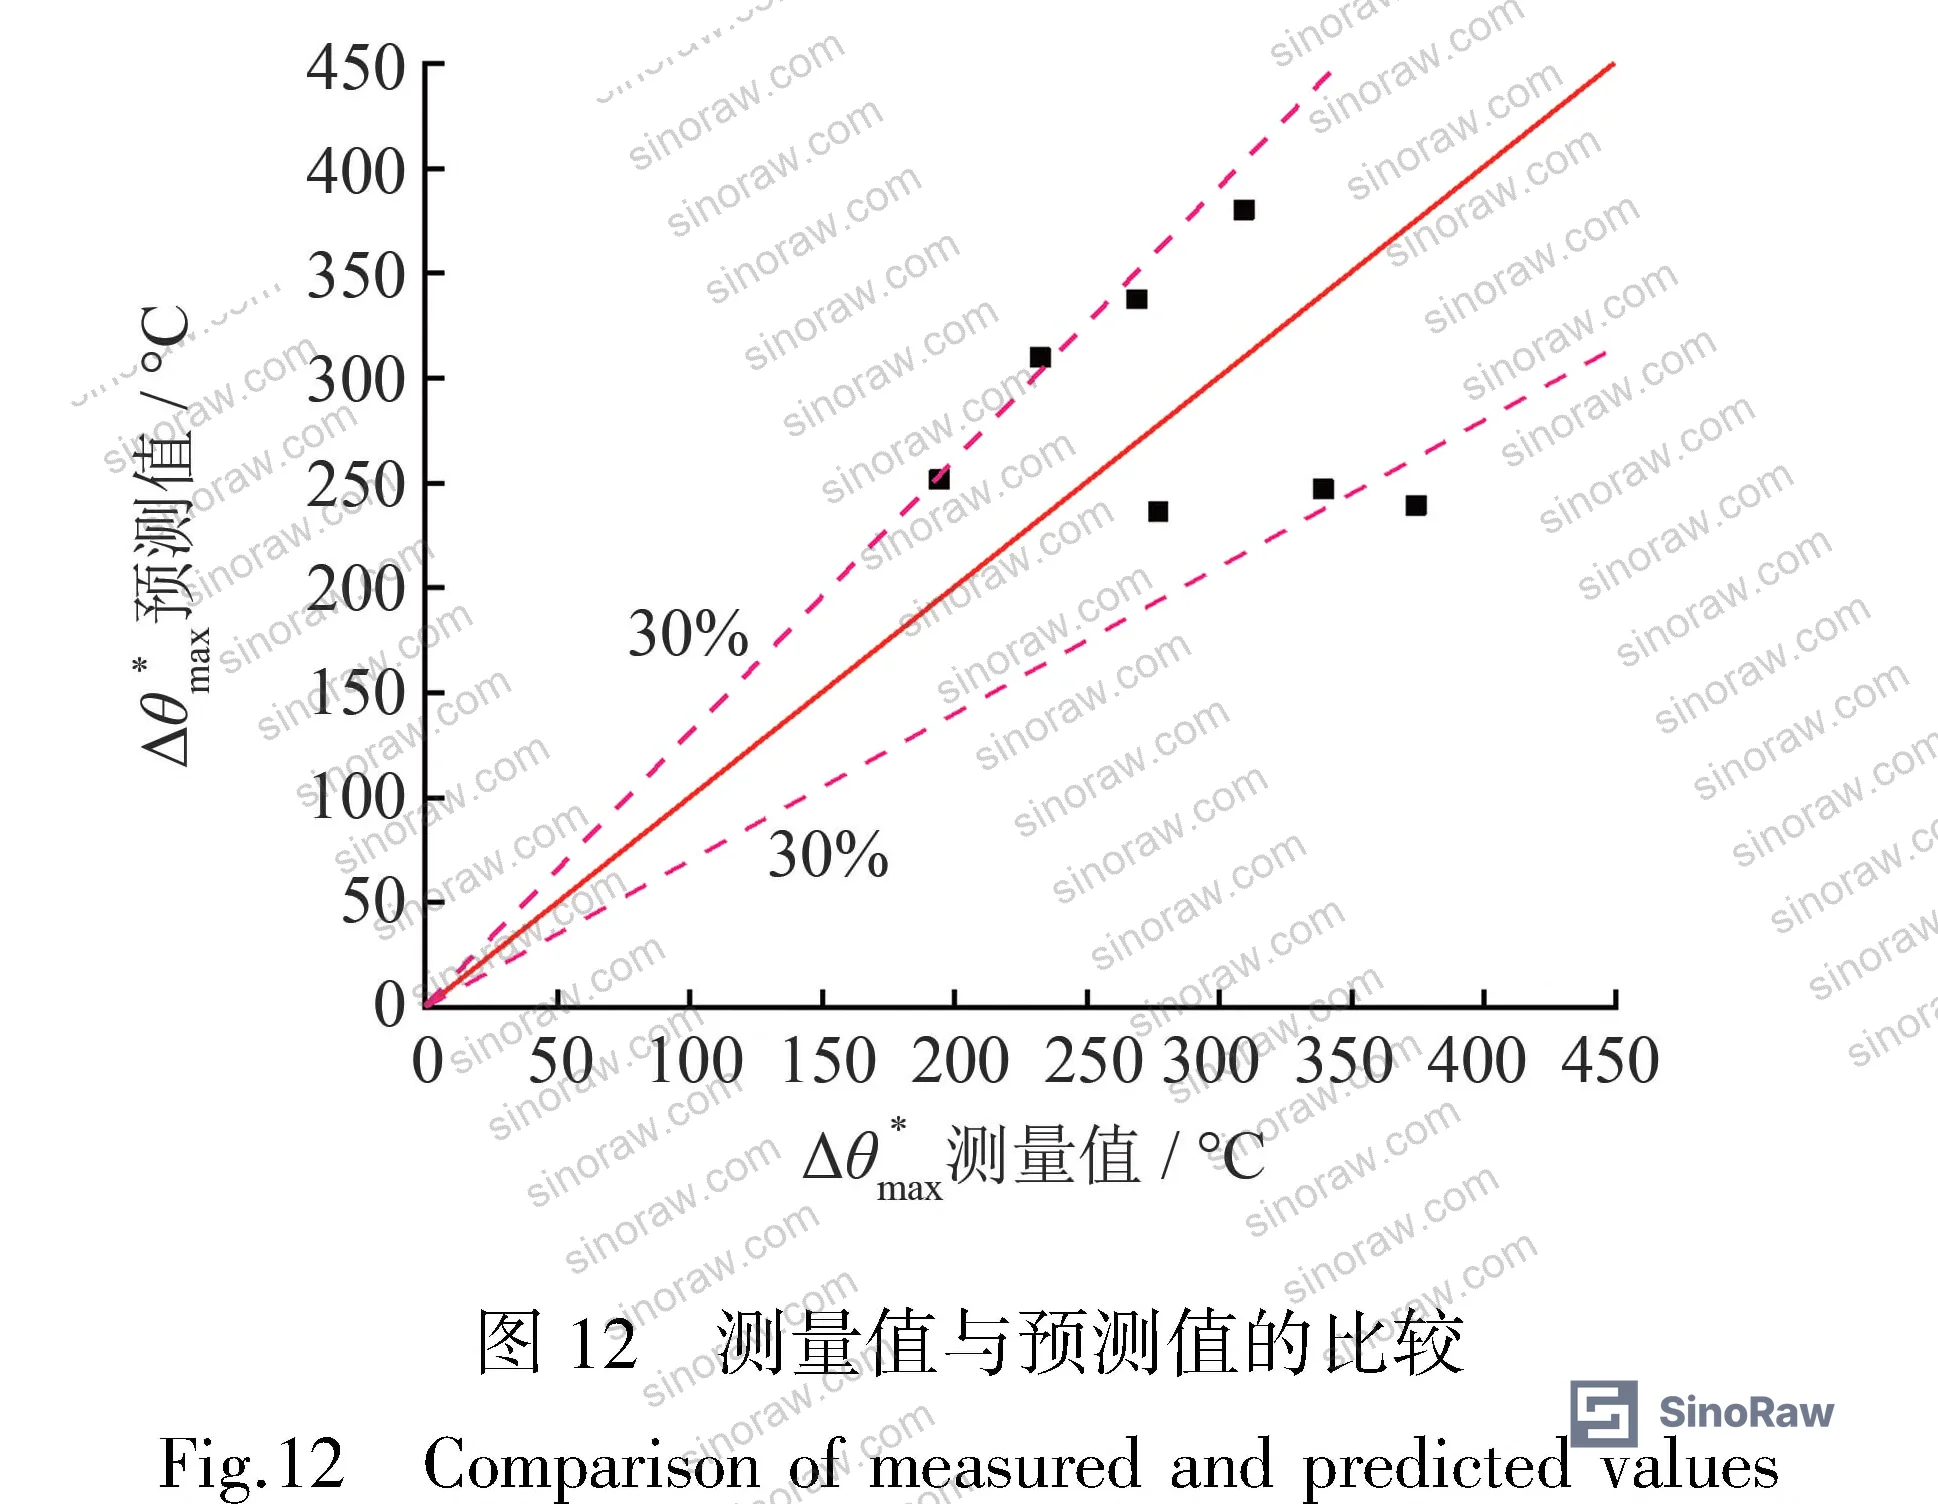
For the seven analyzable test conditions (excluding cases 3 and 9 where flame contact with the ceiling was observed and the model’s assumptions break down), the prediction model achieved errors ranging from 14.73% to 36.07% across all conditions. All errors remained within 37%. The minimum error of 14.73% occurred under mid-range fire loading conditions.
The cable combustion dataset from the nine test conditions produced these key experimental values:
| Test Case | Max Mass Loss Rate (g/s) | Max Heat Release Rate (kW) | Max Flame Height (m) | Effective Height He (m) |
|---|---|---|---|---|
| Condition 1 | 2.22 | 29.46 | 1.58 | 0.85 |
| Condition 2 | 4.61 | 61.17 | 1.92 | 1.19 |
| Condition 4 | 2.62 | 34.77 | 1.69 | 0.81 |
| Condition 5 | 5.06 | 67.15 | 2.12 | 1.24 |
| Condition 6 | 2.85 | 37.82 | 1.85 | 0.81 |
| Condition 7 | 5.54 | 73.52 | 2.41 | 1.37 |
| Condition 8 | 3.75 | 49.76 | 2.04 | 0.85 |
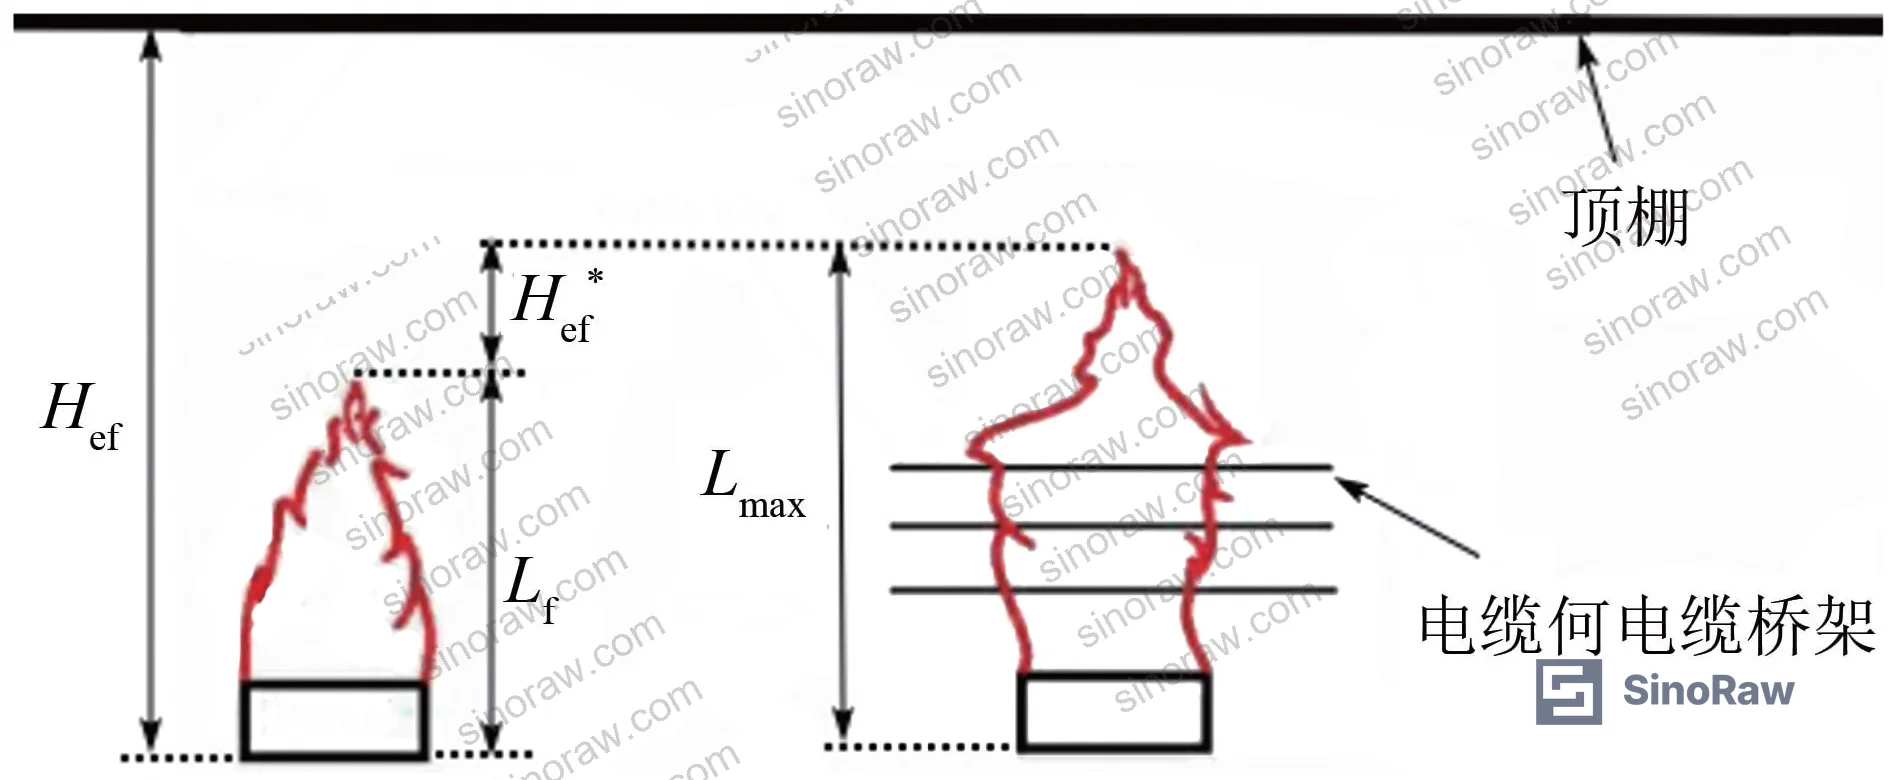
The fire source pool dimensions ranged from 30×20 cm to 30×50 cm, producing base fire powers of 28 kW, 45 kW, 65 kW, and 87 kW. Average flame heights for the pool fire alone ranged from 0.73 m to 1.19 m.
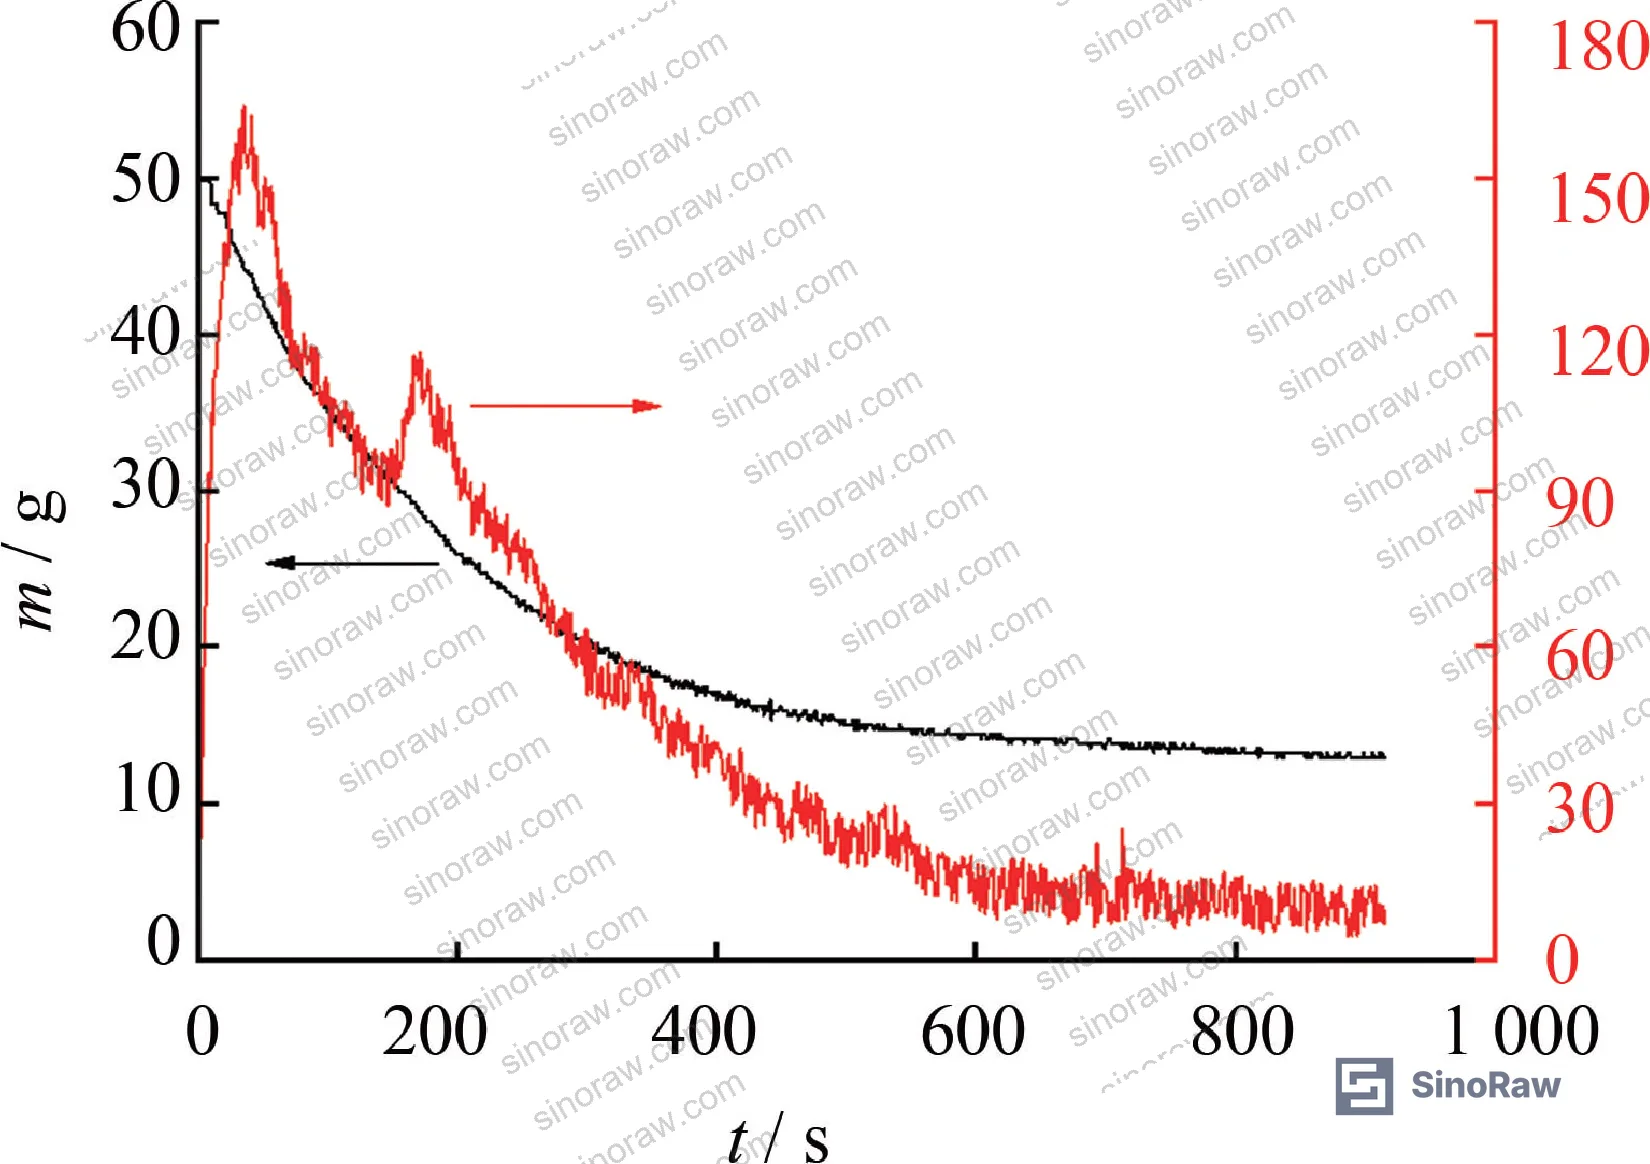
In supplier qualification, we saw combustion data inconsistencies that matter: effective heat of combustion values for nominally identical cable compounds varied by over 20% between supplier batches (11.81 vs. 14.73 kJ/g from two replicate cone calorimeter runs on the same cable sample). That spread directly affects the calculated maximum heat release rate and therefore the ceiling temperature prediction. If your supplier can’t hold ±10% on effective heat of combustion across production batches, your fire protection design margins are eroding in ways you can’t see on a certificate.
Most procurement teams don’t realize that fire performance classifications for cables in Chinese standards are typically based on open-air test configurations, not confined tunnel geometries. The confined space amplifies thermal feedback to the cable — flame spread accelerates, heat release rate increases, and the effective ceiling height above the fire reduces as multi-layer trays carry fire upward. A cable with an acceptable open-air fire classification may perform significantly worse in a real tunnel installation. This is an area where Chinese manufacturers are increasingly ahead of some international competitors in test methodology, partly because the utility tunnel buildout in China has driven real full-scale experimental programs at research institutions.
Compliance with ISO 9001:2015 Quality management systems is a starting point for supplier qualification, but it tells you nothing about batch-to-batch combustion performance consistency. You need process capability data on heat of combustion, not just a quality certificate.
For cable insulation and jacketing materials, REACH Regulation (EC) No 1907/2006 compliance is increasingly required by European-market buyers sourcing from Chinese manufacturers — particularly for halogenated flame retardant packages. The fire performance gains from certain halogen-based flame retardants need to be weighed against REACH substance restrictions.
For cable tray systems destined for markets requiring full material traceability, RoHS Directive 2011/65/EU compliance documentation for metallic tray components (particularly surface coatings) is a standard audit requirement that many Chinese tray manufacturers can provide but may not include in a default quotation package.
Practical Guidance for Buyers #
When you’re writing the technical requirements for a cable tray fire protection RFQ targeting utility tunnel applications, anchor your specifications to measured combustion parameters, not product category labels.
The minimum data package you should request from any candidate supplier includes: cone calorimeter test report showing effective heat of combustion (tested at 35 kW/m² per relevant standard), maximum heat release rate per unit area, batch-to-batch variation data (minimum 3 lots), and flame height data under the tray loading density you intend to deploy.
For the fire barrier films, intumescent coatings, or thermal insulation materials that go alongside the cables and trays, specify temperature resistance based on the ceiling jet layer exposure conditions — not bulk tunnel average temperature. The ceiling zone within 0.25 m of the tunnel roof will see the highest thermal loading, and materials rated only to average conditions will fail faster than your design anticipates.
Cable arrangement density matters more than most buyers realize. Loose cable arrangement significantly promotes upward flame travel versus tight bundling, which favors horizontal spread. The fire scenario that produces the highest ceiling temperature is not always the highest absolute fire power — it depends on tray loading and cable spacing. Make sure the test condition in the supplier’s data sheet actually represents your installation geometry.
Sinoraw.com is a Guangzhou-based sourcing service connecting overseas procurement engineers with verified Chinese manufacturers across industrial and packaging material categories — if you’re working through the supplier identification phase for this category, our team can help you shortlist manufacturers with the right test data infrastructure already in place.
Need help identifying qualified suppliers for fire-rated cable tray systems and tunnel thermal barrier materials? Talk to our sourcing team →
Supplier Qualification Questions #
- Can you provide cone calorimeter test data (tested at 35 kW/m² heat irradiance) showing the effective heat of combustion for your cable insulation compound, with batch-to-batch variation data across a minimum of three production lots — and does that variation stay within ±10% of the reported mean value?
- What is the maximum heat release rate per unit area (kW/m²) measured for your cable product under cone calorimeter conditions, and can you confirm this was measured on a sample prepared to represent the as-installed cable bundle density in a multi-layer tray configuration?
- For your cable tray system rated for utility tunnel installation, has flame height behavior been measured under loose cable arrangement (松散布置) conditions, which represent the worst-case upward flame propagation scenario — and if so, what is the maximum recorded flame height (Lmax) at your rated fire load?
- What is the certified average effective heat of combustion value for your cable jacket compound, and can you demonstrate that both duplicate test runs (as per two-run replication protocol) fall within ±15% of each other — noting that a spread of 11.81 to 14.73 kJ/g between replicates represents a 20% inter-run variation that may exceed design margins?
- Has your cable or tray system been tested in a confined tunnel geometry (not open-air), and do you have ceiling temperature rise data or fire test data from a sealed-portal test configuration to support the claimed fire performance in utility tunnel applications where smoke stratification produces asymmetric thermal loading between sealed and open ends?
Sourcing Checklist #
- ☐ Supplier provides cone calorimeter test report at 35 kW/m² with effective heat of combustion ≥ 11 kJ/g and ≤ 15 kJ/g reported as the mean across replicate runs
- ☐ Batch-to-batch variation in effective heat of combustion documented across ≥3 production lots with inter-batch spread ≤ ±15% of stated mean value
- ☐ Maximum heat release rate data available from confined-geometry or equivalent tunnel fire test (not only open-air rating)
- ☐ Flame height data provided for loose cable arrangement (worst-case upward flame propagation) under the specified cable tray loading density
- ☐ Cable jacket/insulation compound confirmed REACH compliant with substance disclosure for halogenated flame retardant package per REACH Regulation (EC) No 1907/2006
- ☐ Supplier holds ISO 9001:2015 certification with documented process controls covering combustion additive dosing and jacketing compound formulation consistency
- ☐ Temperature resistance rating of any associated barrier film or intumescent coating specified for the ceiling jet zone (≤0.25 m from tunnel ceiling), not bulk tunnel ambient
Key Specifications Table #
| Parameter | Recommended Value | Verification Method |
|---|---|---|
| Effective heat of combustion (cable insulation) | 11.81–14.73 kJ/g (mean: 13.27 kJ/g target) | Cone calorimeter at 35 kW/m² heat irradiance, two-run replication per sample |
| Ceiling jet thermal zone depth | ≤0.25 m below ceiling surface | Thermocouple tree vertical profiling; classify as ceiling jet if temperature rise exceeds transition layer threshold |
| Longitudinal temperature decay (sealed portal side) | Follows ΔΘ/ΔΘ₀ = 0.78·exp(−0.77x) + 0.23 within x = 0–4 m | Thermocouple array at 40 mm below ceiling, 13 measurement points along tunnel axis |
| Maximum ceiling temperature prediction error | ≤37% vs. experimental measurement (minimum 14.73%) | Validated against 7 of 9 test conditions; conditions with flame-ceiling contact excluded from model scope |
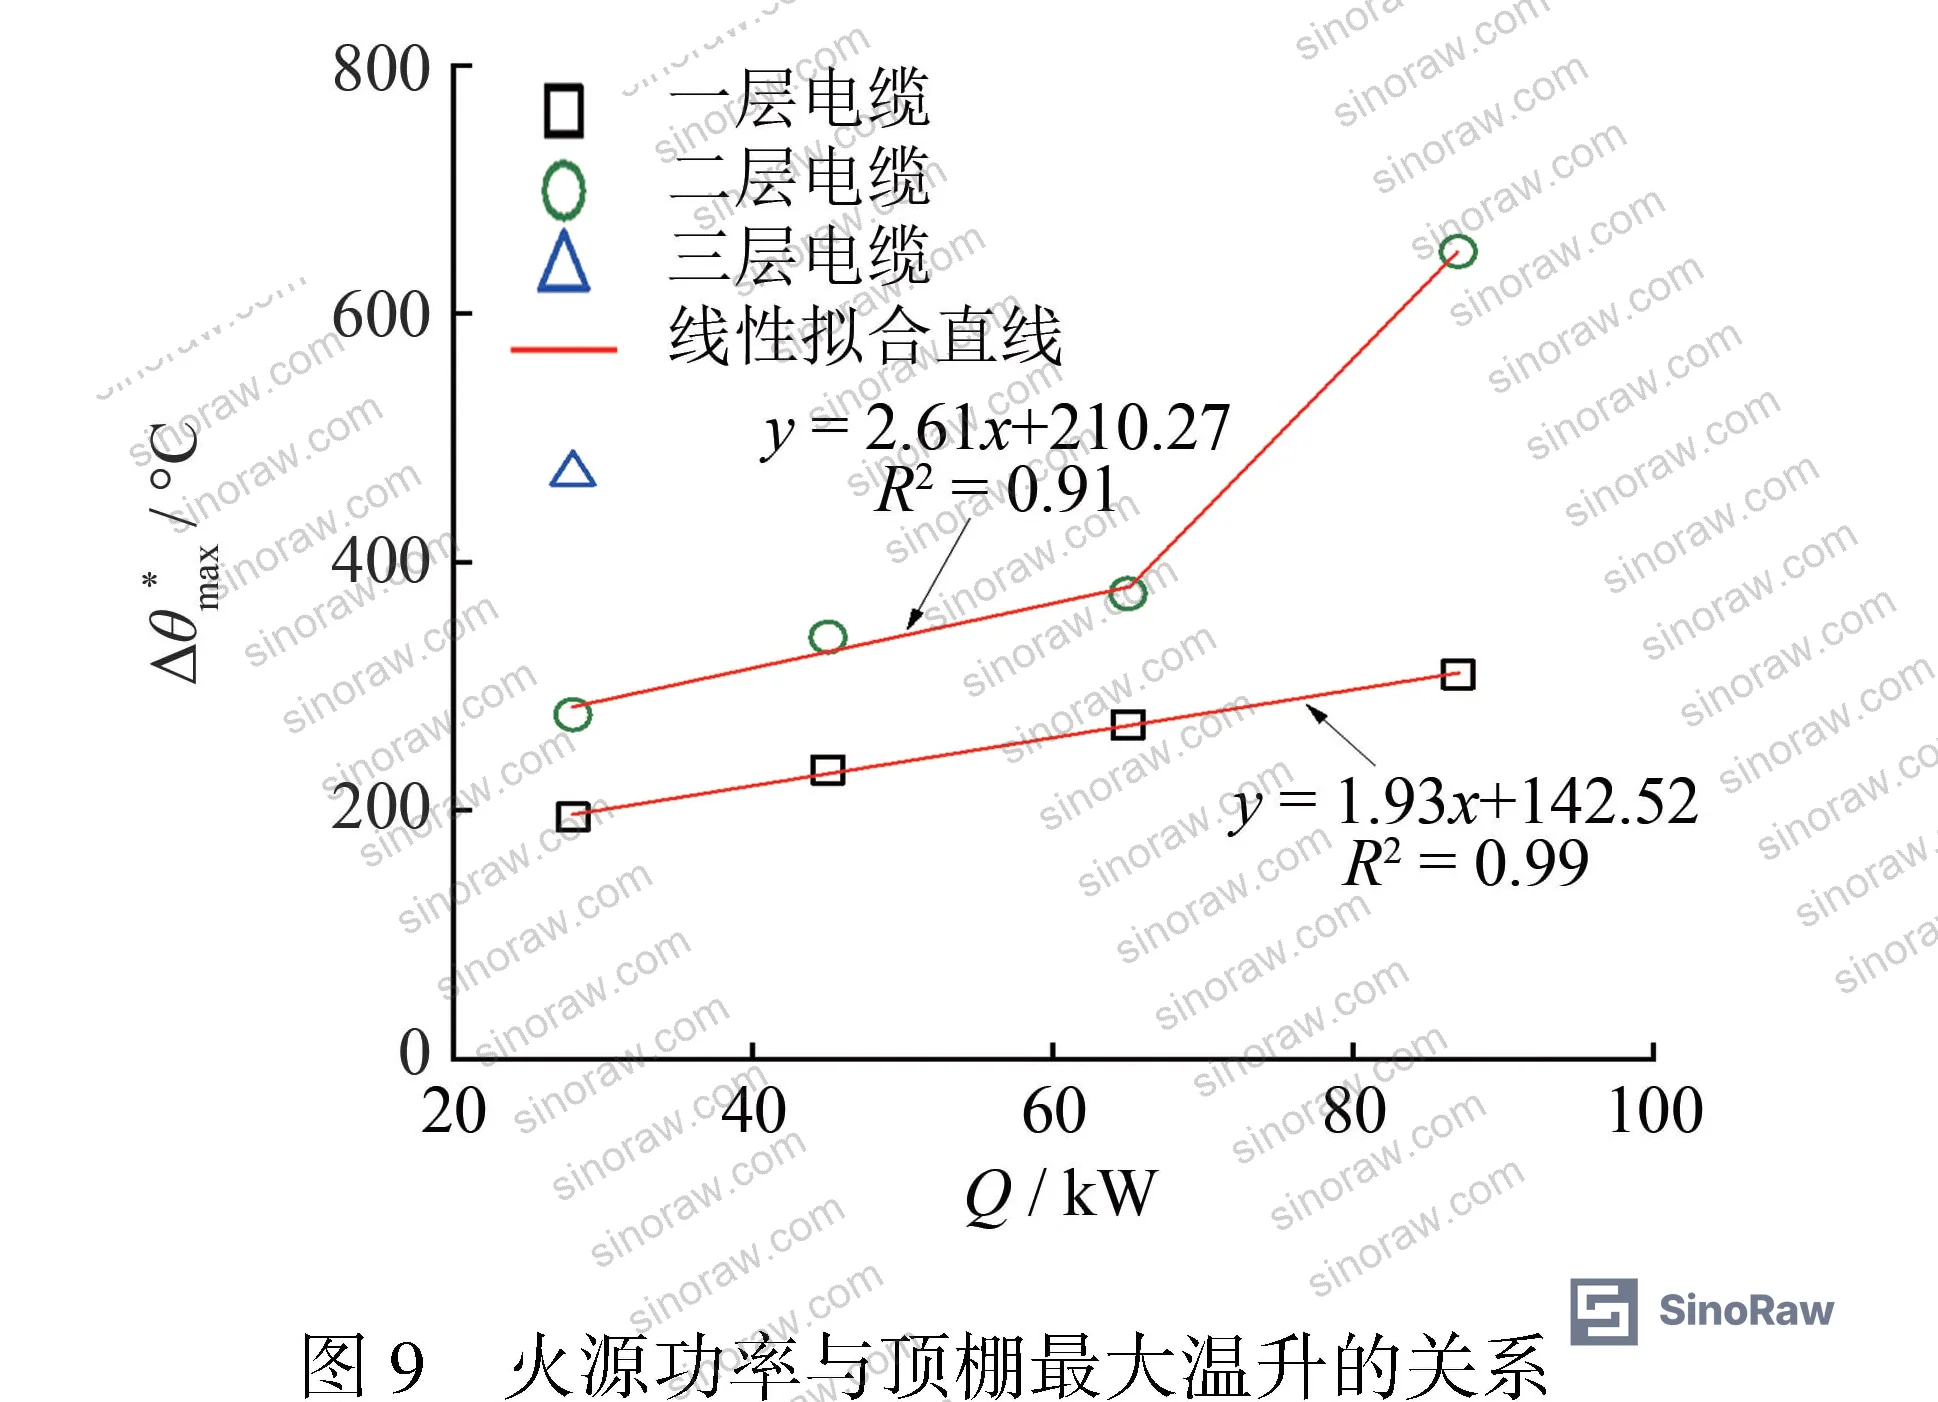
| Fire source power range for linear ceiling temperature response | ≤65 kW (1–2 cable tray layers) | Cone calorimeter + tray fire experiment; linearity confirmed for weak-plume ceiling jet regime |
| Cable tray effective height parameter (He) | 0.81–1.37 m (measured range across test conditions) | Calculated as max flame height (Lmax) minus pool fire baseline flame height (Lf); Lf range 0.73–1.19 m |
Can’t find a supplier meeting these specs? Submit your requirements and we’ll match you within 48 hours.
References #
Data source: Temperature Field Distribution Characteristics of Cable Tray Fires in Confined Utility Tunnel Environments, H. Yu et al., Fire Safety Journal, 2023
Frequently Asked Questions #
What are the three thermal zones produced by a cable tray fire in a utility tunnel, and where are their boundaries?
Full-scale tunnel testing identifies a ceiling jet layer (from ceiling down to 0.20–0.25 m), a hot smoke transition layer (0.25 m to 0.70–0.80 m below ceiling), and a cold air layer below 0.70–0.80 m. These boundaries were consistent across fire source powers ranging from 28 to 87 kW and 1–3 cable tray layers.
Why does the sealed portal end of a utility tunnel show faster ceiling temperature decay than the open end?
Hot smoke flowing toward the sealed wall rebounds off the end surface, thickens the smoke layer, increases wall contact area, and loses heat through that additional contact — while shear mixing with cooler air adds further thermal loss. At equivalent distances from the fire, ceiling temperatures on the sealed side are lower than on the open portal side. This asymmetry needs to be accounted for in fire detection placement and thermal barrier material selection.
What cone calorimeter test conditions should I specify when requesting combustion data from a cable supplier?
Specify a heat irradiance level of 35 kW/m² — this is the condition used in the full-scale tunnel validation experiments. Require that the test be repeated twice on separately prepared samples, and that the reported effective heat of combustion is the average of both runs. A spread greater than 15% between the two runs should trigger a conversation about production consistency.
Is a cable fire performance rating from open-air testing sufficient for a utility tunnel specification?
No, and this is one of the most common specification errors in tunnel cable procurement. Confined geometry increases thermal feedback to the cable, accelerates flame spread in loose-arrangement tray configurations, and produces ceiling jet temperatures significantly higher than open-air test conditions would predict. Require that at least some of the supplier’s test data was developed in a confined or semi-confined geometry.
At what fire load does the ceiling temperature response stop being linear, and why does that matter for specification?
For single-layer cable trays, linearity holds across the full tested range. For two-layer trays, linearity holds up to approximately 65 kW fire source power. Above that threshold (and in the highest-load three-layer scenario), flames contacted the ceiling and the temperature response entered a strong-plume regime that the standard model no longer predicts accurately. If your installation uses three cable tray layers at high cable density, the standard ceiling temperature prediction model underestimates actual ceiling exposure — build in additional design margin.
Published by sinoraw.com Technical Team | Request a sourcing quote


