

TL;DR #
In controlled broadband dielectric response testing across five moisture levels, the low-frequency relaxation polarization loss peak value follows an exponential relationship with moisture content (R² = 0.99), making it the single most reliable non-destructive indicator of oil-paper insulation degradation. For buyers specifying oil-impregnated insulating paper or capacitor-core assemblies, this means standard 50 Hz power-frequency dissipation factor measurements alone are insufficient — suppliers who cannot provide FDS data across the 10⁻³ to 10⁴ Hz range are working blind on moisture qualification. Require broadband dielectric spectrum data covering at least seven decades of frequency before accepting any insulation paper lot for high-voltage bushing applications.
Overview #
Oil-paper insulation systems are not a commodity purchase, and procurement teams that treat them as one pay for it during commissioning. Bushing failures attributable to insulation moisture ingress account for 35% to 45% of all transformer electrical failures, and that proportion climbs as voltage class increases — which means the specification risk scales with your project’s criticality. Wet paper that passes a simple 50 Hz dissipation factor check has failed in service more times than anyone in this industry likes to admit.
The analysis summarized here was conducted at a state-level power research institute using laboratory-prepared oil-paper samples with precisely controlled moisture content, validated against a geometrically accurate scaled-down bushing capacitor core model. Samples spanned moisture mass fractions from below 0.5% (dry reference) through 1.48%, 3.06%, 4.21%, 5.67%, and 6.71% — achieved via controlled ambient absorption followed by Karl Fischer titration for precise moisture confirmation. Three moisture exposure scenarios were then modeled on the scaled bushing: uniform whole-body moisture, zero-screen localized moisture (inner layers), and end-screen localized moisture (outer layers). The frequency sweep covered 10⁻³ to 10⁴ Hz using two complementary instruments to ensure measurement integrity across the full band, with 140 discrete frequency points per sweep.
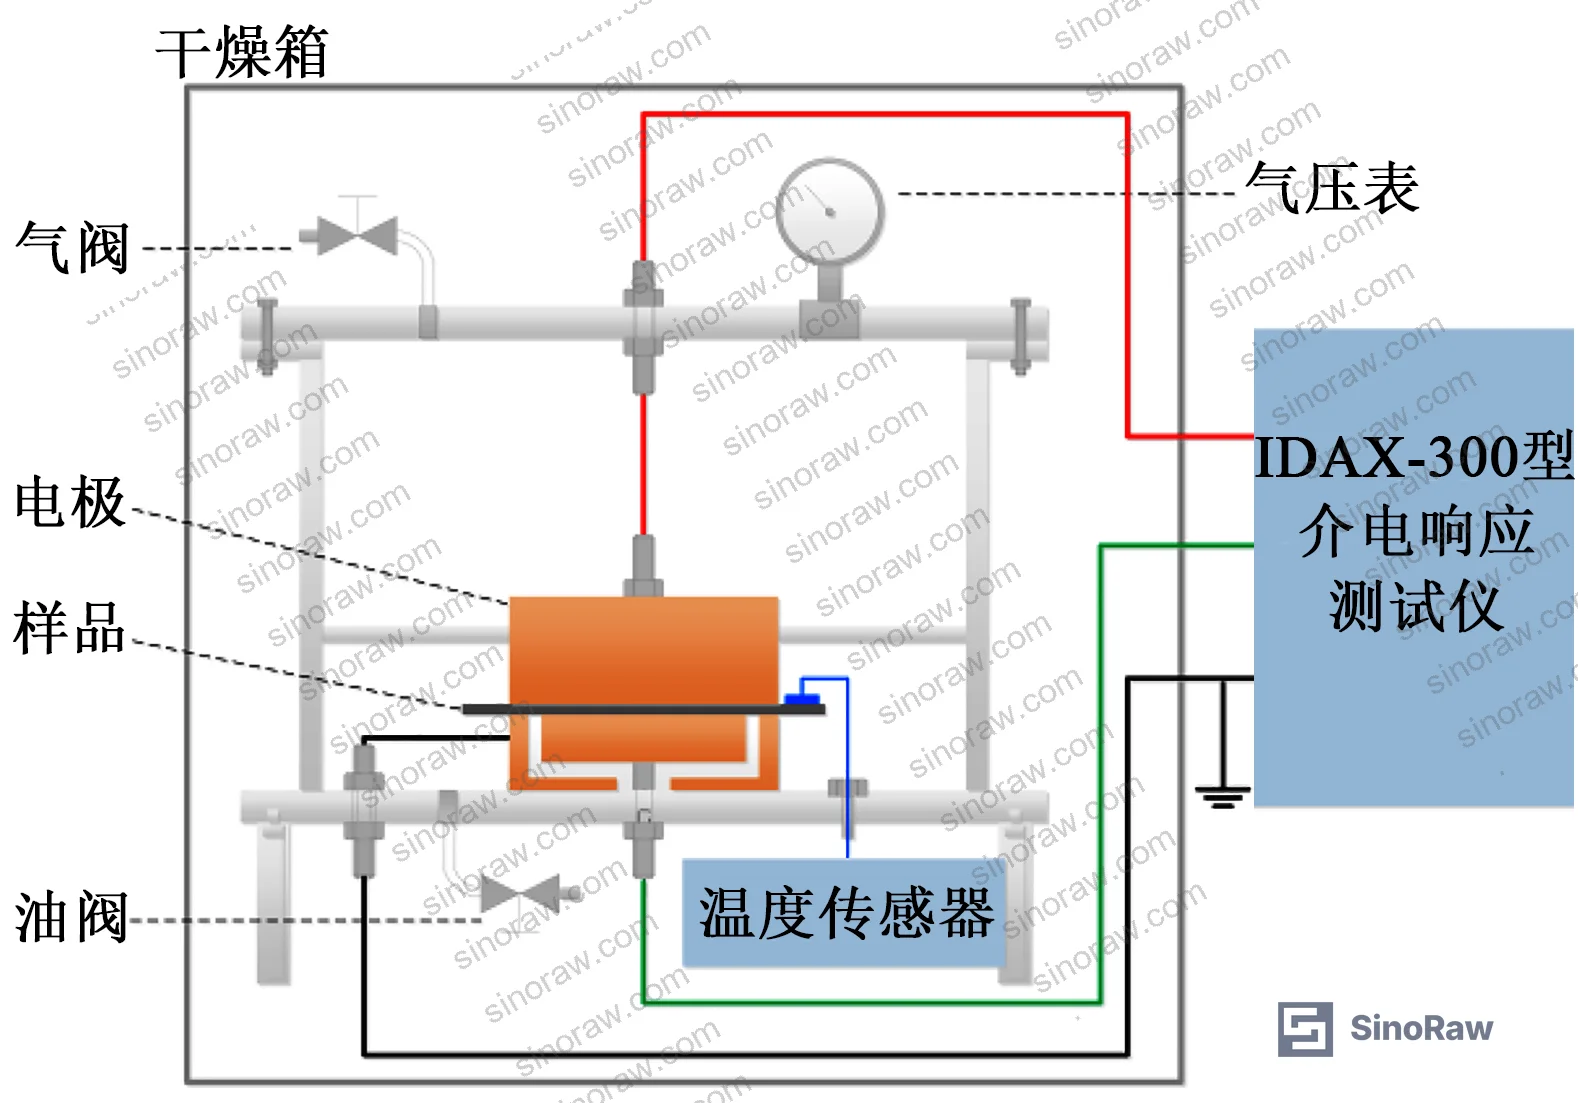
For buyers sourcing barrier films or insulating paper systems where moisture ingress is a qualification concern, the findings have direct implications for incoming inspection protocols. The methodology aligns with the broader trend toward non-destructive, frequency-domain evaluation — referenced in ISO 9001:2015 Quality management systems frameworks as a basis for process-based quality verification — which is gradually displacing single-point electrical tests in serious procurement specifications.
Broadband Dielectric Response of Oil-Paper Insulation: What the Frequency Spectrum Reveals #
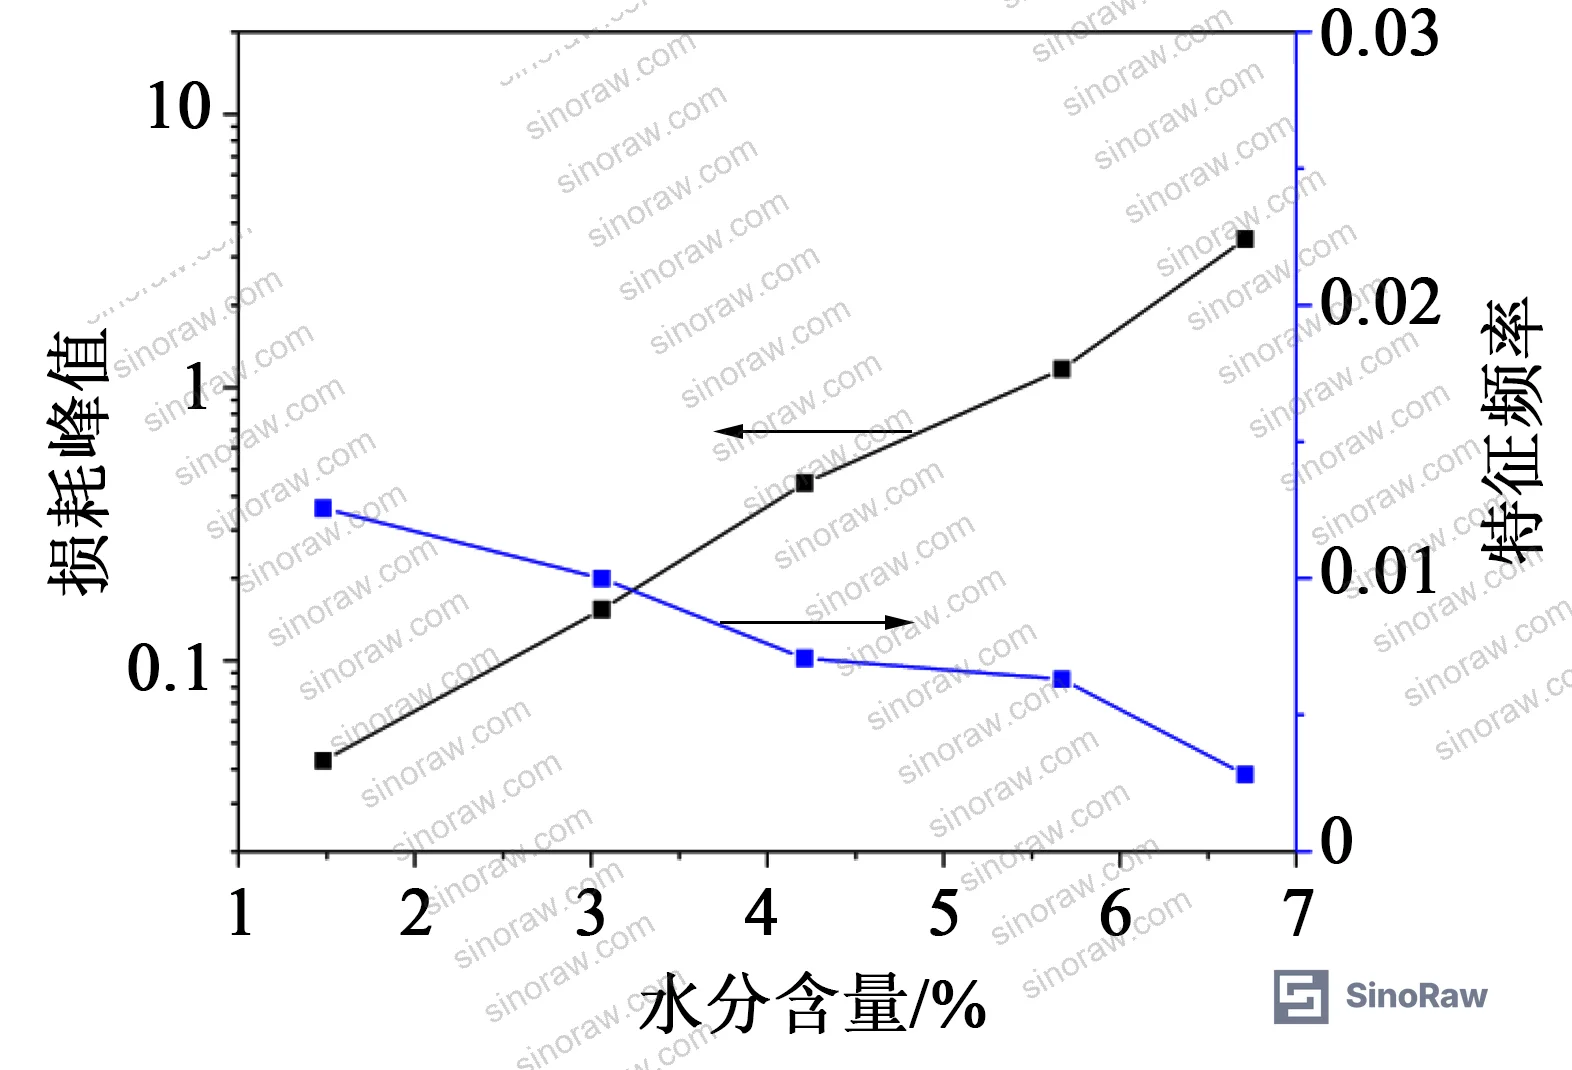
The core finding is straightforward once you understand what the frequency domain is showing you. At low moisture content, the dielectric loss spectrum shows a single relaxation polarization peak in the 10⁻³ to 10⁻¹ Hz range — this is polarization process 1, driven by trapped electron and hole space charge polarization, inherent to oil-paper composite insulation regardless of moisture level. As moisture increases, this peak’s amplitude grows exponentially and its characteristic frequency shifts slightly leftward (toward lower frequencies).
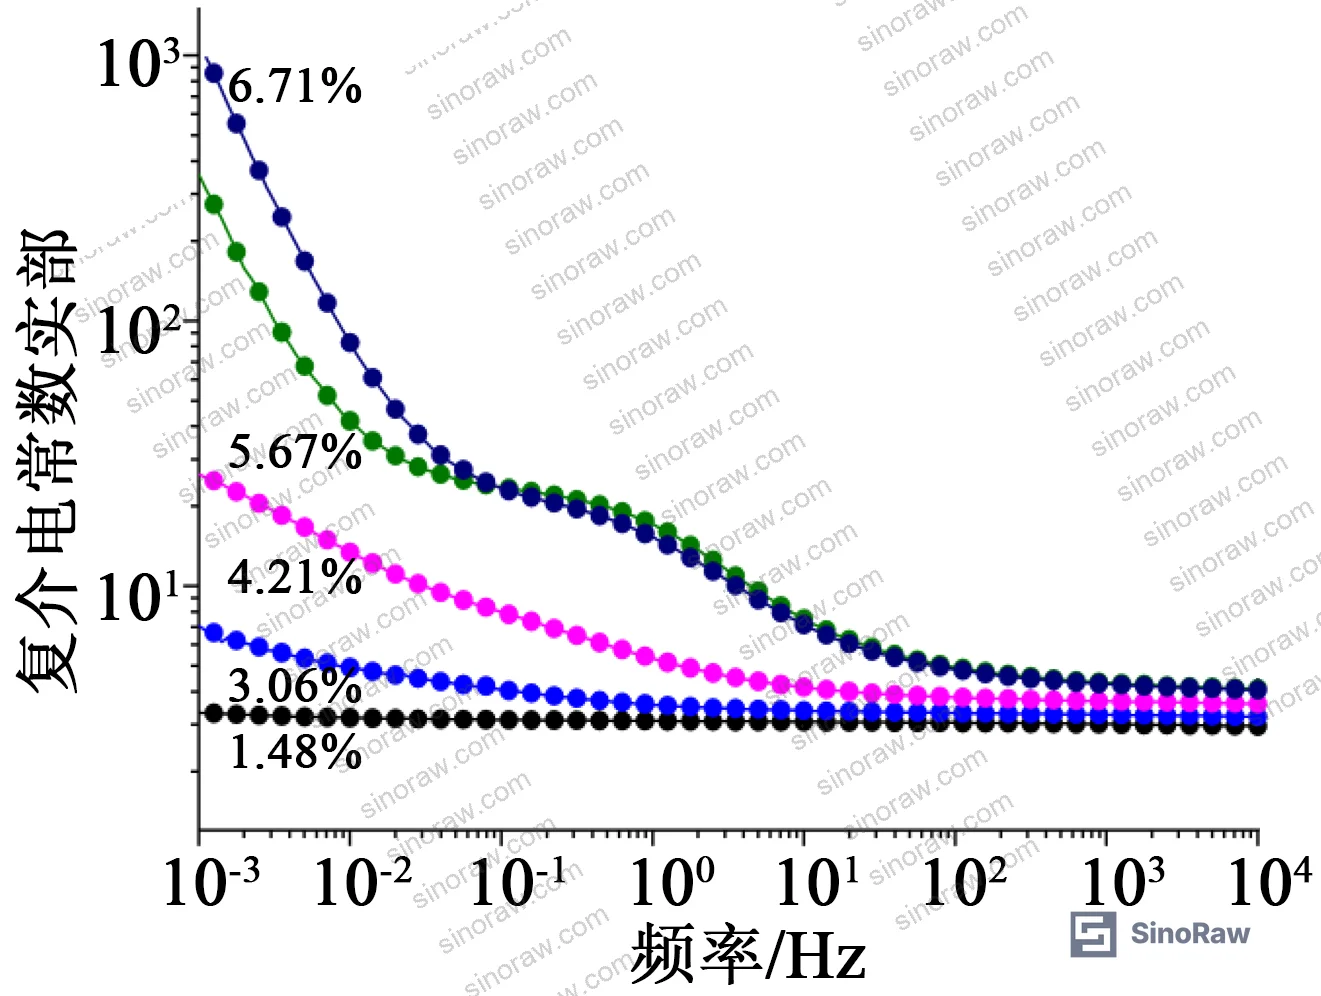
The critical threshold appears at 4.21% moisture by mass. Below this level, the spectrum shows only polarization process 1. Above 4.21%, a second distinct polarization process (process 2) emerges in the 10⁰ to 10¹ Hz range — attributed to free water that forms only after dissolved and adsorbed moisture states are saturated. This is not a gradual shift; it is a step change in behavior. The imaginary part of the complex permittivity shows a new “step-like” region in the 10² to 10² Hz range that is absent in drier samples.
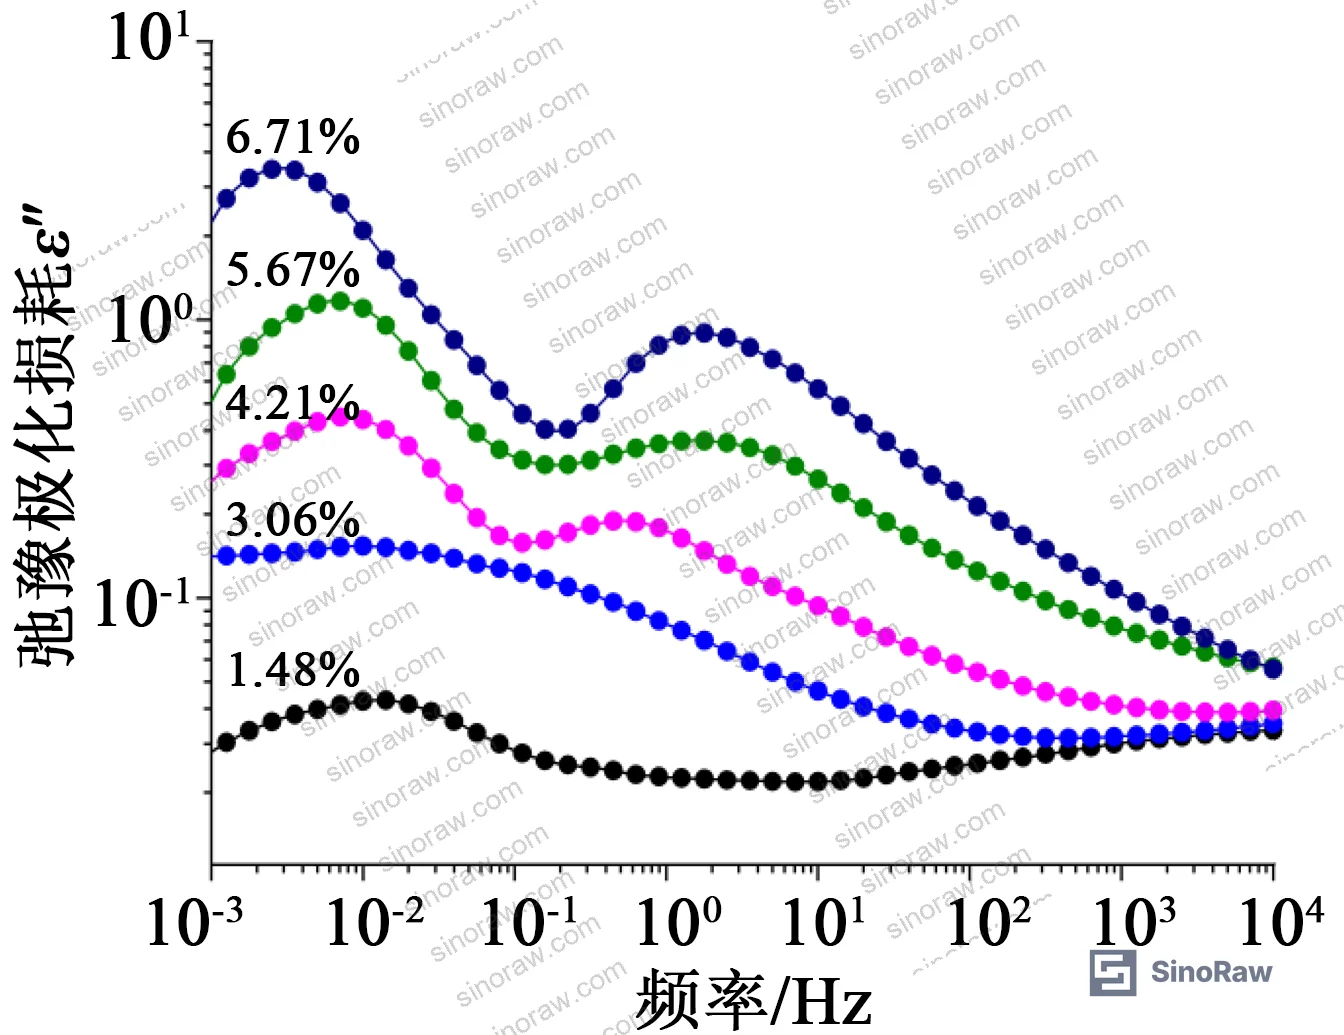
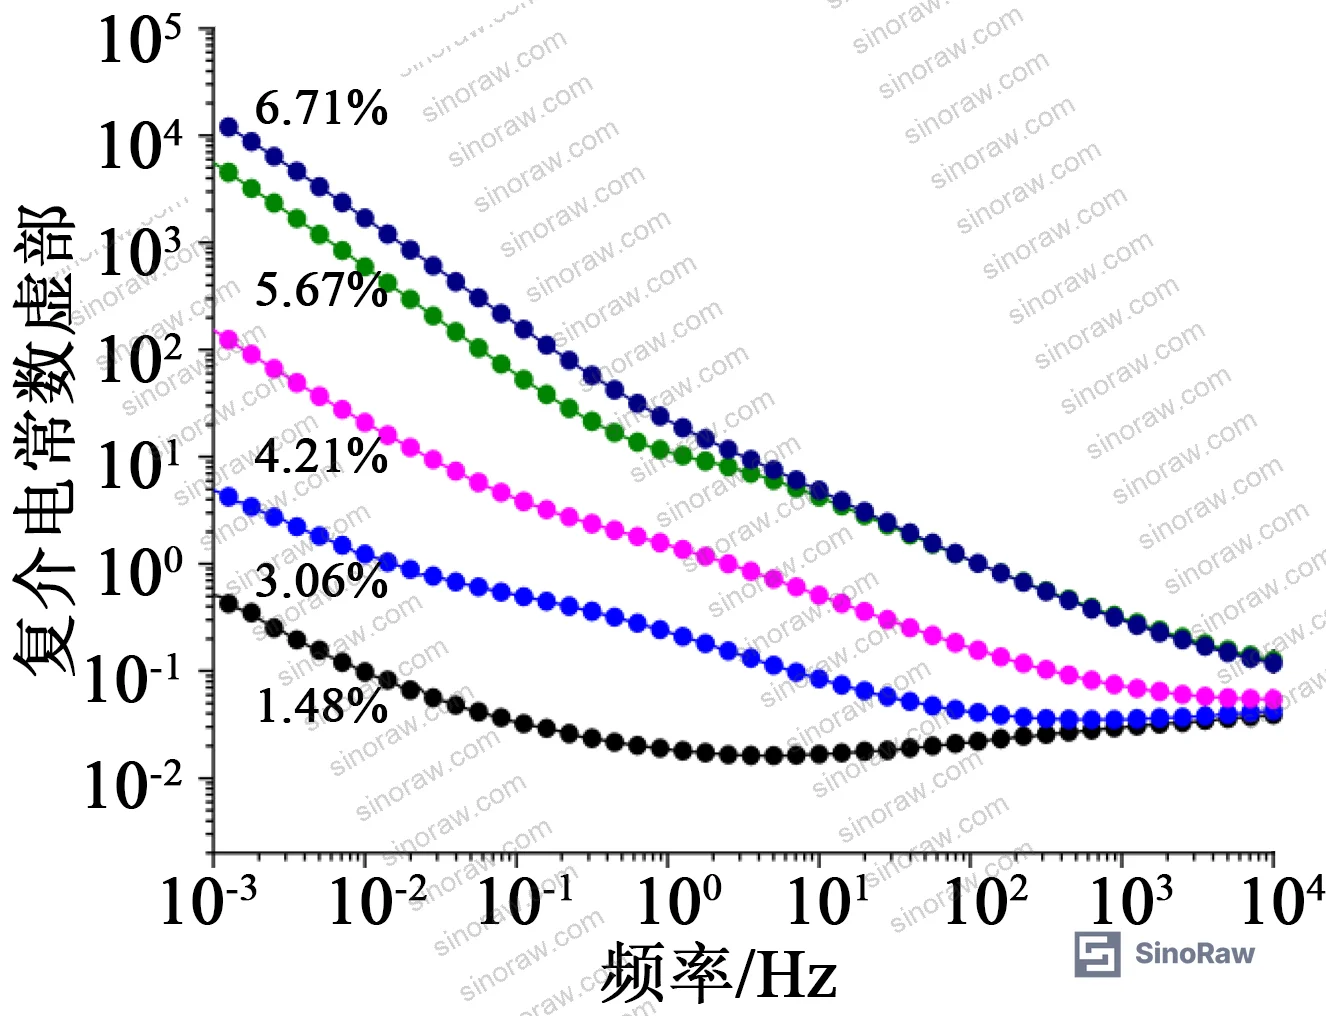
The quantitative relationship between the loss peak value of polarization process 1 (ε″peak1) and moisture mass fraction (m) was fitted as:
ε″peak1 = 0.0053 × e^(0.97 × m)
with R² = 0.99, confirming an extremely tight exponential correlation. The fitting constants a = 0.0053 and b = 0.97 were derived from the full five-point moisture series. The characteristic frequency of process 1 shows only a weak inverse correlation with moisture content — it is the peak amplitude, not the peak position, that carries the moisture signal reliably.
Polarization process 2, when present, shows both loss peak value and characteristic frequency increasing with moisture — but because it only appears above the 4.21% threshold, it serves as a qualitative indicator that free water is present in the insulating oil, not a quantitative moisture meter.
This has a direct implication for test specifications: measuring only at power frequency (50 or 60 Hz) misses both of these polarization processes entirely. The information exists in the spectrum. You just have to look for it.
Moisture Type Discrimination: Uniform vs. Localized Moisture in Bushing Capacitor Cores #
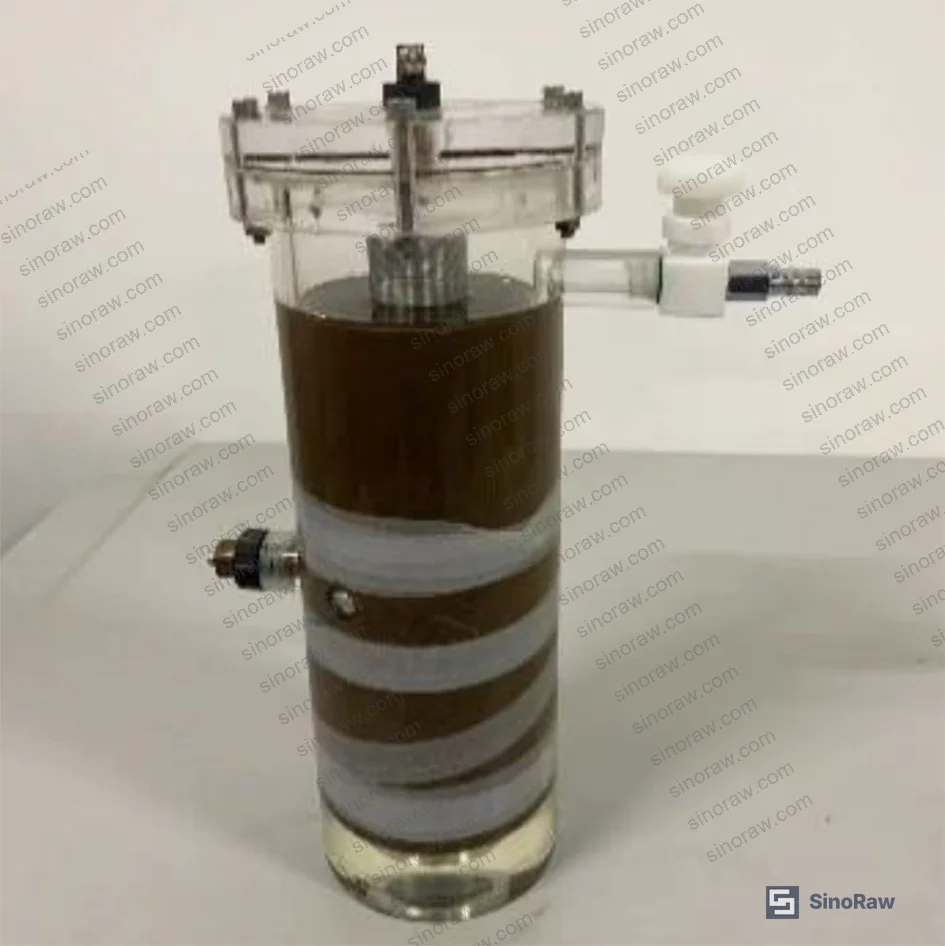
The scaled bushing model tested here followed “equal capacitance, equal grading step” design principles. The capacitor core had five insulation layers (layers 0–4) with foil screen lengths from 90 mm down to progressively shorter values, outer diameters from 93 mm to 45 mm, and insulation layer thicknesses of 6 mm each. Geometric capacitance C₀ was calculated as 1.27 × 10⁻¹¹ F.
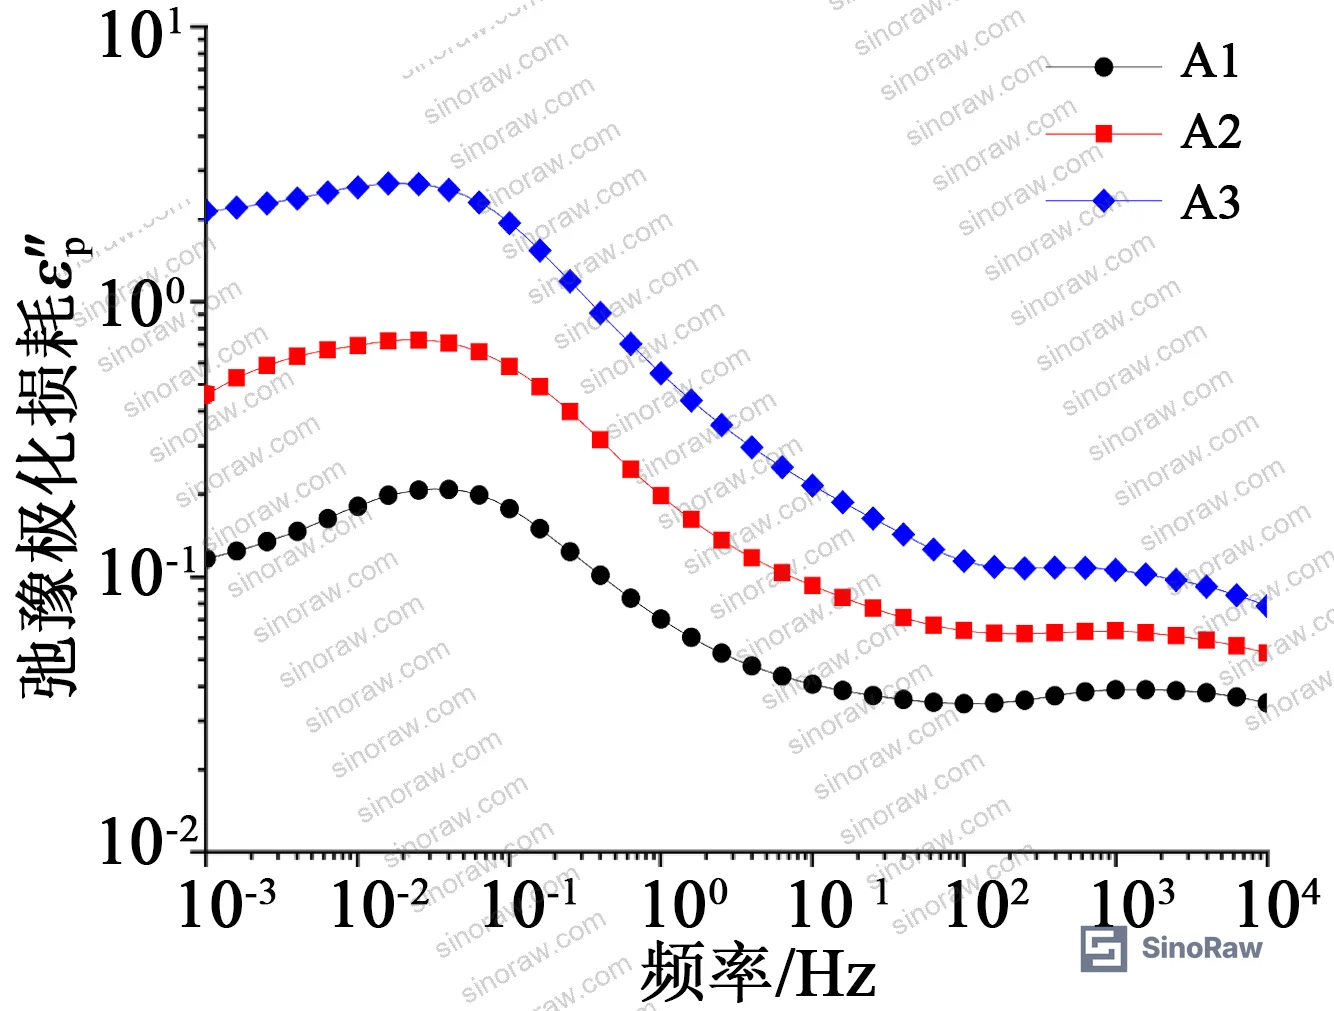
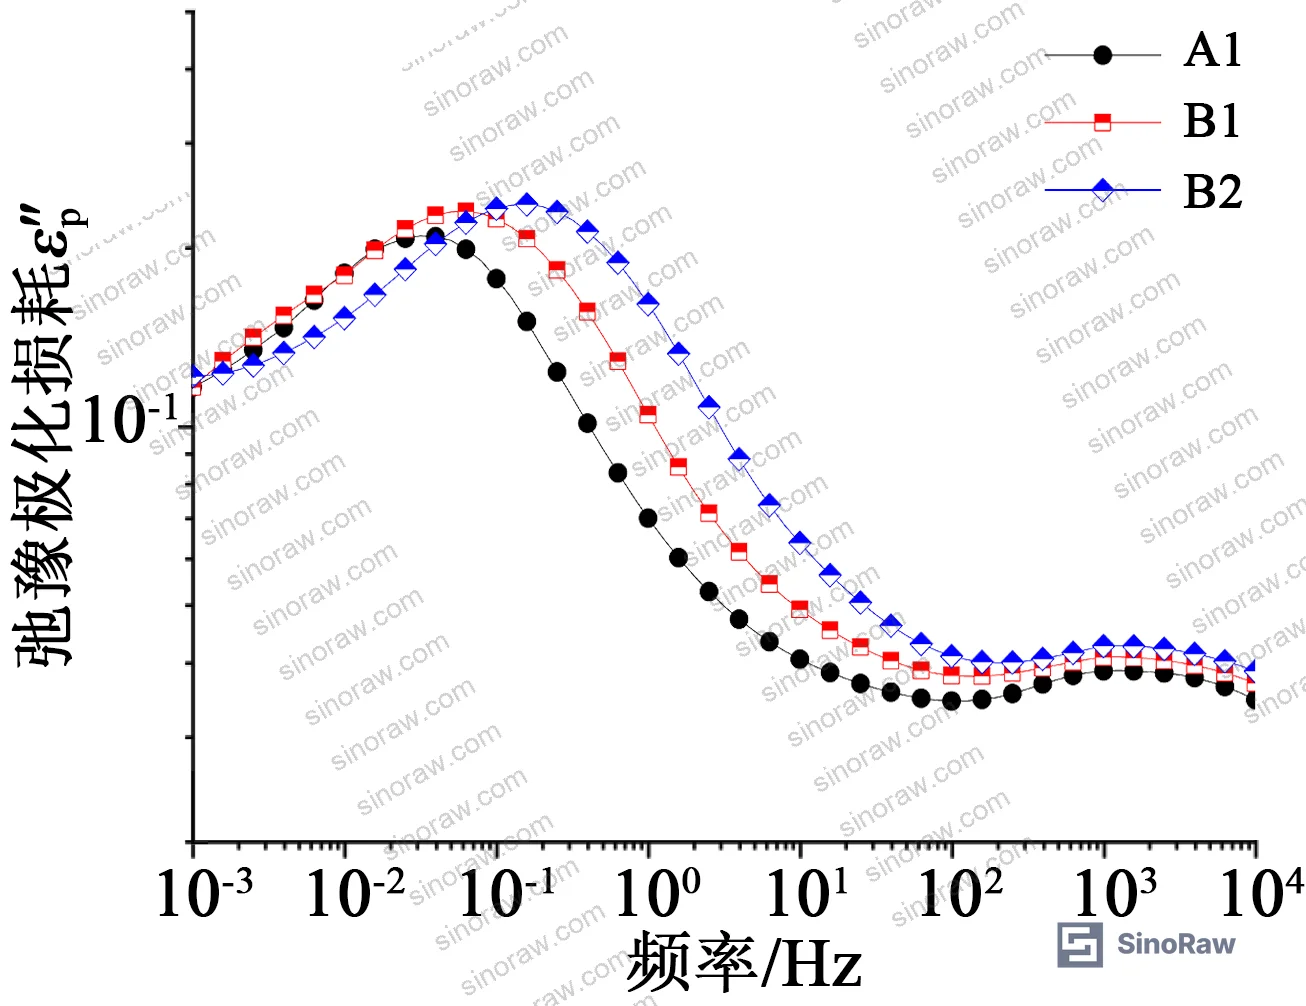
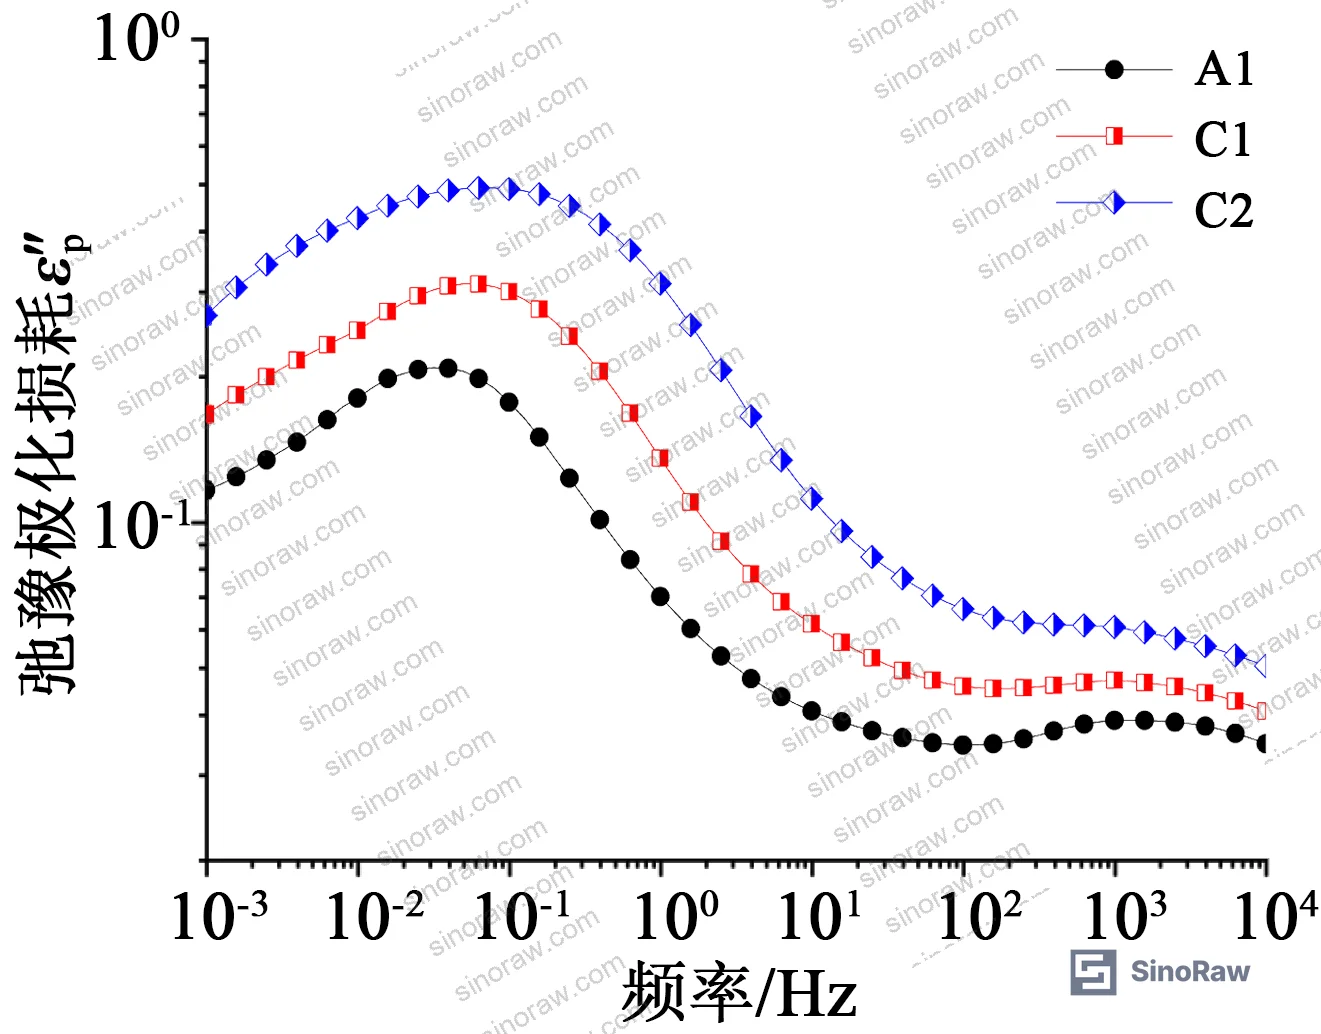
Seven test specimens were prepared: one dry reference (A1, all layers <0.5%), two uniformly moistened cores (A2 at 1.5% all layers, A3 at 3.0% all layers), two zero-screen localized moisture specimens (B1 and B2, with moisture concentrated in inner layers), and two end-screen localized specimens (C1 and C2, with moisture in outer layers).
The discriminating power of the spectral analysis becomes clear when you compare the three moisture scenarios:
Comparison of Polarization Parameters Across Moisture Types
| Core / Condition | Low-Freq Loss Peak ε″peak1 | Low-Freq Char. Freq. fC1 (Hz) | High-Freq Loss Peak ε″peak2 | High-Freq Char. Freq. fC2 (Hz) |
|---|---|---|---|---|
| A1 — Dry reference | 0.21 | 0.027 | 0.039 | 1259 |
| A2 — Uniform, 1.5% all layers | 0.73 | 0.025 | 0.064 | 1000 |
| A3 — Uniform, 3.0% all layers | 2.69 | 0.021 | 0.107 | 1125 |
| B1 — Zero-screen, 2% inner | 0.23 | 0.063 | 0.041 | 1000 |
| B2 — Zero-screen, 4% inner, 2% next | 0.24 | 0.159 | 0.043 | 1259 |
| C1 — End-screen, 2% outer | 0.31 | 0.050 | 0.047 | 1000 |
| C2 — End-screen, 4% outer, 2% next | 0.49 | 0.126 | 0.053 | 1125 |
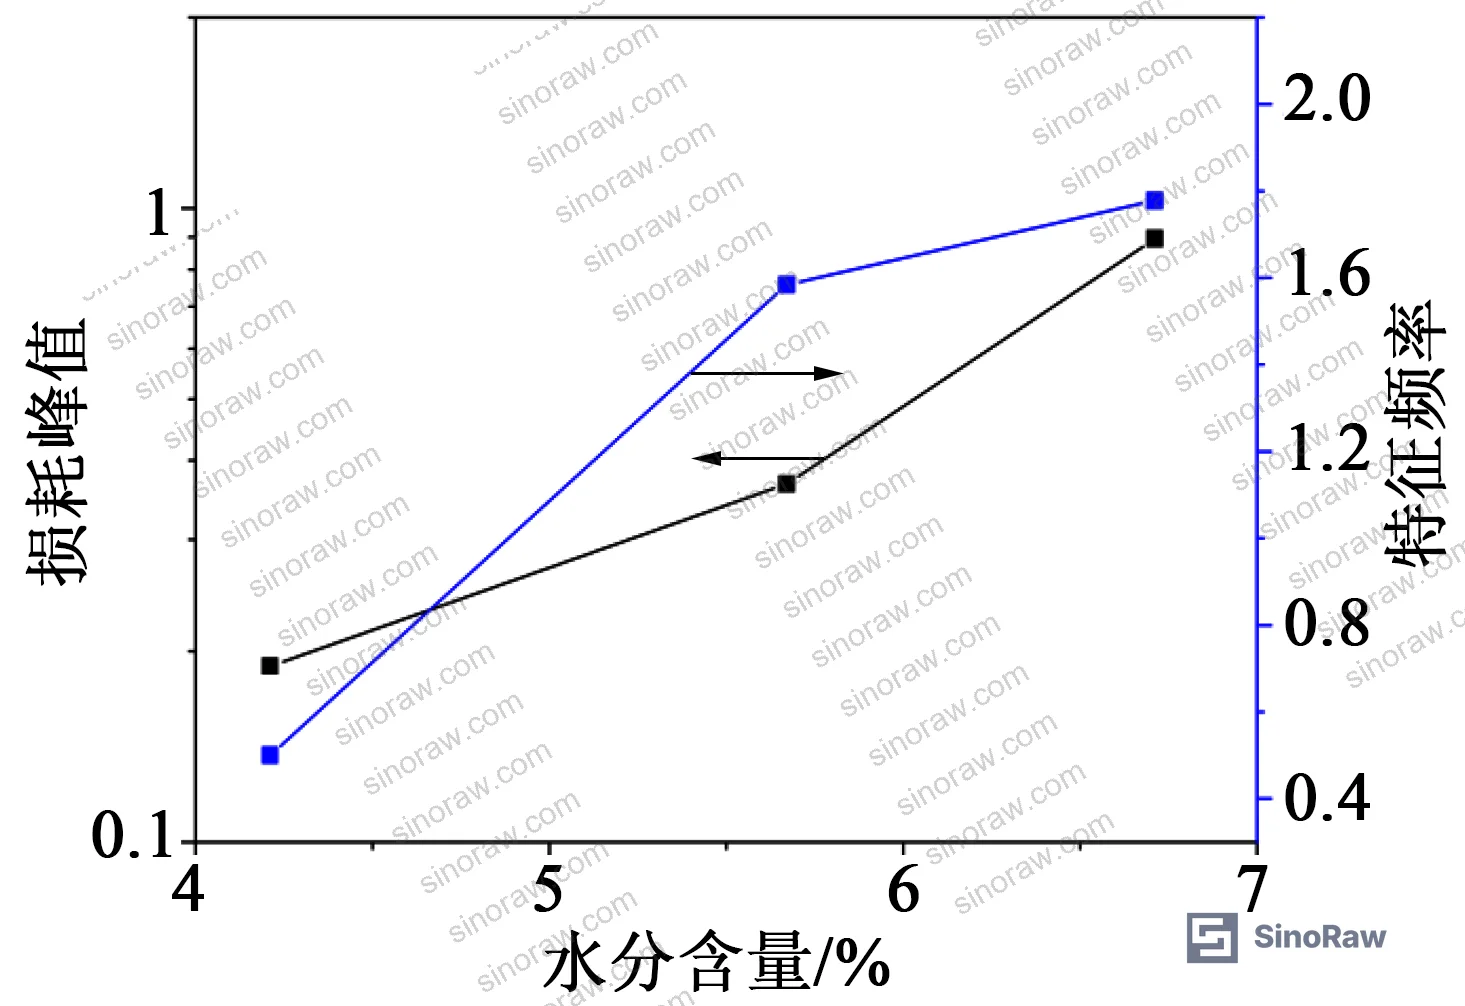
The pattern is unambiguous. For uniform whole-body moisture (A2, A3), both loss peak values increase substantially while characteristic frequencies remain essentially unchanged. For localized moisture — whether zero-screen or end-screen — the loss peak amplitude increases only modestly, but the characteristic frequency fC1 shifts markedly rightward (from 0.027 Hz in dry reference to 0.063–0.159 Hz for zero-screen, and 0.050–0.126 Hz for end-screen). High-frequency characteristic frequency fC2 remains stable across all localized moisture scenarios.
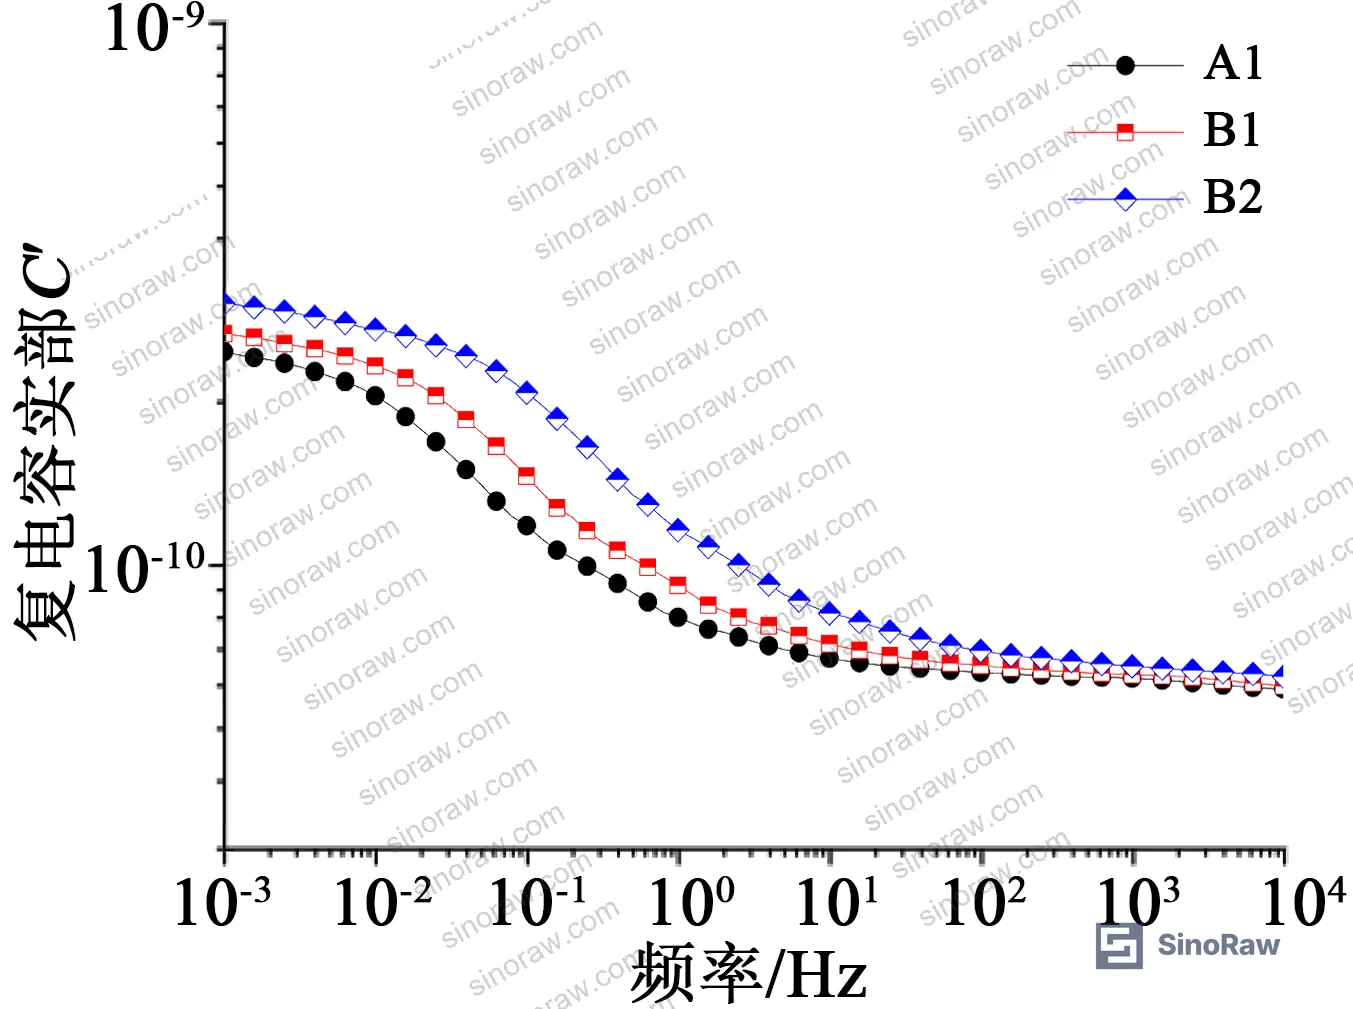
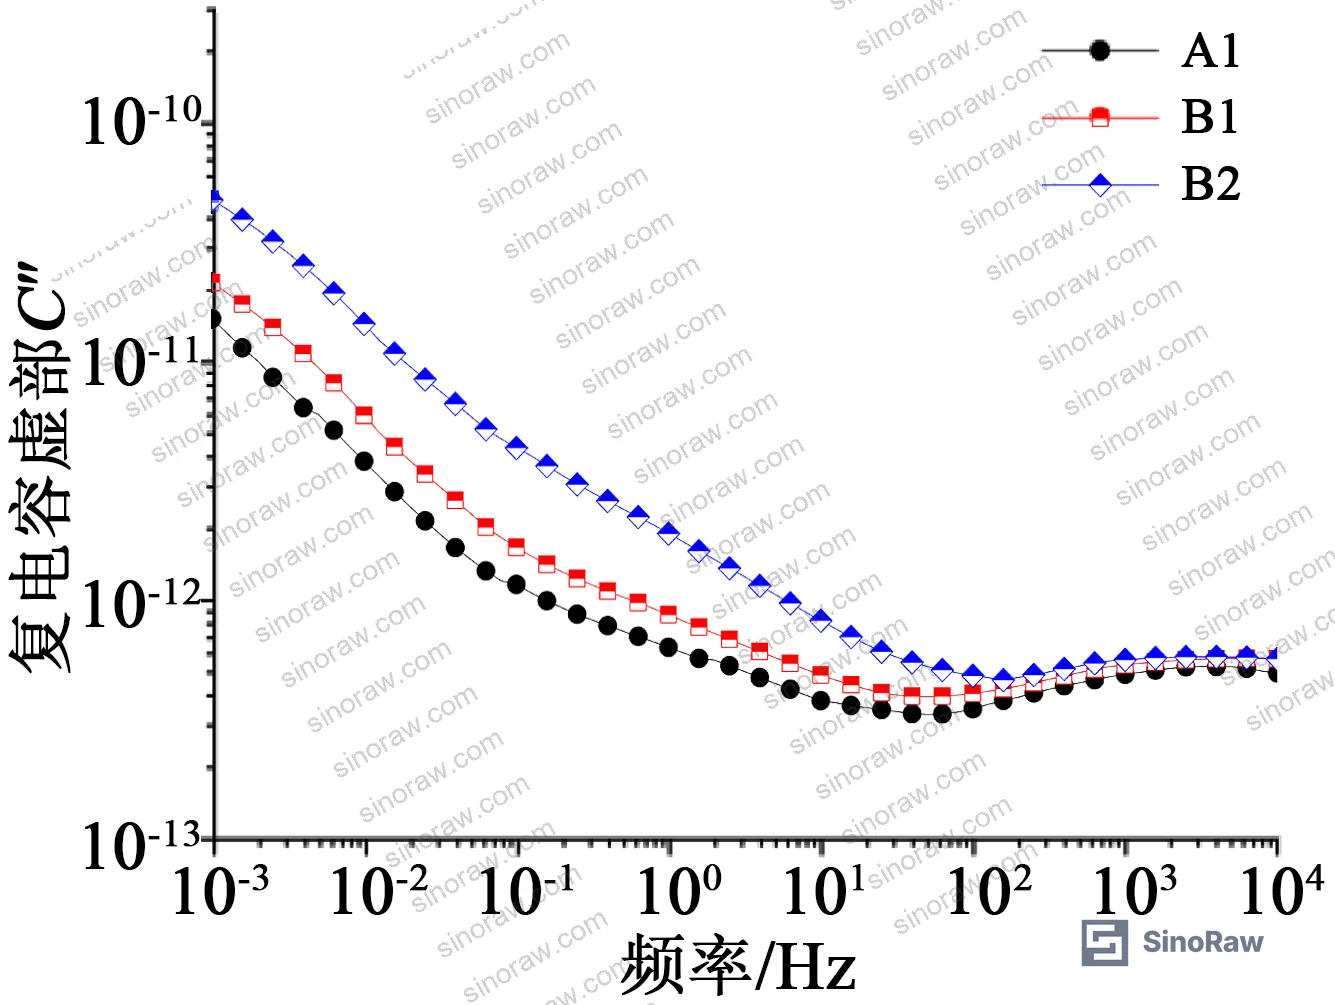
The physical explanation: localized moisture creates non-uniform dielectric distributions across capacitor grading layers, which reduces interface polarization time constants and shifts the loss peak to higher characteristic frequencies. End-screen moisture — moisture in the outermost layers — produces a larger spectral perturbation than zero-screen (inner layer) moisture, likely because end-screen layers carry proportionally more of the total electric field stress in normal operation.
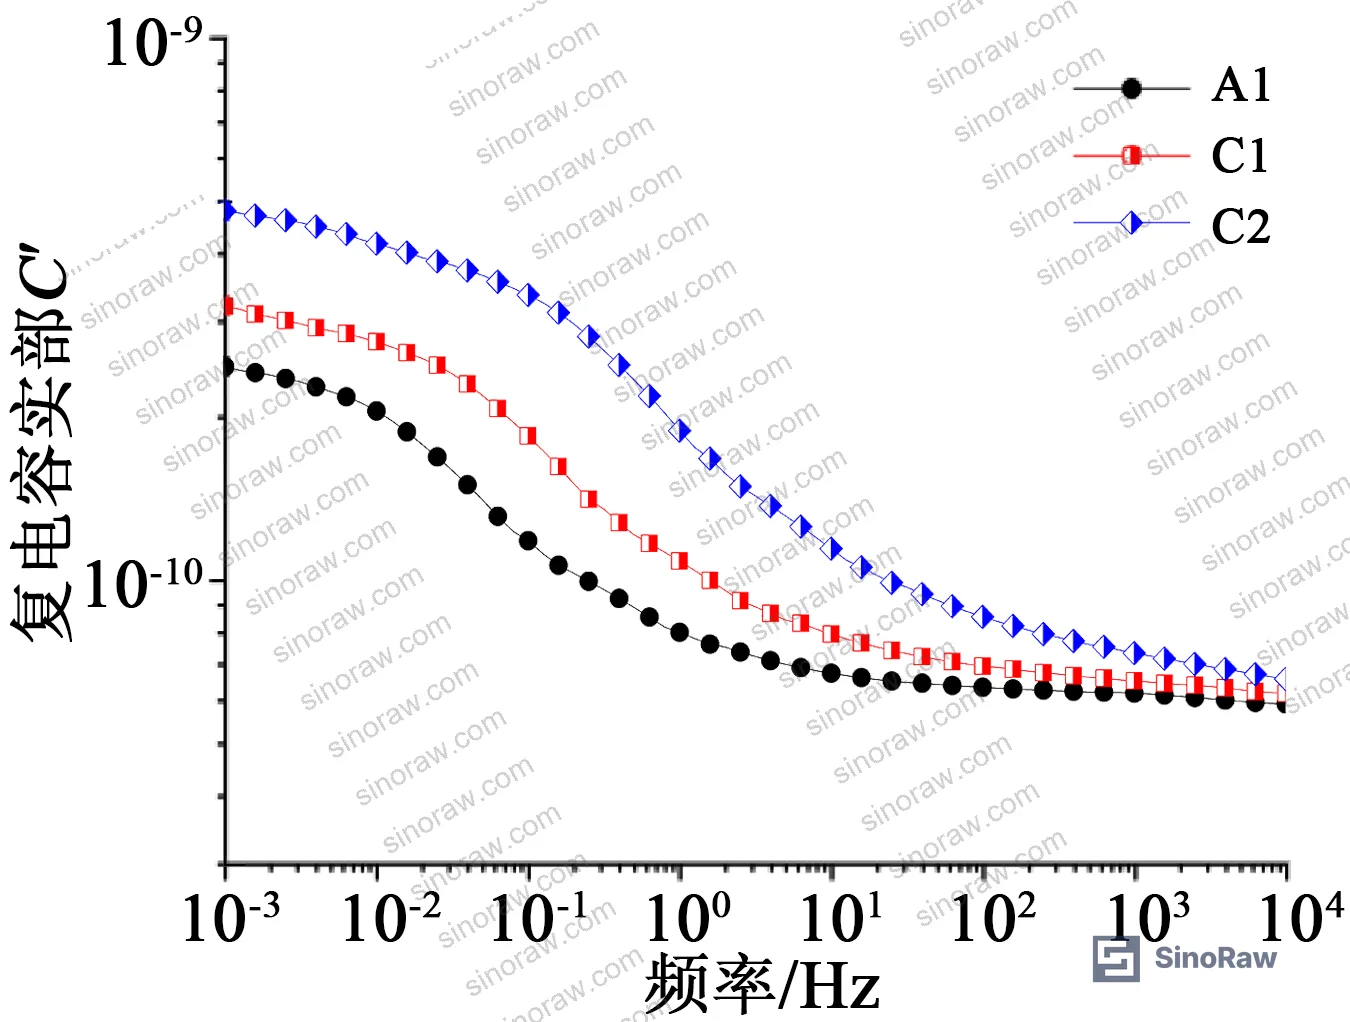
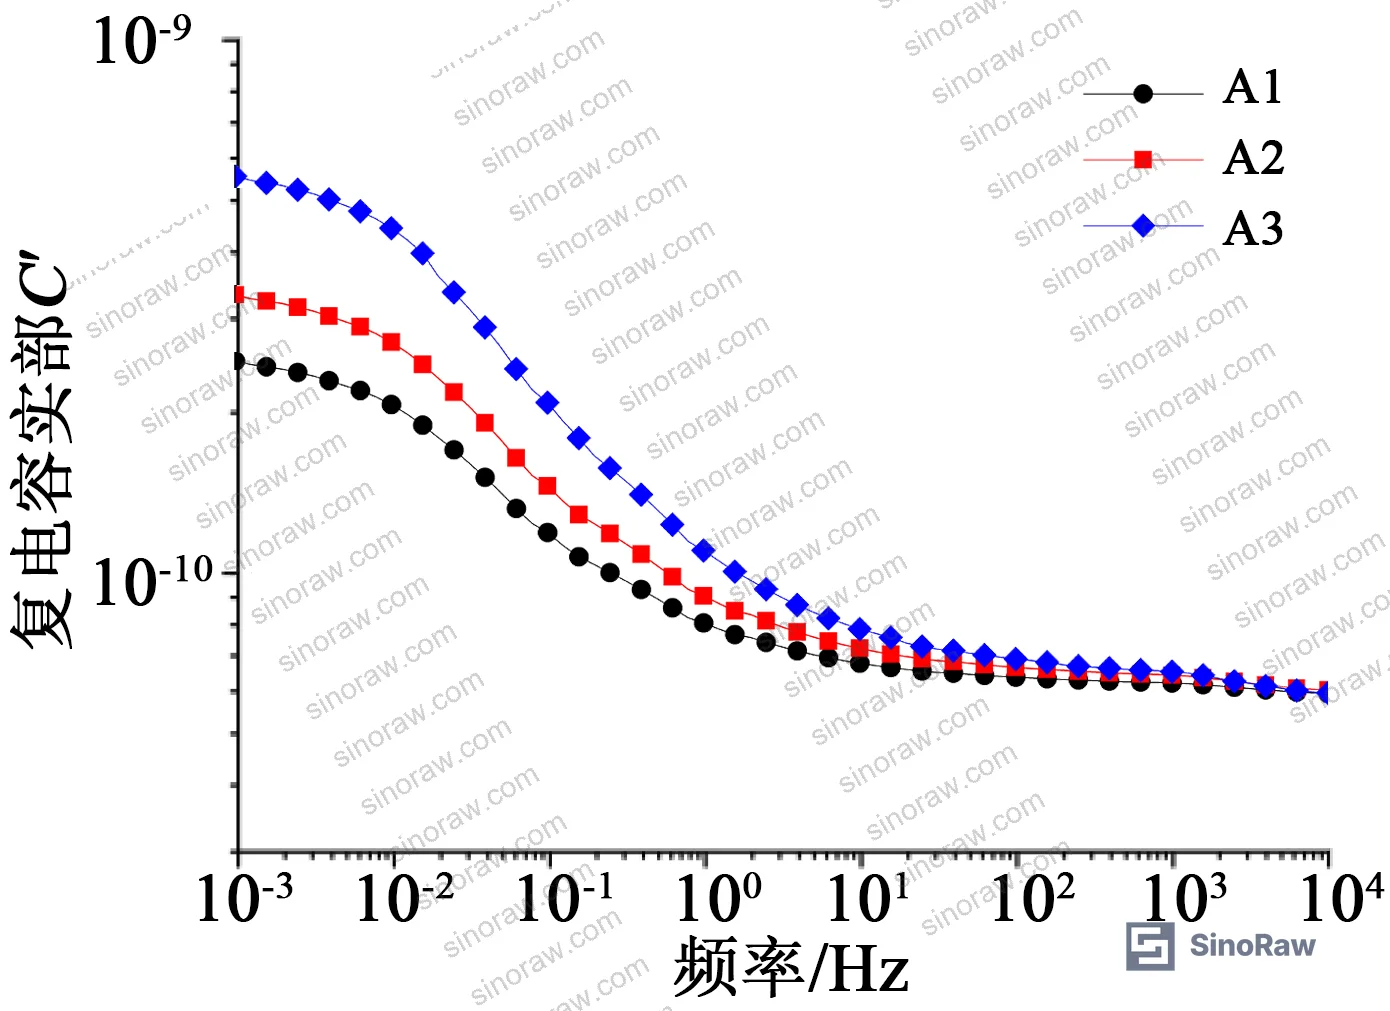
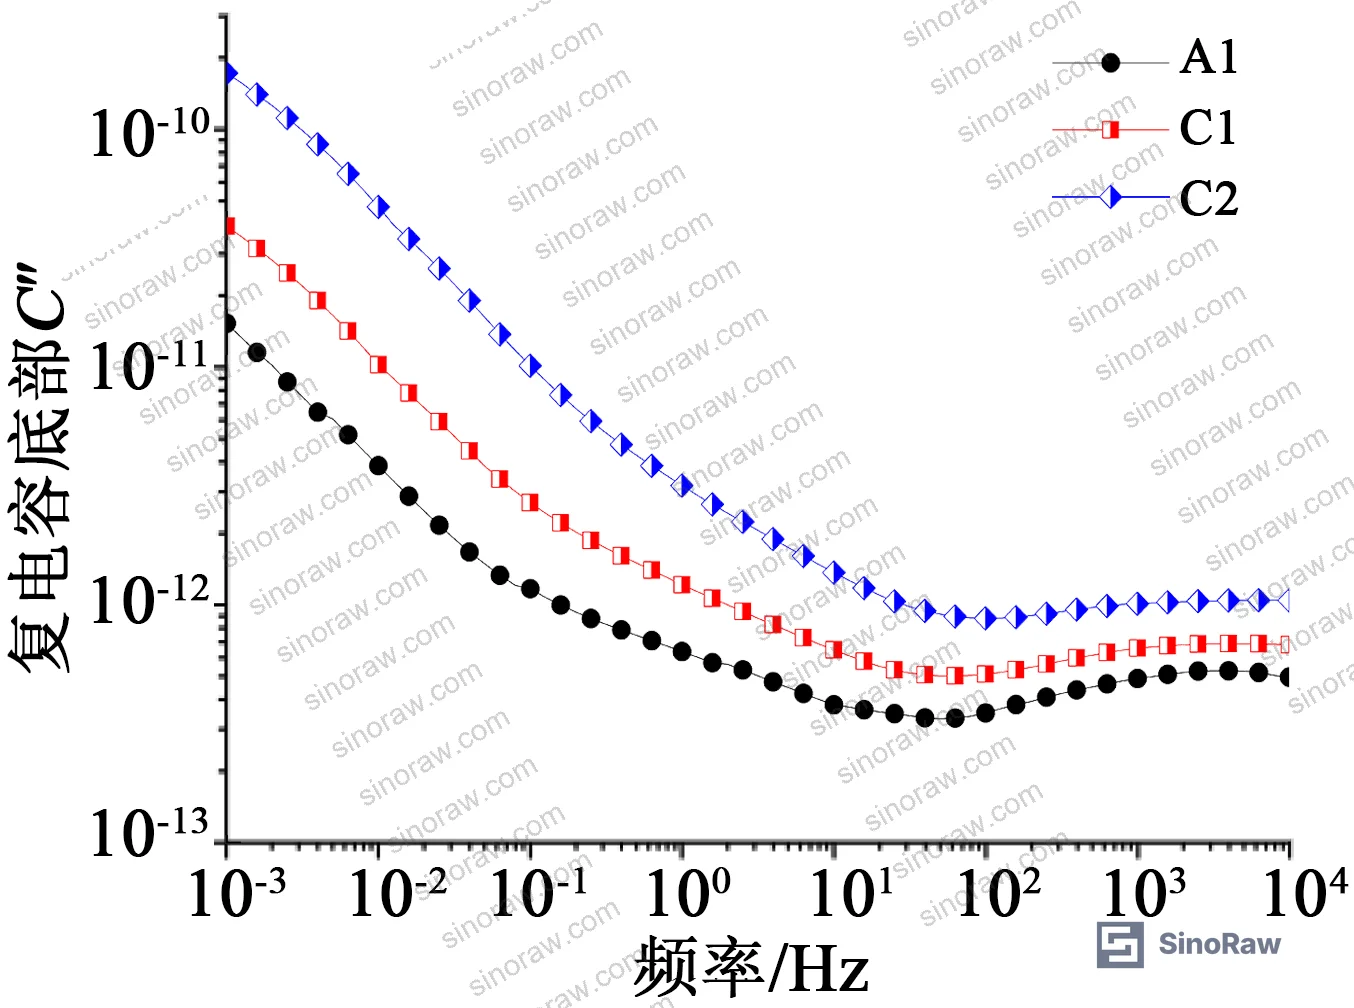
In supplier qualification, we saw the equivalent of this failure mode play out differently from what simple capacitance testing would have caught. A core that has only partial-layer moisture can pass conventional 10 kV dissipation factor testing while showing clear spectral signatures in the 10⁻³ to 10⁻¹ Hz band that indicate localized moisture in the grading layers. The uniform-moisture pattern is relatively straightforward to detect; it is the localized-moisture cases that require this level of spectral resolution to diagnose correctly.
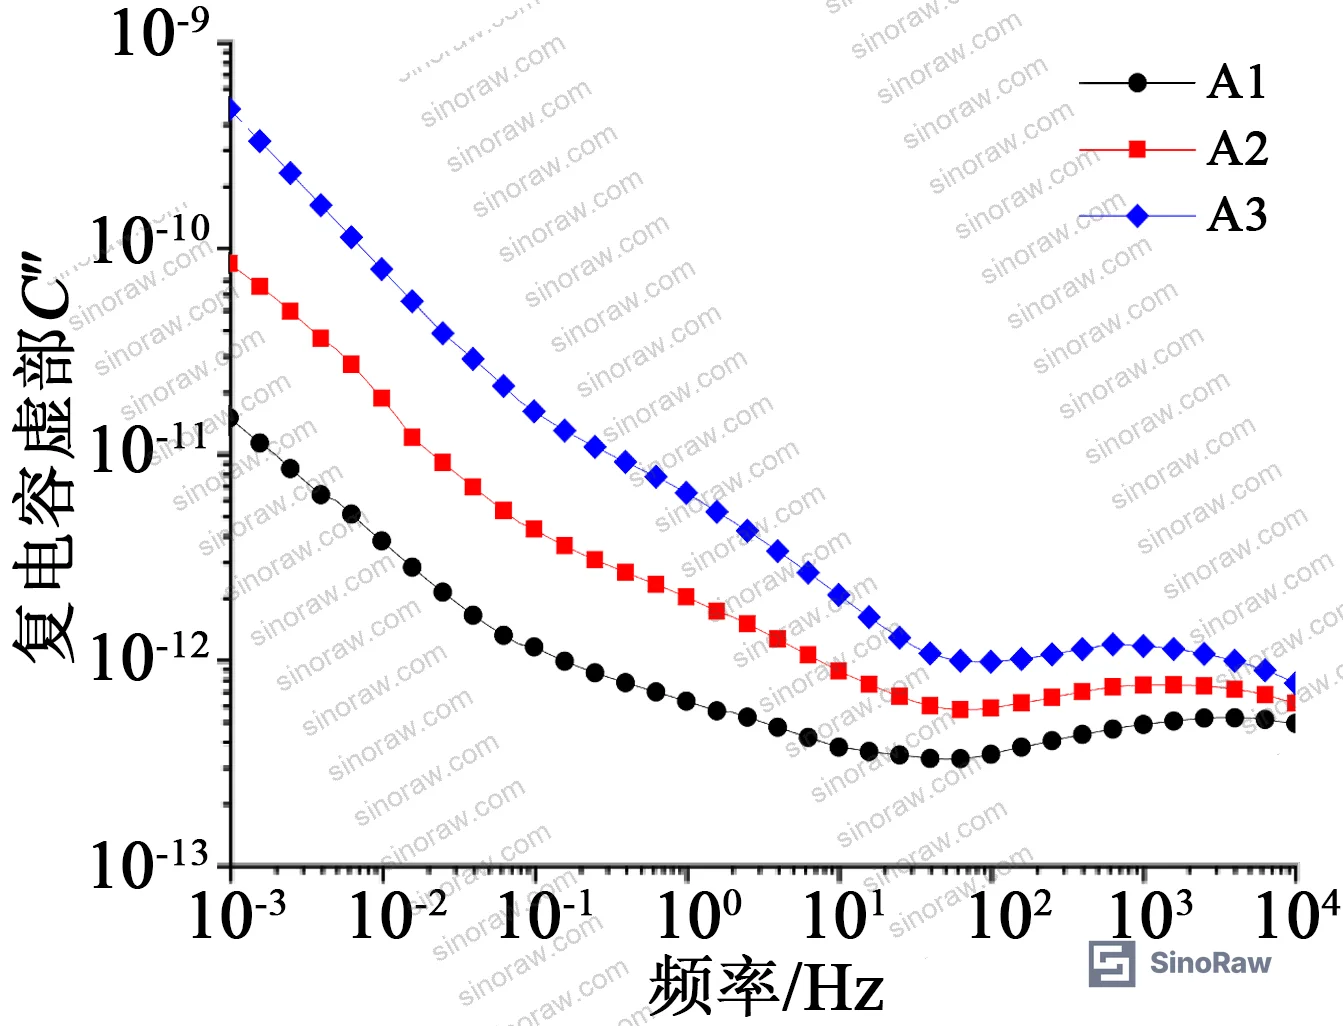
Most procurement teams don’t realize that broadband FDS testing — covering 10⁻³ to 10⁴ Hz — has largely superseded both recovery voltage (RVM) and polarization/depolarization current (PDC) methods as the preferred non-destructive moisture assessment technique for multi-layer capacitor bushings. RVM cannot distinguish between oil and paper moisture states. PDC is vulnerable to field interference and measurement difficulty at initialization. FDS carries the full polarization information, is inherently resistant to conducted interference, and — critically — can differentiate between uniform and localized moisture, which RVM and PDC simply cannot. If your supplier’s test method stops at 50 Hz, ask why.
Practical Guidance for Buyers #
Honestly, most buyers over-specify the insulation resistance test voltage and under-specify the test frequency range — and it costs them. The 50 Hz dissipation factor check will not catch early-stage or localized moisture in a multi-layer capacitor core. The data is unambiguous: the diagnostic information lives below 1 Hz.
When qualifying a supplier of oil-impregnated insulating paper or pre-assembled bushing capacitor cores, require FDS test reports showing the full 10⁻³ to 10⁴ Hz sweep, not just the standard IEC power-frequency measurement. Ask for the relaxation polarization loss peak value ε″peak1 — if a supplier cannot produce this from their QC process, they are relying on a test method that misses the most sensitive moisture indicator available. Sample preparation should follow IEC 60641-2 protocols: vacuum drying at (105 ± 2)°C for 24 hours for paper, 48 hours for oil, targeting moisture content below 0.5% and oil water content below 20 ppm before assembly. Post-assembly moisture budgets above 4.21% by mass should be treated as a reject criterion, since above this threshold free water forms and a fundamentally different polarization mechanism activates.
For materials compliance, verify that insulating papers meet REACH Regulation (EC) No 1907/2006 requirements, particularly regarding any plasticizers or additives in specialty-grade papers. Where capacitor-core assemblies are destined for terminally sealed electrical equipment, reference ISO 11607-1:2019 Packaging for terminally sterilized medical devices as an analog framework for moisture-barrier integrity verification of finished packaging.
At sinoraw.com, our sourcing team works specifically with overseas procurement engineers and quality managers to identify and pre-qualify Chinese manufacturers of insulating materials, MRO components, and industrial consumables — we can shortlist FDS-capable suppliers against your incoming inspection spec before you issue an RFQ.
Need help identifying qualified suppliers for oil-impregnated insulating paper or bushing capacitor cores? Talk to our sourcing team →
Supplier Qualification Questions #
- Can your QC process provide broadband FDS data covering 10⁻³ to 10⁴ Hz for each production lot, and can you share a representative relaxation polarization loss spectrum showing the ε″peak1 value for your standard dry product (target <0.5% moisture)?
- What is your measured exponential relationship between ε″peak1 and moisture mass fraction — specifically, do your fitting parameters approximate a = 0.0053, b = 0.97 with R² ≥ 0.99, and how frequently is this calibration revalidated?
- For multi-layer capacitor core assemblies, can you demonstrate that your FDS measurement resolves both low-frequency polarization process 1 (10⁻³ to 10⁻¹ Hz) and high-frequency process 2 (10⁰ to 10¹ Hz) independently, including characteristic frequency fC1 and fC2 values?
- Your sample preparation: do you vacuum-dry insulating paper at (105 ± 2)°C for a minimum of 24 hours and insulating oil for 48 hours per IEC 60641-2 before assembly, and can you provide Karl Fischer titration certificates confirming oil moisture content below 20 ppm and paper moisture below 0.5%?
- If a capacitor core shows a rightward shift in fC1 (characteristic frequency of low-frequency polarization process 1) while ε″peak1 remains low — indicating localized rather than uniform moisture — what is your acceptance criterion, and at what fC1 threshold does the assembly fail incoming quality control?
Sourcing Checklist #
- ☐ FDS sweep covers full 10⁻³ to 10⁴ Hz range with ≥140 frequency points (20 points per decade at log-equal spacing)
- ☐ Relaxation polarization loss peak ε″peak1 confirmed <0.5 for dry reference (moisture fraction <0.5%), consistent with A1 reference value of 0.21 in test data
- ☐ Karl Fischer titration certificate shows insulating paper moisture content below 0.5% and oil moisture below 20 ppm (20 × 10⁻⁶) post-drying per IEC 60641-2
- ☐ Supplier’s FDS test report resolves both polarization process 1 (10⁻³–10⁻¹ Hz) and process 2 (10⁰–10¹ Hz) with characteristic frequency fC1 and fC2 individually reported
- ☐ Characteristic frequency fC1 does not exceed 0.050 Hz for uniformly dried assemblies (dry reference A1: fC1 = 0.027 Hz); values above 0.063 Hz indicate localized moisture warranting rejection or re-testing
- ☐ Moisture content of final assembly confirmed below 4.21% by mass — above this threshold, free-water polarization process 2 activates, signaling a qualitatively different and more severe degradation state
- ☐ Supplier holds ISO 9001:2015 certification with documented FDS test procedure included in their quality management system
- ☐ Batch sampling protocol references ISO 2859-1:1999 attribute sampling procedures for incoming dielectric measurement acceptance testing
Key Specifications Table #
| Parameter | Recommended Value | Verification Method |
|---|---|---|
| Oil-paper moisture content (dry lot) | <0.5% by mass | Karl Fischer titration, per IEC 60641-2 |
| Insulating oil water content post-drying | <20 × 10⁻⁶ (20 ppm) | Karl Fischer titration, per IEC 60641-2 |
| Low-frequency relaxation polarization loss peak ε″peak1 (dry) | <0.30 (target ≈ 0.21 per dry reference A1) | Broadband FDS, 10⁻³–10⁴ Hz sweep |
| Low-frequency characteristic frequency fC1 (uniform moisture) | 0.021–0.027 Hz (at moisture ≤3%) | Relaxation polarization spectral analysis |
| Reject threshold: fC1 shift indicating localized moisture | >0.050 Hz triggers investigation; >0.063 Hz indicates localized moisture | Compare against dry reference A1 = 0.027 Hz |
| Free-water activation threshold (process 2 onset) | Moisture fraction 4.21% by mass | Appearance of second loss peak in 10⁰–10¹ Hz band in FDS spectrum |
| FDS frequency resolution | ≥20 points per decade (log-equal spacing) | Instrument specification; 140 points total across 7 decades |
Can’t find a supplier meeting these specs? Submit your requirements and we’ll match you within 48 hours.
References #
Data source: Broadband Dielectric Spectroscopy for Moisture Characterization and Condition Assessment of Oil-Impregnated Bushing Insulation, F. Xie et al., IEEE Transactions on Dielectrics and Electrical Insulation, 2023
Frequently Asked Questions #
Why is the low-frequency polarization loss peak more reliable than characteristic frequency for moisture quantification?
The loss peak value (ε″peak1) follows a tight exponential relationship with moisture content across the full tested range, with R² = 0.99. The characteristic frequency fC1, by contrast, shows only a weak inverse trend with moisture when moisture is uniform — it becomes diagnostic only for localized moisture scenarios, where it shifts rightward significantly. Using characteristic frequency as a moisture meter for uniform ingress will give you noisy, unreliable results.
What is the practical difference between zero-screen and end-screen localized moisture, and why does it matter for procurement?
Zero-screen moisture means water has penetrated the inner capacitor grading layers closest to the conductor. End-screen moisture means the outer layers — closest to ground potential — are wet. End-screen moisture produces larger spectral perturbations (higher ε″peak1, more pronounced fC1 shift) and is generally considered more dangerous because it affects the highest-capacitance grading layers most. From a procurement standpoint: if your FDS report shows a rising fC1 with only modest amplitude increase, you have localized moisture, and you need to know whether it is inner or outer before deciding disposition.
At what moisture content does oil-paper insulation become unacceptable for high-voltage bushing applications?
The research identifies 4.21% by mass as a critical threshold — above this level, free water forms in the insulating oil and a second polarization process activates, indicating a qualitatively different degradation state. Practically, most specifications for high-voltage bushing paper target below 2% at installation, with 3% as a warning level. Above 4.21%, the insulation is not marginal — it has entered a different failure mode regime.
Can standard 50 Hz dissipation factor testing detect the moisture signatures described here?
No. Both polarization process 1 (10⁻³–10⁻¹ Hz) and polarization process 2 (10⁰–10¹ Hz) lie entirely below power frequency. A 50 Hz measurement captures neither the exponentially moisture-sensitive low-frequency loss peak nor the frequency-shift signature that distinguishes localized from uniform moisture. Power-frequency dissipation factor is a coarse health indicator at best; it cannot resolve the moisture type or location information that FDS provides.
How does this dielectric testing relate to the insulating paper itself as a material, separate from the finished bushing assembly?
Single-layer oil-impregnated paper samples and multi-layer capacitor core assemblies show consistent behavior in the low-frequency polarization process 1 region — the exponential ε″peak1 vs. moisture relationship holds for both. This means the FDS method is valid as an incoming inspection tool for raw insulating paper stock, not only for finished assemblies. Procurement teams can require lot-level FDS data from paper suppliers using the same acceptance thresholds before paper is cut and wound into a finished capacitor core.
Published by sinoraw.com Technical Team | Request a sourcing quote


