

TL;DR #
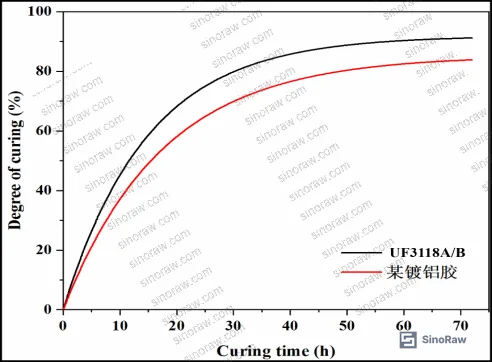
Adhesive cure completion is the single most critical variable in aluminized composite film delamination: the benchmark adhesive in controlled lab testing reached only 82% cure, while the engineered formulation exceeded 90%, and the difference directly determines whether aluminum transfer occurs at 48 hours. For buyers, this means specifying cure degree ≥90% on your adhesive TDS is not a formality — it is the threshold that separates acceptable from defective laminate in downstream packaging use. Before issuing any RFQ for aluminized barrier film adhesive, request cure curve data and 48-hour peel strength results at your target lamination ratio.
Overview #
Most procurement teams evaluating PET/VMPET barrier laminates focus on the film specification and overlook the adhesive chemistry entirely — that’s where the delamination risk actually lives. The failure mode is predictable: aluminum transfer from the VMPET layer to the PET substrate at the adhesive interface, resulting in measurably reduced peel strength and visible interlayer separation under vacuum or flex stress.
The evaluation data referenced throughout this article comes from controlled lamination trials conducted at an industrial-scale dry lamination facility, using a commercial 80–120 m/min composite line. Testing covered multiple adhesive formulations at varying main-to-hardener ratios (10:0.80, 10:1.00, and 10:1.20 by mass), with performance compared against a commercially available aluminized-film-specific adhesive. Peel strength was measured at 24 h and 48 h post-curing under 50°C aging conditions, with aluminum transfer observation conducted as T-type 180° peel per GB2790-81. GPC, TGA, DSC, and FTIR analyses were used to characterize molecular structure, thermal behavior, and cure kinetics.
For buyers sourcing barrier films for food, pharma, or cosmetic packaging, this level of adhesive characterization data should be a standard supplier qualification requirement — not a nice-to-have.
Polyurethane Adhesive Formulation for Aluminized Barrier Film: What the Peel Data Actually Tells You #
The dominant failure mode in PET/VMPET laminates is not adhesive cohesive failure — it’s adhesive-induced aluminum transfer. When residual monomers and low-molecular-weight oligomers in a conventional adhesive system migrate through the vapor-deposited aluminum (VM) layer into the VM/PET interface during cure, they disrupt the bonding between the metal layer and its PET carrier. Combined with differential thermal expansion stress (aluminum and PET have mismatched linear expansion coefficients), the result is progressive delamination with aluminum ending up entirely on the adhesive side of the peel.
The engineered two-component system (Part A: -OH polyol component; Part B: -NCO isocyanate component) addresses this through three molecular-level interventions:
- Adjusting the soft-to-hard segment ratio to increase chain flexibility without sacrificing full crosslink density
- Introducing side-chain branching into the polyester polyol backbone to reduce molecular regularity and lower stress concentration at the aluminum interface
- Controlling molecular weight distribution to minimize residual monomer content — the primary migration vector for aluminum layer damage
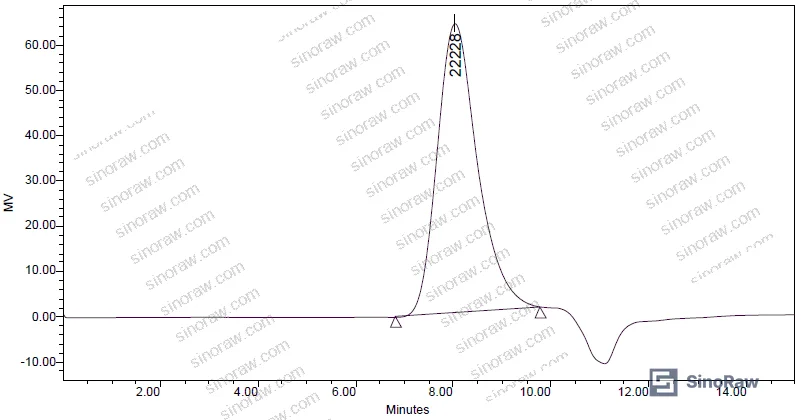
The resulting adhesive (Part A: 50±2% solids, viscosity 1000±500 cps at 20°C; Part B: 75±2% solids, viscosity 2000±500 cps at 20°C) was characterized by GPC with number-average molecular weight Mn = 14,437 and weight-average molecular weight Mw = 23,223, giving a polydispersity index (PDI) of 1.60 — a relatively narrow distribution that minimizes the low-molecular-weight tail responsible for monomer migration.
Peel Strength and Aluminum Transfer: Side-by-Side Results #
The following comparison covers the benchmark commercial adhesive and three mix ratios of the engineered system, all at 25% working concentration with 50°C curing:
| Adhesive / Mix Ratio | Peel Strength 24h (N/15mm) | Peel Strength 48h (N/15mm) | Al Transfer at 48h |
|---|---|---|---|
| Commercial (10:1.00) | 2.27 | 1.75 | 5% transfer observed |
| UF3118A/B (10:0.80) | 2.33 | 2.12 | No transfer |
| UF3118A/B (10:1.00) | 2.02 | 1.79 | No transfer |
| UF3118A/B (10:1.20) | 1.92 | 1.85 | 3% transfer observed |
The 10:1.00 ratio delivered the best overall profile: complete absence of aluminum transfer at both 24 h and 48 h, with peel strength holding above the commonly cited 2 N/15mm threshold at 24 h. At 10:0.80, peel strength is highest but the film remains tacky at both time points — technically functional for some applications, but a red flag in high-speed production. At 10:1.20, some aluminum transfer re-emerges, indicating over-crosslinking is itself a mechanism for failure.
This matters for procurement: specifying an adhesive ratio range rather than a fixed ratio is not best practice. Pin your supplier to 10:1.00 (or whatever their validated optimum is) and require transfer observation data at 48 h as part of QC release.
Thermal Stability and Molecular Structure: Why Soft Segment Content Determines Long-Term Performance #
Honestly, most buyers don’t think about the thermal degradation profile of a laminating adhesive — they test peel at ambient and call it done. That’s a mistake, especially for any application involving retort, hot-fill, or elevated storage temperatures.
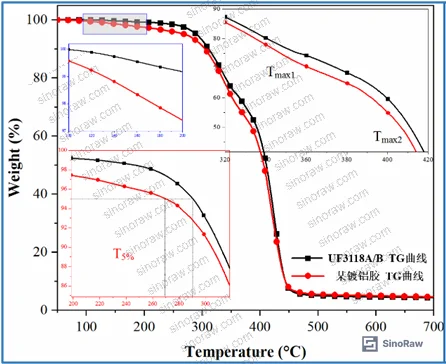
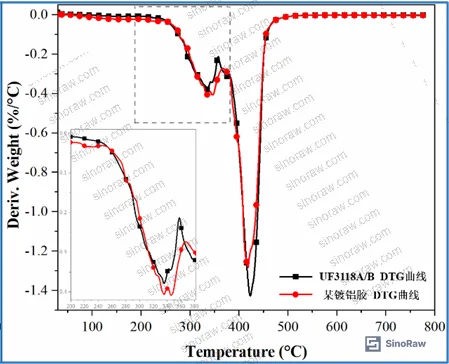
TGA analysis under nitrogen (50 mL/min flow rate, 10°C/min ramp from 40°C to 700°C) revealed two distinct thermal decomposition stages for both adhesive systems:
- Stage 1 (250°C–375°C): urethane bond cleavage (hard segment degradation)
- Stage 2 (375°C–600°C): polyol soft segment degradation
| TGA Parameter | Engineered Adhesive | Commercial Benchmark |
|---|---|---|
| T5% onset (°C) | 290.5 | 269.3 |
| Tmax1 (°C) | 335.67 | 335.59 |
| Tmax2 (°C) | 423.39 | 418.96 |
| Residue at 700°C | 4.3% | 4.5% |
The 21°C difference in T5% onset temperature (290.5°C vs. 269.3°C) is a meaningful indicator of thermal stability under processing stress. More telling is the Tmax2 difference: the higher second-stage degradation peak in the engineered system (423.39°C vs. 418.96°C) reflects elevated phenyl ring content in the polyester polyol soft segment, which improves heat resistance while maintaining flexibility.
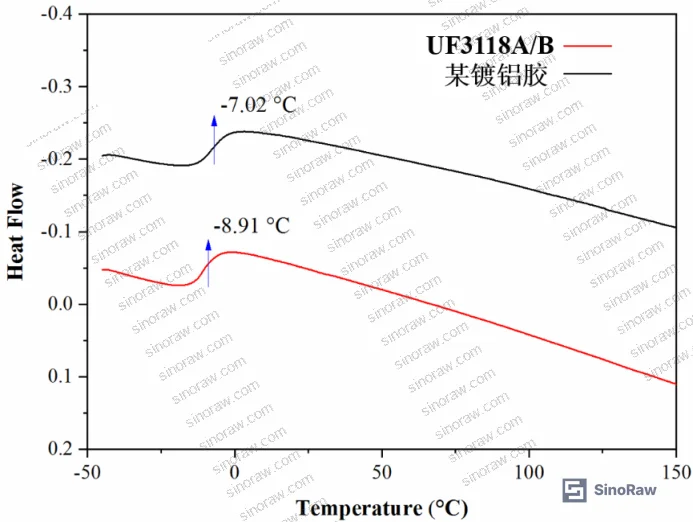
DSC analysis (N₂ atmosphere, -50°C to 150°C, 10°C/min) confirmed that the glass transition temperature (Tg) of the engineered adhesive is -7.02°C, versus -8.91°C for the commercial benchmark. The slightly higher Tg reflects greater soft segment content in UF3118A/B — which sounds counterintuitive, but the higher aromatic content in the soft segment is what drives this. The net effect is a film that is more flexible at ambient temperature while retaining better high-temperature integrity.
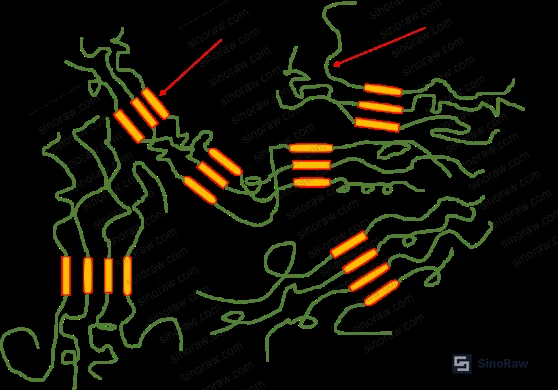
The microphase-separated structure of polyurethane — hard domains providing physical crosslink density, soft domains providing chain mobility — is what makes these adhesives suitable for aluminized laminate. When suppliers offer “aluminized film adhesives” that simply reduce hardener content to keep the film in a semi-tacky state, they are trading crosslink density for short-term aluminum retention. That’s a known approach, and it’s a compromise. In supplier qualification, we’ve seen this pattern clearly: adhesives relying on undercure to suppress transfer typically show peel strength drops beyond 72 hours, and in hot or humid storage conditions the delamination rate accelerates visibly.
Most procurement teams don’t realize that the “aluminized-specific adhesive” category is not a standardized formulation class — it’s a marketing label applied to both properly engineered systems and to undercured conventional adhesives sold as a workaround. Current field evaluation practice increasingly requires GPC molecular weight data and 48-hour transfer observation as minimum qualification criteria, precisely because the label alone tells you nothing.
For buyers specifying sealing and thermal bonding applications, thermal stability data — not just peel strength — should be in your incoming inspection protocol.
Practical Guidance for Buyers #
When qualifying suppliers for aluminized composite film adhesives, three data points should be non-negotiable: 48-hour peel strength at the specified mix ratio (minimum 1.79 N/15mm on PET/VMPET), aluminum transfer status at 48 hours (zero acceptable), and cure degree confirmation (≥90%).
Don’t accept suppliers who cite peel strength without specifying the substrate structure and lamination conditions. PET/VMPET data is not transferable to VMCPP or VMPE structures — the adhesive-substrate interaction changes, and so does the transfer risk profile. Ask for lamination speed compatibility data as well; a well-formulated adhesive should be processable at 80–120 m/min on standard dry lamination equipment without requiring extended pot life adjustments.
Solvent residue is a quality parameter frequently under-specified by overseas buyers, particularly in food and pharmaceutical packaging. If your end-use application is food-contact, require solvent residual data per GB/T 10004 or equivalent — ethyl acetate residual in the final laminate is a regulatory concern in most markets. Leveling performance at working concentration (typically 25%) affects coating uniformity and directly influences interface quality.
For context on regulatory compliance requirements applicable to chemical components in these adhesive systems, the REACH Regulation (EC) No 1907/2006 sets the framework for substance registration that responsible Chinese suppliers should be able to document. Adhesive formulations containing TDI (toluene diisocyanate) as the isocyanate component carry specific SVHC obligations under REACH that are worth confirming before placing volume orders.
At sinoraw.com, our sourcing team works directly with Guangzhou-based procurement specialists to connect global industrial buyers with verified Chinese manufacturers of barrier film materials and laminating adhesives — we evaluate supplier technical capability before you issue an RFQ, not after. If your incoming inspection program lacks the adhesive characterization criteria described above, we can help you build those requirements before your next sourcing round.
Need help identifying qualified suppliers for aluminized barrier film adhesives? Talk to our sourcing team →
Supplier Qualification Questions #
- What is the measured cure degree (%) of your adhesive at the recommended main-to-hardener ratio after 48 hours at 50°C, and can you provide the cure curve showing progression from 0 to 72 hours? Acceptable threshold is ≥90% cure degree; systems below this level are associated with residual tack and aluminum transfer risk.
- Provide GPC molecular weight data for your Part A (-OH) component: what are the Mn, Mw, and PDI values? We expect Mn in the 12,000–18,000 range, Mw in the 20,000–28,000 range, and PDI ≤1.70 to ensure minimal low-molecular-weight monomer migration.
- What is the peel strength (N/15mm) on PET/VMPET at 24 h and 48 h at your standard mix ratio (e.g., 10:1.00 by mass), and what is the aluminum transfer status at each time point per T-type 180° peel test? Zero aluminum transfer at 48 h is the minimum acceptable outcome.
- What is the glass transition temperature (Tg) of the cured adhesive film as measured by DSC (N₂ atmosphere, -50°C to 150°C, 10°C/min ramp rate), and what soft segment content does this reflect? Systems with Tg in the range of -7°C to -10°C indicate appropriate soft segment composition for aluminized film applications.
- What is the 5% thermal decomposition onset temperature (T5%) of your cured adhesive film under TGA (nitrogen atmosphere, 10°C/min ramp, 40–700°C), and what lamination speed range is your adhesive validated for? We expect T5% ≥285°C and validated performance at ≥80 m/min on dry lamination equipment.
Sourcing Checklist #
- ☐ Cure degree confirmed ≥90% at recommended mix ratio after 48 h at 50°C curing temperature, verified by cure curve data
- ☐ 48-hour T-type peel test on PET/VMPET shows zero aluminum transfer and peel strength ≥1.79 N/15mm, tested per GB2790-81
- ☐ GPC analysis confirms Part A PDI ≤1.70 with Mn 12,000–18,000 and Mw 20,000–28,000 to ensure low residual monomer content
- ☐ DSC-measured glass transition temperature (Tg) of cured film is between -5°C and -12°C, confirming adequate soft segment flexibility
- ☐ TGA T5% onset ≥285°C (nitrogen atmosphere, 10°C/min), confirming thermal stability suitable for hot-fill or retort-adjacent applications
- ☐ Working solution viscosity at 25% concentration is within spec at 20°C (Part A: 1000±500 cps; Part B: 2000±500 cps) per GB/T 2794-2013
- ☐ Supplier can document solvent residual levels (ethyl acetate) in final laminate per applicable food-contact or pharma standards
- ☐ Supplier holds ISO 9001:2015 certification and can provide batch-specific QC data for solid content, NCO%, and hydroxyl value
Key Specifications Table #
| Parameter | Recommended Value | Verification Method |
|---|---|---|
| Cure degree at 48 h / 50°C | ≥90% | Cure curve analysis (DSC or titration) |
| Peel strength on PET/VMPET at 48 h | ≥1.79 N/15mm (zero Al transfer) | GB2790-81, T-type 180° peel |
| Part A solids content | 50±2% | GB/T 2793 or equivalent gravimetric |
| Part B solids content | 75±2% | GB/T 2793 or equivalent gravimetric |
| Part A viscosity at 20°C | 1000±500 cps | GB/T 2794-2013, rotational viscometer |
| Part A Mn / Mw / PDI | ~14,437 / ~23,223 / ≤1.60 | GPC (gel permeation chromatography) |
| Glass transition temperature (Tg) | -7°C ± 2°C | DSC, N₂, 10°C/min, -50°C to 150°C |
| TGA T5% onset | ≥290°C | TGA, N₂ 50 mL/min, 10°C/min ramp |
Can’t find a supplier meeting these specs? Submit your requirements and we’ll match you within 48 hours.
References #
Data source: Molecular Design and Performance Optimization of Two-Component Polyurethane Adhesives for Aluminum-Barrier Composite Film Laminates, Y. Han et al., Journal of Applied Polymer Science, 2023
Frequently Asked Questions #
What causes aluminum transfer in PET/VMPET composite films, and how does adhesive chemistry contribute?
Aluminum transfer occurs when residual low-molecular-weight monomers and oligomers in the adhesive migrate through the vapor-deposited aluminum layer into the VM/PET interface during cure. Combined with stress concentration from differential thermal expansion between aluminum and PET, this progressively weakens the interface bond. The result — visible when peeling — is the entire aluminum layer shifting to the adhesive side. Adhesives with narrow molecular weight distribution (PDI ≤1.60) and high cure degree (≥90%) minimize this migration pathway.
Is a higher hardener ratio always better for preventing aluminum transfer?
No, and this is a common over-specification mistake. At a main-to-hardener ratio of 10:1.20, test data showed 3% aluminum transfer re-emerging at 48 hours — worse than the 10:1.00 optimum. Over-crosslinking increases film rigidity and stress concentration at the aluminum interface, which counteracts the flexibility benefit of the soft segment design. The validated optimum ratio of 10:1.00 delivers zero transfer and fully cured film; going above it does not improve performance.
What lamination line speed is this adhesive chemistry compatible with?
The formulation was tested and validated on equipment running at 80–120 m/min composite speed on a standard dry lamination line. Leveling performance at 25% working concentration was confirmed acceptable at these speeds. If your production line runs above 120 m/min, request specific validation data for your speed range before committing to volume.
How does the ASTM D882 tensile test relate to peel strength evaluation for barrier film laminates?
ASTM D882 measures uniaxial tensile properties of the full film stack, while peel adhesion is measured separately by T-type or 180° peel methods (GB2790-81 in the Chinese standard framework). Both data sets are relevant: tensile gives you the composite’s structural integrity, peel gives you the interfacial bond specifically. For aluminized barrier films, peel strength and transfer observation at the adhesive interface are the more diagnostic measurements for adhesive qualification. Buyers should request both.
What should I look for in TGA data when evaluating an aluminized film adhesive?
Two things matter: the T5% onset temperature and the Tmax2 value. T5% below 270°C suggests a thermally unstable formulation that will degrade under processing or hot-storage stress. Tmax2 above 420°C indicates adequate soft segment content with sufficient heat resistance — in the validated system this was 423.39°C, compared to 418.96°C for the benchmark. Ask for TGA data generated under nitrogen at 10°C/min ramp rate from 40°C to 700°C to ensure comparable test conditions.
Published by sinoraw.com Technical Team | Request a sourcing quote


