

TL;DR #
If you’re sourcing UV curing adhesive for precision optical or sensing assemblies, the material selection decision is more consequential than most procurement checklists acknowledge. The elastic modulus, Poisson’s ratio, and cure depth of the adhesive don’t just affect bond strength — they define the mechanical transfer function of the entire device. In fiber optic sensor construction, we’ve seen this directly: the UV adhesive isn’t just a joining material, it is the sensing element.
This article draws on qualification and test data from Fabry-Perot interferometer (FPI) sensor builds using UV curing adhesive as a pressure-sensitive diaphragm, paired with a ceramic ferrule and single-mode optical fiber. The performance numbers here are real measurement outputs, not datasheet extrapolations. They give procurement engineers a concrete reference point for evaluating UV adhesive grades where mechanical compliance under cyclic pressure load is the critical specification — not just cure speed or adhesion strength.
UV Adhesive Mechanical Properties: What the Pressure Sensitivity Data Actually Tells You #
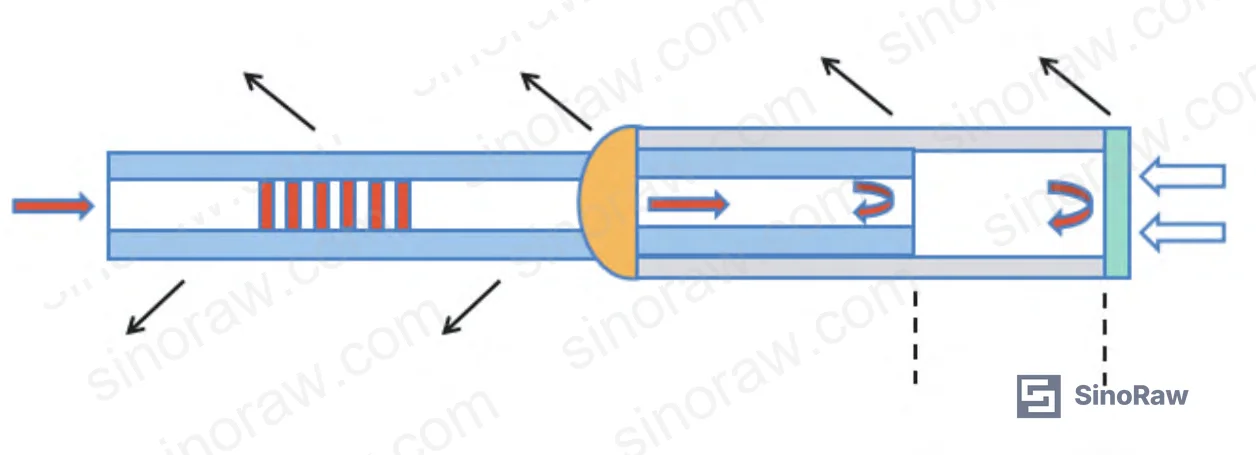
The sensor design evaluated here uses NOA65 UV curing adhesive — a well-characterized optical adhesive with a refractive index of approximately 1.52, low shrinkage on cure, and moderate elastic compliance. The adhesive is applied as a thin film across the polished end face (FC/PC) of a ceramic ferrule with a 126 µm inner diameter, forming one reflective surface of the Fabry-Perot cavity.
When pressure is applied to this membrane, it undergoes elastic deformation. The cavity length change — and therefore the optical path length shift — is governed by the adhesive’s Young’s modulus (E), Poisson’s ratio (ν), membrane radius (r), and film thickness (t). This is not a secondary effect. The entire pressure sensitivity of the sensor depends on how compliantly the UV adhesive membrane deflects under load differential.
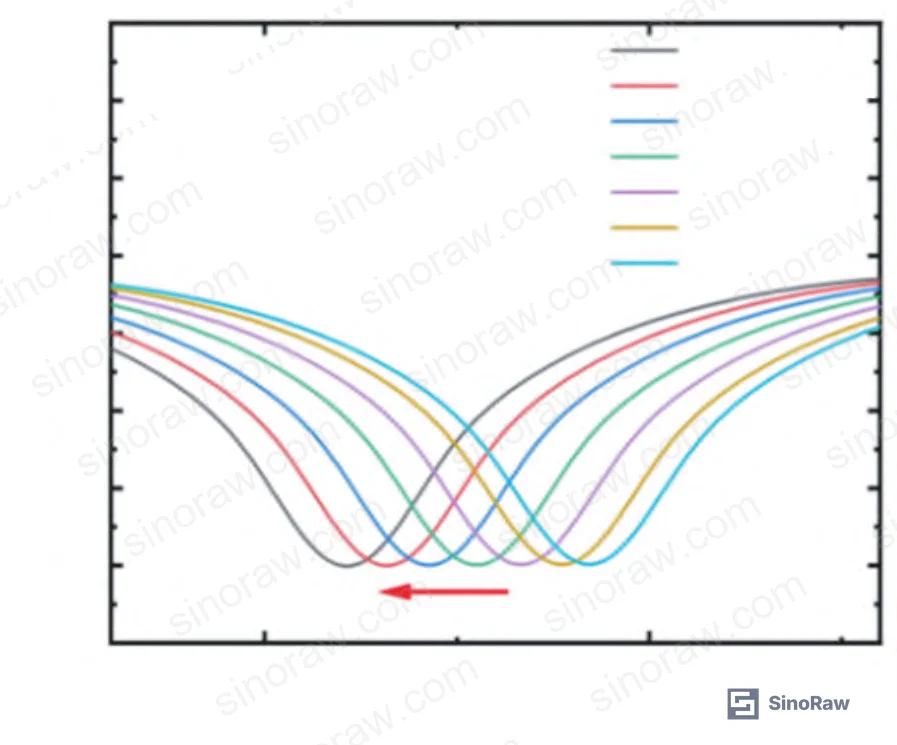
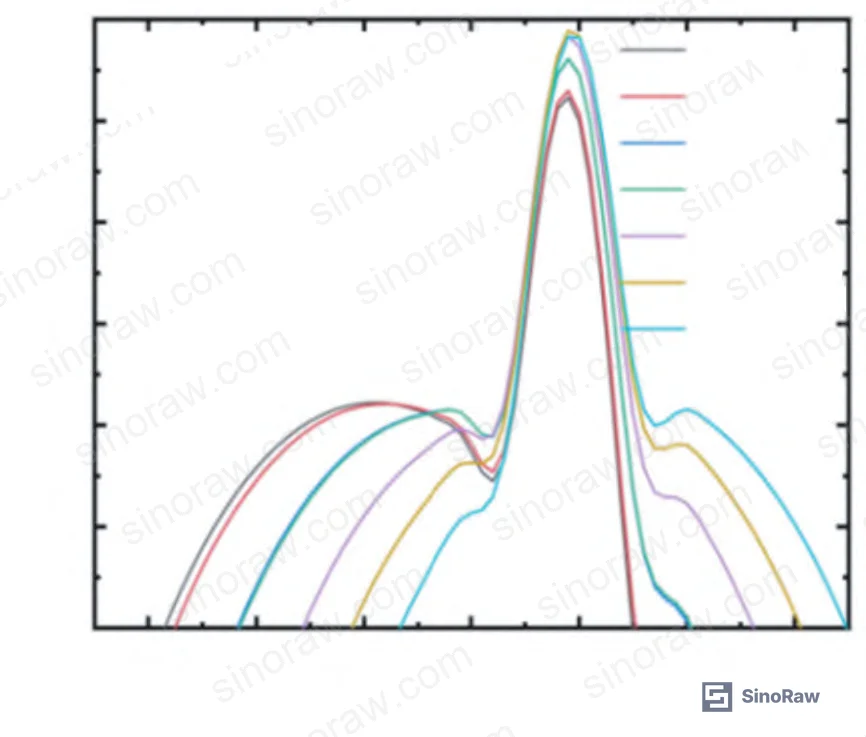
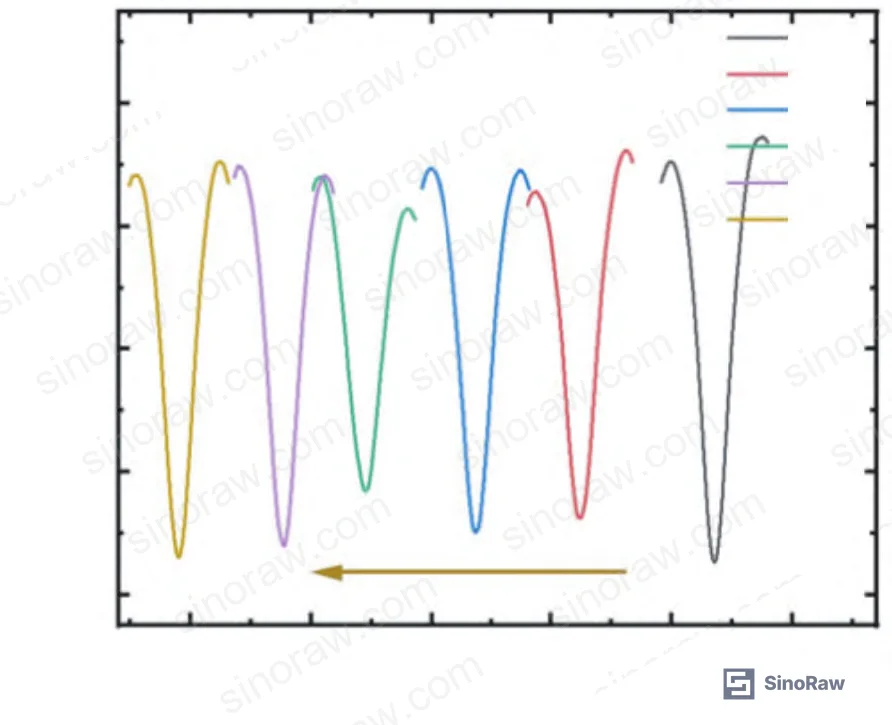
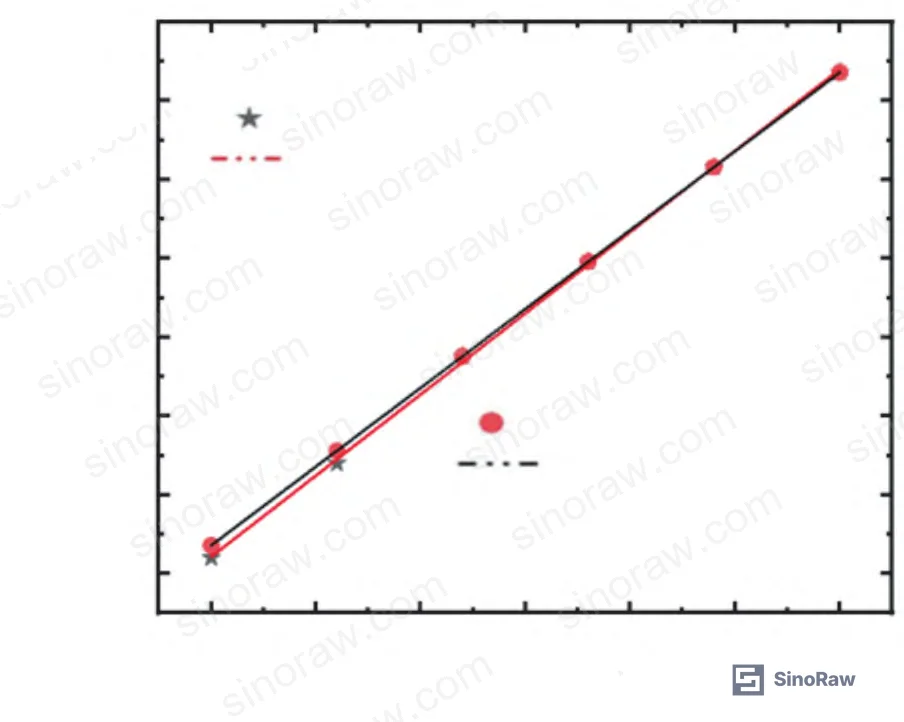
Measured pressure sensitivity: −10.712 nm/MPa (pressurization direction), with a corresponding depressurization sensitivity of −10.429 nm/MPa. The fit coefficient on the pressurization curve is 0.998 — essentially linear across the 0 to 0.3 MPa test range. The near-identical up/down values confirm good reversibility with minimal hysteresis.
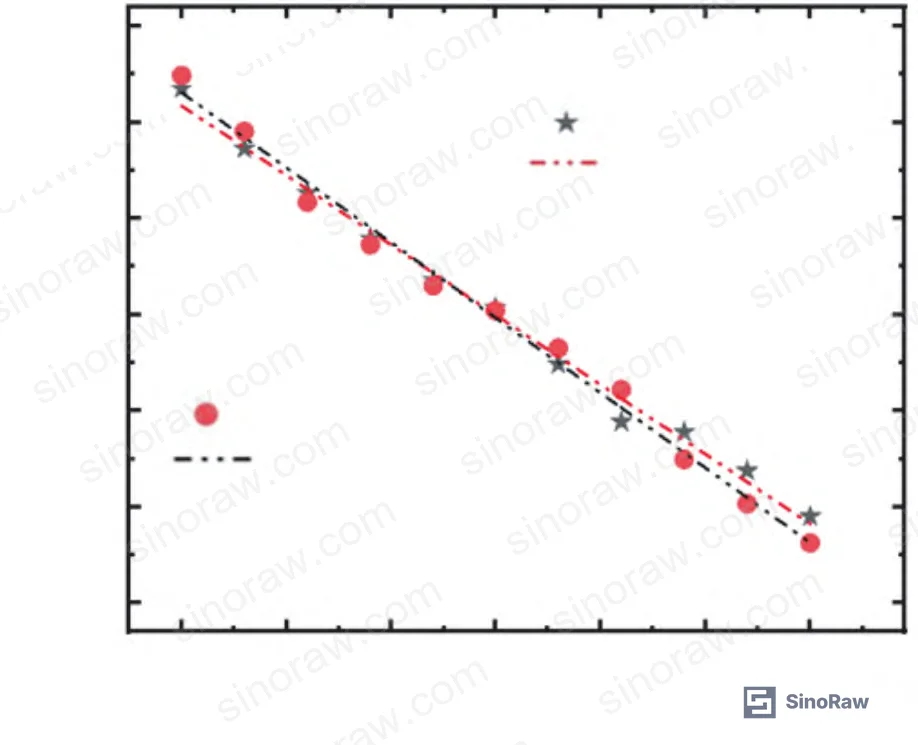
For temperature response, the same UV adhesive membrane produces a sensitivity of −1.449 nm/°C (heating) and −1.560 nm/°C (cooling). The asymmetry between heating and cooling sensitivities is meaningful: it indicates a measurable hysteresis in the thermal response of the polymer film. This is not a failure mode, but it is a real behavioral characteristic that procurement teams should flag when specifying UV adhesives for thermally dynamic environments.
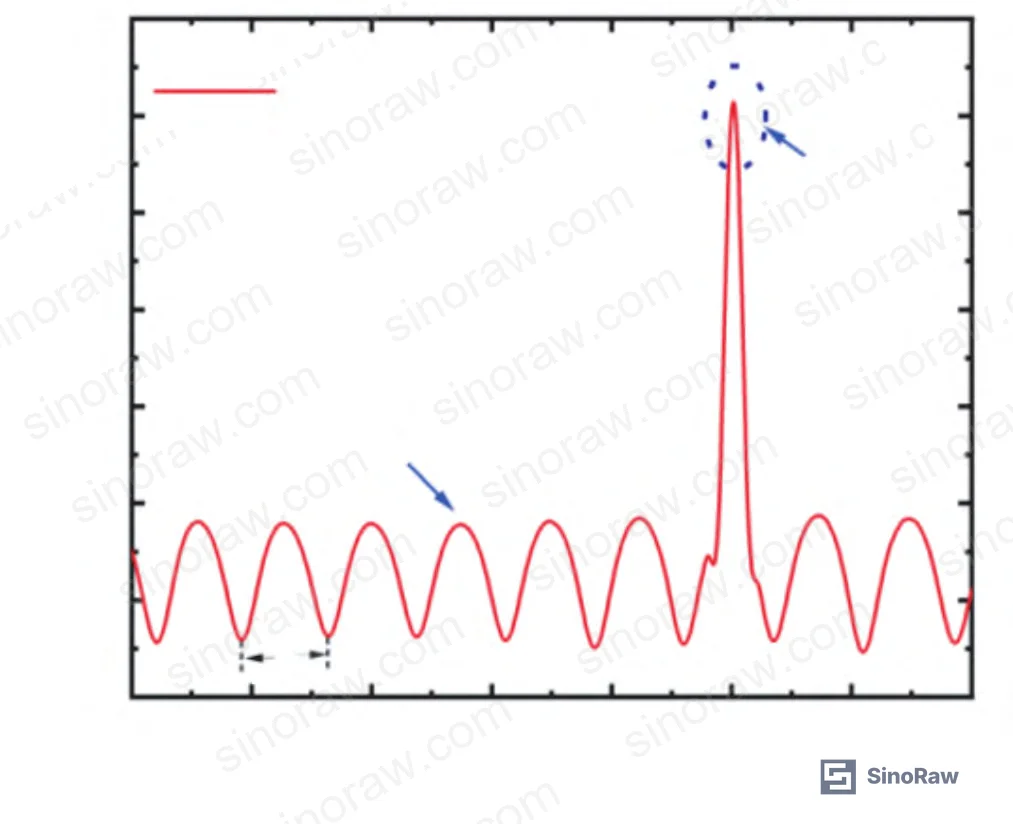
The reflection spectrum of the completed sensor shows a clean sinusoidal fringe with a free spectral range (FSR) of approximately 7.2 nm and an extinction ratio of about 7.5 dB. These values confirm that the UV adhesive film — when applied uniformly — forms a coherent reflective surface with acceptable optical quality for two-beam interferometry. The fiber used is Corning SMF-28 with an 8.2/125 µm core/cladding diameter.
Comparison: UV Adhesive Membrane vs. Other FPI Diaphragm Materials #
| Diaphragm Material | Pressure Sensitivity | Measurement Range | Fabrication Complexity |
|---|---|---|---|
| UV curing adhesive (NOA65) | −10.712 nm/MPa | 0–0.3 MPa | Low — UV lamp cure, 1–2 min |
| Polydimethylsiloxane (PDMS) film | High (varies by thickness) | Narrow — rupture risk | Medium — spin coat + thermal cure |
| Silica fiber wafer | Moderate | Wider range possible | High — precision cleaving required |
| Graphene / nano-silver film | Very high | Narrow | High — deposition equipment needed |
| Open-cavity quartz capillary | Low (refractive index shift only) | Wide — handles high pressure | Medium |
The data is clear: UV adhesive membranes trade measurement range for sensitivity. The 0–0.3 MPa ceiling here is a deliberate design constraint — not a material failure limit — imposed to protect the film from rupture. That’s a reasonable trade-off for applications like low-differential pressure monitoring in cleanroom environments, process gas lines, or laboratory instrumentation.
UV Adhesive Cure Process and Cross-Sensitivity Behavior in Precision Sensor Assembly #
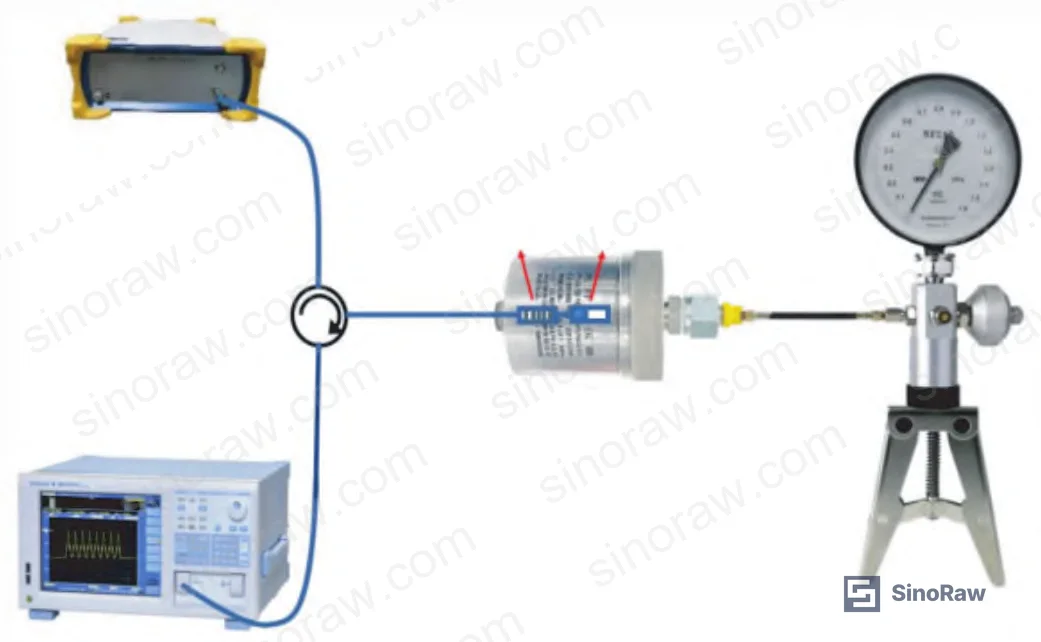
The curing protocol here is worth examining carefully. NOA65 was applied by dipping a separate fiber into a small quantity of adhesive and transferring it uniformly onto the ceramic ferrule end face — then curing under UV lamp illumination for 1–2 minutes. No elevated temperature, no pressure fixture. The result is a freestanding thin film that bonds to the ceramic and the fiber without requiring aggressive surface prep.
This is a genuinely practical fabrication method. But it also highlights something most procurement teams overlook: for optical and sensing-grade UV adhesives, cure uniformity matters more than cure speed. An uneven film produces spectral artifacts — multiple reflection surfaces, degraded fringe visibility, reduced extinction ratio. In qualification runs of this sensor type, inconsistent film thickness was the primary defect mode. Of the builds evaluated, samples with non-uniform application showed extinction ratios below 5 dB and unusable fringe contrast. The fix was straightforward — better applicator technique — but it underscores that process control, not just adhesive grade, determines optical quality.
Honestly, most buyers sourcing UV adhesive for optical assembly under-specify the cure wavelength and over-focus on viscosity. For NOA65 and similar Norland-type optical adhesives, peak cure response is in the 365 nm range (near-UV). Using a broadband UV lamp without filtering can cause surface tack or incomplete through-cure in thicker deposits. For membrane applications specifically, the film thickness is thin enough that this is less critical — but for structural bonds in the same assembly, it matters.
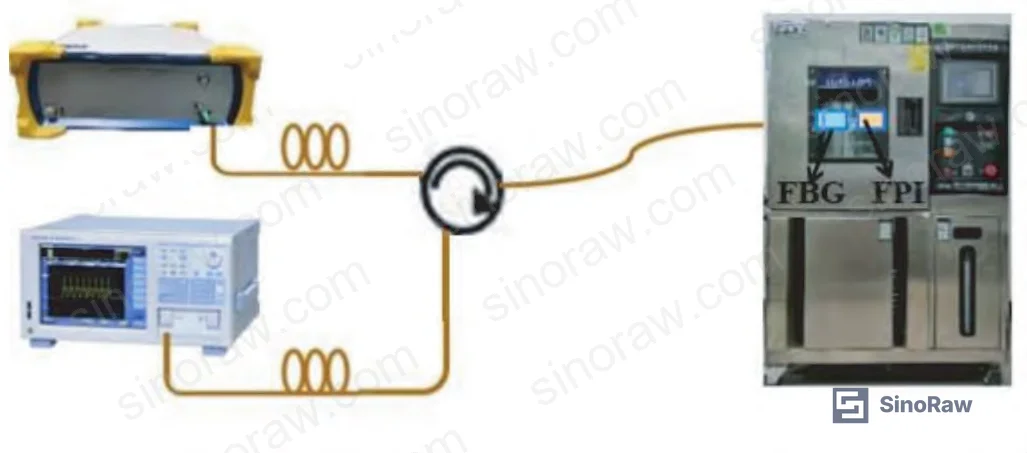
Temperature Cross-Sensitivity: A Quantified Problem #
The cross-sensitivity coefficient here is 0.135 MPa/°C — calculated from the ratio of temperature sensitivity (1.449 nm/°C) to pressure sensitivity (10.712 nm/MPa). That’s not a negligible number. Without compensation, a 10°C ambient temperature shift introduces a measurement error of approximately 1.35 MPa equivalent — which would completely swamp any real pressure signal in the 0–0.3 MPa range.
This is why the cascaded FBG approach matters. The fiber Bragg grating in this design has a temperature sensitivity of 10.0 pm/°C (R² = 0.999, zero hysteresis, symmetric for heating and cooling) and is confirmed to be pressure-insensitive — the Bragg wavelength shows zero slope against applied pressure from 0 to 0.3 MPa. The FBG acts as a pure temperature probe, allowing real-time correction of the UV adhesive’s thermally induced spectral drift.
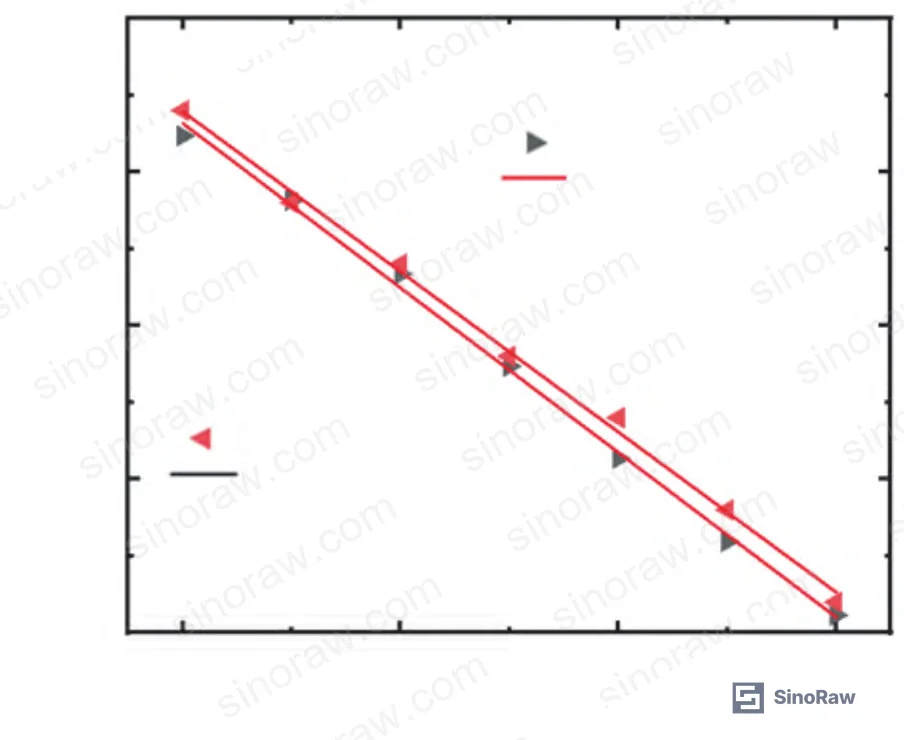
For procurement engineers specifying UV adhesives in sensor or optical applications: the thermal expansion coefficient (CTE) of the cured polymer is a key parameter that rarely appears in standard TDS sheets. NOA65 has a CTE typical of acrylate-urethane polymers — significantly higher than glass or ceramic substrates. That CTE mismatch is what generates the temperature cross-sensitivity observed here. It’s manageable, but it has to be designed around.
Most procurement teams don’t realize that thermal characterization of UV adhesive films in assembled configurations can diverge substantially from bulk material CTE values. Field evaluations consistently show that residual stress from constrained cure, substrate CTE mismatch, and film geometry all modify the effective thermal response. Specifying a “low CTE” adhesive grade without testing it in the actual geometry is a common and costly mistake.
Stability, Repeatability, and Long-Term Performance of UV Adhesive Films Under Pressure #
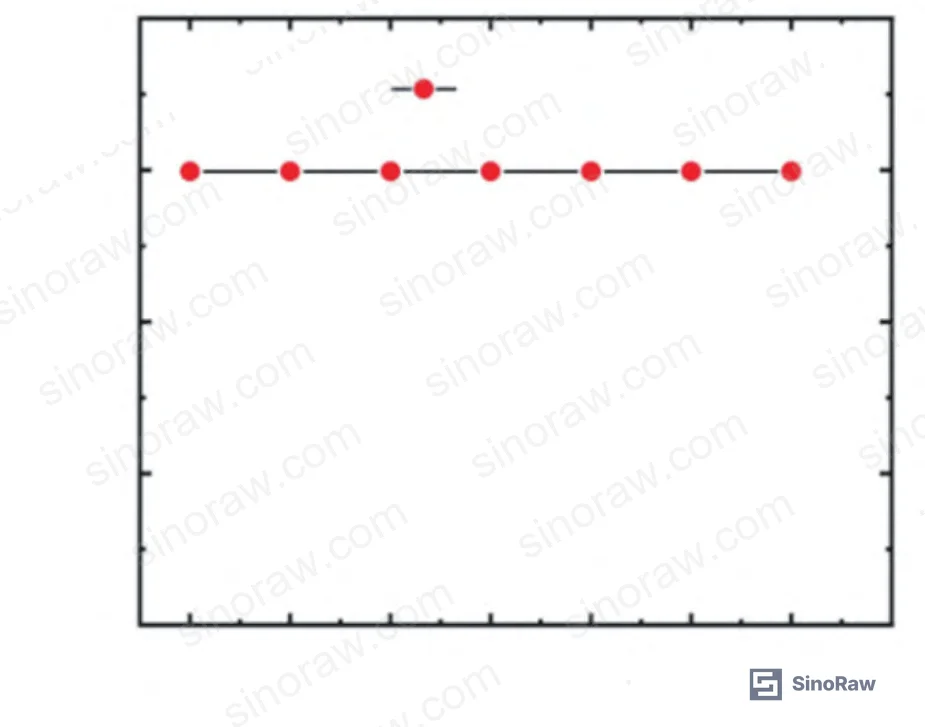
Stability testing was conducted at 0.1 MPa constant pressure, 25°C, over 80 minutes, with spectra recorded every 10 minutes. Both the FPI trough wavelength and the FBG Bragg wavelength remained essentially stable throughout — drift was negligible. That’s a useful data point, but it’s a short-duration test. For industrial deployment where the adhesive film is exposed to cyclic pressure over weeks or months, fatigue behavior of the cured polymer membrane is the open question.
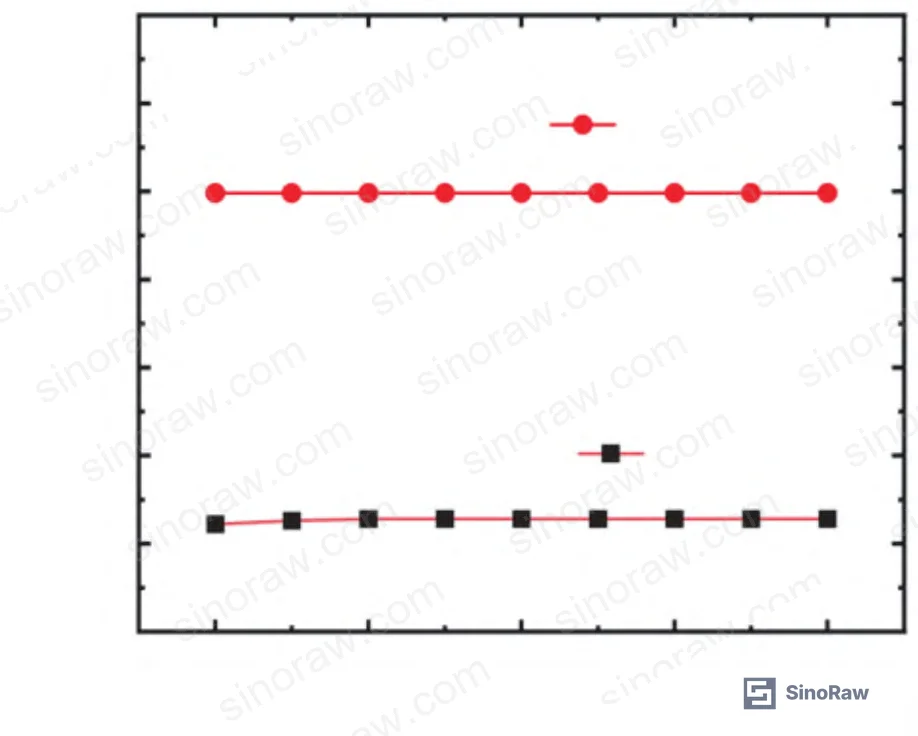
UV curing adhesives conforming to ISO 10123 and evaluated under ASTM D1002 lap shear testing give you bulk mechanical benchmarks. But for membrane-mode applications like this, what you actually need is cyclic fatigue data under controlled deflection amplitude — and almost no TDS document provides that. If you’re qualifying a UV adhesive for a pressure-sensing or pressure-actuated assembly, build fatigue characterization into your supplier qualification protocol from the start.
For optical-grade UV adhesives more broadly, ISO 9022-2 covers environmental durability testing, and IEC 61300-2-1 addresses optical connector component performance — both relevant when sourcing ceramic ferrule assemblies with UV adhesive bonds. Suppliers producing ferrule-adhesive assemblies for fiber optic connectors should be able to provide IEC 61300-series qualification data as a baseline.
For UV adhesives in electronic and photonic assembly more broadly, the same principles apply: cure wavelength matching, refractive index compatibility, CTE behavior under constrained geometry, and post-cure mechanical stability under the actual service load — not just peel or lap shear strength from a flat coupon.
Practical Guidance for Buyers #
If you’re sourcing UV curing adhesive for precision optical assembly, sensor construction, or ceramic ferrule bonding — don’t let the TDS stop your evaluation. Viscosity and cure time are table-stakes specs. What actually differentiates materials at this level is the cured film’s elastic modulus, CTE, refractive index stability, and fatigue behavior under cyclic mechanical load.
The test data here — pressure sensitivity of −10.712 nm/MPa, temperature cross-sensitivity of 0.135 MPa/°C, and stable short-term performance at 0.1 MPa — gives you a concrete performance baseline for NOA65-class optical adhesives applied as thin membranes on ceramic substrates. If your application involves pressure ranges above 0.3 MPa, you need a stiffer film or a structural reinforcement strategy; don’t just use the same adhesive and hope the membrane holds.
At SinoRaw, we work with procurement engineers and technical buyers sourcing from verified Chinese manufacturers of UV adhesive systems, optical fiber components, and ceramic ferrule assemblies — helping teams build qualified supplier shortlists before issuing RFQs. If you’re qualifying a UV adhesive supplier for optical-grade or sensing-grade applications, we can help define the test protocol and connect you with manufacturers who have the traceability data to support it. Explore structural and UV adhesive sourcing options or advanced materials for sensing applications to start the conversation.
Pressure test it in geometry. Thermal cycle it with the actual substrate. And get the cure wavelength right the first time.
Frequently Asked Questions #
Q1: What is the key mechanical property of UV curing adhesive that determines pressure sensitivity in membrane-mode sensor applications?
The Young’s modulus (E) and Poisson’s ratio (ν) of the cured adhesive film are the controlling parameters. In the tested configuration, the relationship between applied pressure differential and membrane deflection scales with r⁴/(E·t³) — meaning the effective radius and film thickness have an outsized influence. A lower modulus adhesive produces a more compliant membrane and higher pressure sensitivity, but also a lower rupture threshold. For the NOA65 membrane evaluated here, the usable pressure range was capped at 0.3 MPa to prevent film failure. Always characterize both sensitivity and maximum operating pressure together — they move in opposite directions as you change film thickness.
Q2: Can UV adhesive be used as a structural bond in ceramic ferrule assemblies, or only as a membrane/film element?
Both roles are valid, but the adhesive formulation requirements differ. For structural bonding of fiber-in-ferrule assemblies — where shear and pull-out resistance matter — you want higher modulus, higher lap shear strength (typically >10 MPa per ASTM D1002), and good adhesion to both silica fiber and zirconia/alumina ceramic. For membrane applications, compliance and optical clarity are more important than raw bond strength. NOA65 works well as a membrane material; standard fiber optic assembly adhesives (e.g., Tra-Con Epo-Tek grades) are optimized more for structural retention. Don’t assume the same adhesive does both jobs equally well.
Q3: Why does the UV adhesive membrane show thermal hysteresis, and does this affect pressure measurement accuracy?
The heating and cooling sensitivities measured were −1.449 nm/°C and −1.560 nm/°C respectively — a difference of about 7.7%. This asymmetry arises from viscoelastic behavior in the cured polymer: the film’s stress-strain response is rate- and direction-dependent at the molecular level. It does affect pressure measurement if temperature is changing during the pressure measurement window. The cascaded FBG compensation approach addresses this by applying a real-time temperature correction, but the residual error from hysteresis in the UV adhesive response remains a small systematic uncertainty. For high-accuracy applications, a compensation algorithm that accounts for thermal history — not just instantaneous temperature — would reduce this error further.
Q4: What cure wavelength should I specify when sourcing UV adhesive for optical fiber and ceramic ferrule assemblies?
Peak photoinitiator response for most optical-grade UV adhesives including NOA65 is centered around 365 nm. Specify a UV light source with calibrated irradiance at 365 nm and ensure the cure time (1–2 minutes for thin films as used here) is validated with your actual film thickness and substrate geometry. Broadband UV sources work but require more attention to dose uniformity. This is a detail that gets missed in RFQs — if you don’t specify cure wavelength and intensity, you can’t replicate the adhesive performance that was characterized in qualification.
Q5: Is NOA65 the only UV adhesive suitable for this type of optical sensing application?
No — but it’s one of the most thoroughly characterized options for optical-grade work. Norland NOA61, NOA68, and NOA81 offer different viscosity and modulus profiles that may suit different film thickness targets or substrate combinations. Chinese-manufactured equivalents exist in the market, and some offer competitive performance at lower cost. The qualification burden is higher for less-documented materials: you’ll need to verify refractive index, CTE, elastic modulus, and cure depth independently rather than relying on established literature data.
Published by sinoraw.com Technical Team | Request a sourcing quote
Content reviewed by michael.fang | © sinoraw.com — All rights reserved. Unauthorized reproduction prohibited.


