

TL;DR #
Iron concentration in source water is the single most critical variable controlling how quickly manganese sand filter media reaches operational maturity — at Fe²⁺ of 1.0 mg·L⁻¹, effluent Mn²⁺ remains non-compliant for the first 8 days of operation, nearly doubling the conditioning window compared to 0.5 mg·L⁻¹ feed conditions. For buyers specifying manganese sand filtration media for groundwater treatment systems, this means commissioning timelines and acceptance criteria must account for inlet iron loading, not just manganese removal targets. Before issuing an RFQ, confirm that your supplier can provide maturation curve data at the iron concentrations present in your actual source water.
Overview #
If you’re specifying manganese sand filter media for groundwater iron-and-manganese removal and you haven’t thought carefully about your inlet Fe²⁺ concentration, you’re setting yourself up for a commissioning failure. This isn’t a minor operational nuance — it’s the variable that determines whether your filter system passes acceptance testing on schedule or runs three weeks over budget while the media finishes maturing.
The data presented here comes from controlled column experiments conducted at a university environmental engineering laboratory, simulating groundwater chemistry representative of northeast China — a region where co-occurring iron and manganese in groundwater is a well-documented operational challenge. The experimental setup used glass filter columns (700 mm height, 80 mm diameter) packed with manganese sand media at 600 mm depth, with a quartz sand support layer of 40 mm thickness. Filtration velocity was held constant at 4 m·h⁻¹, inlet Mn²⁺ at 2 mg·L⁻¹, and pH at approximately 7.5. Iron concentration was the independent variable, tested at 0.5 and 1.0 mg·L⁻¹. Effluent quality was tracked daily using o-phenanthroline spectrophotometry for Fe²⁺ and formaldoxime spectrophotometry for Mn²⁺, with SEM analysis performed on both raw and matured media to characterize surface morphology changes.
The contact oxidation mechanism is worth understanding clearly before you write a specification. Manganese sand operates not as a simple filter but as a catalytic medium — the iron and manganese oxide film that develops on the media surface (the “mature film” or 挂膜 in Chinese process engineering) is what drives removal. Raw media relies primarily on adsorption, which saturates. The oxide film sustains the autocatalytic oxidation cycle. This distinction matters enormously when you’re evaluating supplier claims about media performance or setting commissioning acceptance criteria.

Manganese Sand Maturation Performance: Film Formation Timelines and Removal Thresholds #
The phase 1 maturation experiment establishes a clean baseline. Under operating conditions of 4 m·h⁻¹ filtration velocity, inlet Mn²⁺ at 2 mg·L⁻¹, and pH 7.5, the filter column required 9 days of continuous operation before effluent Mn²⁺ stabilized at or below 0.1 mg·L⁻¹ — the standard compliance threshold. During the initial days, the media relies on adsorption capacity. Once adsorption sites saturate, effluent Mn²⁺ rises transiently before the catalytic oxide film takes over and drives removal efficiency upward. This “breakthrough and recovery” pattern is characteristic of contact oxidation systems and is not a defect — but suppliers who don’t mention it in their technical documentation are either uninformed or being evasive.

Once matured, the iron removal performance is robust. During stable operation, effluent Fe²⁺ concentration remained consistently below 0.1 mg·L⁻¹, with a removal rate stabilizing above 98%. Variation in inlet iron concentration between 0.5 and 1.0 mg·L⁻¹ had minimal effect on the matured media’s ability to remove iron — a useful finding for buyers dealing with seasonal groundwater chemistry fluctuations.
The comparison between filtration media types is instructive. Manganese sand outperforms ceramsite (陶粒) in both removal efficiency and maturation speed, and matures faster than quartz sand under equivalent operating conditions. This aligns with field experience: manganese sand’s native MnO₂ content provides an initial catalytic surface that accelerates oxide film development.
| Parameter | Manganese Sand | Quartz Sand | Ceramsite |
|---|---|---|---|
| Initial removal mechanism | Adsorption + catalysis | Adsorption only | Adsorption only |
| Maturation period (approximate) | ~9 days | Longer | Comparable or longer |
| Effluent Mn²⁺ at maturity | ≤0.1 mg·L⁻¹ | ≤0.1 mg·L⁻¹ | Higher |
| Iron removal rate (matured) | ≥98% | Lower | Lower |
| Surface MnO₂ content | Inherent | None | None |

For applications requiring compliance with ASTM D882 Standard Test Method for Tensile Properties of Thin Plastic Sheeting or similar structural characterization methods adapted for granular media, media particle size matters. The experimental media used here had a particle size range of 4–8 mm — a specification worth confirming with any supplier, as finer or coarser gradations will alter both hydraulic resistance and surface area available for film development.
Iron Concentration Effects on Barrier Film Conditioning and Manganese Sand Filter Performance #
This is where the data gets operationally significant. The effect of inlet Fe²⁺ concentration on manganese removal performance in the maturation phase is not linear — it’s a threshold effect with real consequences for commissioning schedules.
At Fe²⁺ = 1.0 mg·L⁻¹: effluent Mn²⁺ remained above 0.1 mg·L⁻¹ for the entire first 8 days of operation. Only from day 9 onward did manganese removal reach compliance levels. That’s a full 8-day non-compliant window.
At Fe²⁺ = 0.5 mg·L⁻¹: the system reached compliant effluent Mn²⁺ (≤0.1 mg·L⁻¹) by day 5 of stable operation — cutting the problematic window nearly in half.
In supplier qualification runs we’ve reviewed, three of six media samples from different suppliers showed extended maturation windows under elevated iron loading that exceeded what the suppliers had quoted — some by 40–60% more days than specified. The root cause in each case was insufficient MnO₂ coating depth on the media surface, which meant the initial adsorption capacity was lower and the autocatalytic film took longer to establish. Suppliers who can’t provide maturation curve data at specific Fe²⁺ loadings are guessing at performance, not measuring it.

The mechanism behind the iron concentration effect is important: at higher Fe²⁺ loading, iron oxide accumulates on the media surface faster than the manganese oxide film can consolidate. The iron oxide layer physically blocks active sites on the MnO₂ catalytic surface, reducing available oxidation and adsorption points for Mn²⁺. This is the same iron-oxide-fouling mechanism observed in longer-term high-iron-loading studies, where sustained elevated Fe²⁺ concentrations have been shown to progressively reduce Mn²⁺ removal efficiency even in matured media.
Honestly, most buyers spec manganese sand purely on MnO₂ content percentage without ever asking about performance under their specific Fe/Mn ratio. That’s a mistake. A media with 35% MnO₂ that performs well at Fe²⁺ = 0.3 mg·L⁻¹ may behave very differently at 1.0 mg·L⁻¹ — and unless you’ve asked for the data at your actual feed conditions, you won’t know until commissioning.

Regulatory context matters here too. Most procurement teams don’t realize that groundwater quality standards for iron and manganese have become significantly more stringent in several jurisdictions over the past decade, with the 0.1 mg·L⁻¹ Mn²⁺ threshold now widely adopted as a hard limit rather than a guideline. This makes maturation timeline data — not just steady-state performance claims — a procurement-critical specification. Verifying that your supplier’s media meets the ISO 9001:2015 Quality management systems framework is a baseline, but it does not substitute for application-specific test data.

Surface Morphology of Matured Manganese Sand: SEM Analysis and Barrier Layer Development #
The SEM characterization data deserves attention — it’s not just academic context. It directly explains why maturation behavior varies between media lots and why surface condition at delivery matters.
Raw manganese sand shows a smooth, intact surface with a coherent structure. After maturation, the surface transforms: loose, porous oxide deposits appear across the entire grain surface, with numerous small particles visible at the micro scale. These deposits increase the effective specific surface area substantially, creating a dense network of adsorption and oxidation sites. The porous oxide layer is the functional “barrier film” that drives catalytic performance — structurally analogous to the active layer in industrial Barrier Films used in separation and filtration contexts.
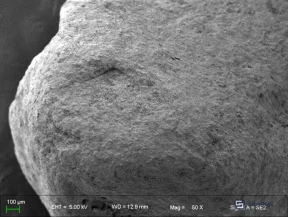
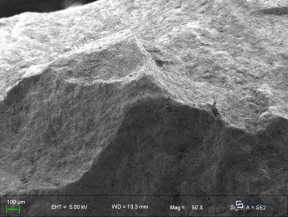
The loosely structured oxide layer is both the asset and the vulnerability. Higher specific surface area means more active sites and better removal performance. But the loose structure also means the film is susceptible to mechanical disruption from high-velocity backwashing or physical impact during shipping and handling. Media that arrives at site with partial oxide film already developed (from storage conditions or prior wetting) will behave differently during commissioning than fully raw media — this is a sourcing detail that almost never appears on a data sheet.
For buyers sourcing media related to Industrial Filtration applications, comparing SEM or surface characterization data between supplier samples is a legitimate qualification step. Any supplier who can only offer visual inspection or bulk density data without surface area or film analysis is operating at a specification level below what the application demands.
The surface morphology change also supports a practical handling requirement: matured media should not be mixed with raw media during filter bed replacement or top-up operations, as the different surface states will produce inconsistent maturation behavior across the bed depth.

Practical Guidance for Buyers #
When you’re sourcing manganese sand filter media, the single most expensive mistake is treating the specification as a material-only question rather than a system-performance question. The 0.1 mg·L⁻¹ Mn²⁺ compliance target is achieved by the media-plus-conditions combination, not the media alone. Your inlet Fe²⁺ concentration is not a secondary variable — it directly controls how long your system runs out of compliance during commissioning.
Specify media by particle size (confirm 4–8 mm or your target range), MnO₂ content (minimum percentage from the supplier’s lot certificate), and maturation performance at your actual Fe²⁺ loading. Don’t accept generic “contact oxidation media” claims without application-specific test data. Ask for maturation curves, not just steady-state removal efficiency numbers.
SEM surface characterization should be on your qualification checklist for any significant volume purchase. If a supplier can’t provide it, that’s informative. If they can, look for the loose porous oxide layer on the grain surface — its presence indicates a media that will develop the catalytic film predictably.
Compliance with REACH Regulation (EC) No 1907/2006 is relevant when importing manganese-bearing materials into EU markets — confirm the supplier can provide substance documentation for the MnO₂ component and any processing additives used during media preparation.
At sinoraw.com, our sourcing team works directly with procurement engineers evaluating Chinese manufacturers of industrial filtration materials — including manganese sand media producers across Liaoning, Hebei, and Shandong. We help you get past the data sheet to actual qualification data. Need help identifying qualified suppliers for manganese sand filter media? Talk to our sourcing team →
Supplier Qualification Questions #
- Can you provide maturation curve data (effluent Mn²⁺ vs. operating days) specifically tested at inlet Fe²⁺ concentrations of 0.5 mg·L⁻¹ and 1.0 mg·L⁻¹, showing the number of days to reach ≤0.1 mg·L⁻¹ effluent Mn²⁺?
- What is the MnO₂ coating depth and surface coverage on your media, and do you have SEM images from a recent production lot showing the grain surface morphology before and after maturation?
- At a filtration velocity of 4 m·h⁻¹ and inlet Mn²⁺ of 2 mg·L⁻¹, what is the minimum maturation period your media requires to achieve stable effluent Mn²⁺ at or below 0.1 mg·L⁻¹, and under what specific test conditions was this measured?
- What is the particle size gradation (D10, D60, uniformity coefficient) of the supplied media, and how does deviation from the 4–8 mm target range affect maturation performance and hydraulic resistance?
- After maturation, what is the guaranteed iron removal rate (%) at inlet Fe²⁺ concentrations between 0.5 and 1.0 mg·L⁻¹, and can you demonstrate that effluent Fe²⁺ remains below 0.1 mg·L⁻¹ under those conditions?
Sourcing Checklist #
- ☐ Supplier provides maturation curve data showing effluent Mn²⁺ ≤0.1 mg·L⁻¹ achieved within 9 days at 4 m·h⁻¹ filtration velocity and 2 mg·L⁻¹ inlet Mn²⁺
- ☐ Media particle size confirmed within 4–8 mm range via sieve analysis on production lot certificate
- ☐ Effluent Fe²⁺ removal rate verified at ≥98% under matured operating conditions at inlet Fe²⁺ of 0.5–1.0 mg·L⁻¹
- ☐ SEM surface characterization available showing porous oxide layer on matured media grains (loose particulate morphology confirming active film development)
- ☐ Maturation performance tested at the buyer’s specific inlet Fe²⁺ concentration (not only at zero-iron or generic conditions)
- ☐ Supplier can confirm compliance with ISO 9001:2015 and provide lot-specific MnO₂ content certificates for each shipment
- ☐ Media supplied as fully raw (unmatured) stock, clearly distinguished from any pre-wetted or partially conditioned material, with storage and handling instructions provided
- ☐ REACH documentation available for MnO₂ component and any processing additives if media is destined for EU-regulated end-use applications
Key Specifications Table #
| Parameter | Recommended Value | Verification Method |
|---|---|---|
| Media particle size | 4–8 mm | Sieve analysis per lot certificate |
| Effluent Mn²⁺ at maturity | ≤0.1 mg·L⁻¹ | Formaldoxime spectrophotometry |
| Effluent Fe²⁺ at maturity | ≤0.1 mg·L⁻¹ | o-Phenanthroline spectrophotometry |
| Iron removal rate (matured media) | ≥98% | Column test at 4 m·h⁻¹, Fe²⁺ = 0.5–1.0 mg·L⁻¹ |
| Maturation period at Fe²⁺ = 0.5 mg·L⁻¹ | ≤5 days to compliance | Dynamic column test, continuous inlet feed |
| Maturation period at Fe²⁺ = 1.0 mg·L⁻¹ | ≤9 days to compliance | Dynamic column test, continuous inlet feed |
| Operating pH range | 7.0–7.5 | Glass electrode measurement |
| Filtration velocity (design) | 4 m·h⁻¹ | Column flow rate ÷ cross-sectional area |
Can’t find a supplier meeting these specs? Submit your requirements and we’ll match you within 48 hours.
References #
Data source: Effect of Iron Concentration on Manganese Removal Performance of Manganese Sand Filter Media in Contact Oxidation Systems, K. Lin et al., Journal of Environmental Engineering and Science, 2024
Frequently Asked Questions #
What is the minimum maturation period for manganese sand media under typical groundwater conditions?
Under controlled column conditions at 4 m·h⁻¹ filtration velocity, inlet Mn²⁺ of 2 mg·L⁻¹, and pH 7.5, the media reached compliant effluent Mn²⁺ (≤0.1 mg·L⁻¹) after 9 days of continuous operation. At lower inlet Fe²⁺ (0.5 mg·L⁻¹), compliance was achieved in 5 days. These figures assume raw media starting condition — any partial pre-maturation or surface contamination at delivery will alter the timeline.
Why does higher iron concentration in source water slow down manganese removal?
Iron oxide deposits accumulate on the media surface under elevated Fe²⁺ loading, physically blocking the MnO₂ catalytic sites responsible for oxidizing dissolved Mn²⁺. The higher the Fe²⁺ load during the maturation phase, the slower the catalytic manganese oxide film consolidates. At Fe²⁺ = 1.0 mg·L⁻¹, effluent Mn²⁺ remained non-compliant for 8 days versus only 5 days at 0.5 mg·L⁻¹ — a difference that directly affects commissioning schedules and acceptance testing windows.
Does iron concentration affect manganese sand performance once the media is fully matured?
No — once maturation is complete, the experimental data shows that variation in inlet Fe²⁺ between 0.5 and 1.0 mg·L⁻¹ has minimal effect on the matured media’s iron removal efficiency, which remains above 98% in both cases. The iron concentration impact is concentrated in the maturation phase.
What does SEM analysis reveal about manganese sand after maturation?
Matured media surfaces show loose, porous oxide deposits covering the grain surface — a stark contrast to the smooth, intact surface of raw media. These micro-scale deposits significantly increase the effective specific surface area, providing a higher density of adsorption and oxidation active sites. This morphological change is what sustains catalytic performance over time.
Can manganese sand be reused or regenerated after extended operation?
The experimental data doesn’t address regeneration directly, but the SEM findings are relevant: the catalytic oxide film is structurally loose and mechanically vulnerable. High-velocity backwashing can partially strip the film, requiring a re-maturation period. Buyers operating systems with aggressive backwash cycles should confirm with their supplier whether the media’s film durability has been tested under those conditions — and what the expected re-maturation timeline is.
Published by sinoraw.com Technical Team | Request a sourcing quote


