

TL;DR #
Nano zero-valent iron loaded onto manganese sand filter media achieves over 70% removal of Sb(V) from water at an optimal Fe:MnSand loading ratio of 1:2, with removal efficiency dropping sharply above pH 5 and collapsing to ~40% in the presence of phosphate ions. Buyers specifying antimony-removal filter media must treat pH control and phosphate co-contamination as non-negotiable process constraints — ignoring either will invalidate your supplier’s performance claims. Before issuing any RFQ, require suppliers to provide BET surface area data (minimum 27 m²/g) and second-order kinetics fit data (R² ≥ 0.999) as baseline qualification criteria.
Overview #
Antimony (Sb) is one of the more insidious heavy metal contaminants in industrial wastewater — toxic, carcinogenic, and chronically under-specified in buyer procurement documents. Most buyers entering this category for the first time focus on adsorption capacity while underweighting the pH sensitivity and competitive ion interference that determine real-world performance. That’s a costly oversight.
The data informing this guide comes from controlled laboratory evaluations conducted at a Chinese university environmental engineering facility, involving systematic batch adsorption experiments across variable pH, dosage, loading ratios, and co-existing anion conditions. The composite material — nano zero-valent iron (nZVI) loaded onto manganese sand filter media — was characterized using XRD, XPS, and BET surface area analysis. Sb(V) concentrations were quantified via ICP-OES (PE/Optima 8000), with samples filtered through 0.45 μm membranes prior to measurement. This is not theoretical modelling — it’s bench-scale qualification work with directly applicable procurement thresholds.
China’s surface water standard (GB 3838—2002) and drinking water hygiene standard (GB 5749—2006) both cap antimony at 5 μg/L maximum. That regulatory ceiling is what drives the performance bar for any qualified supplier in this space.
For buyers sourcing industrial filtration media or advanced materials for water treatment applications, the sections below translate experimental results into concrete supplier qualification criteria.
Nano Zero-Valent Iron Loading Ratio: The Parameter Most Buyers Get Wrong #
The single most consequential variable in nZVI-loaded manganese sand performance is not pH — it’s the iron-to-manganese-sand loading ratio. This is where procurement teams consistently over-specify iron content, believing more reactive material means better removal. It doesn’t.
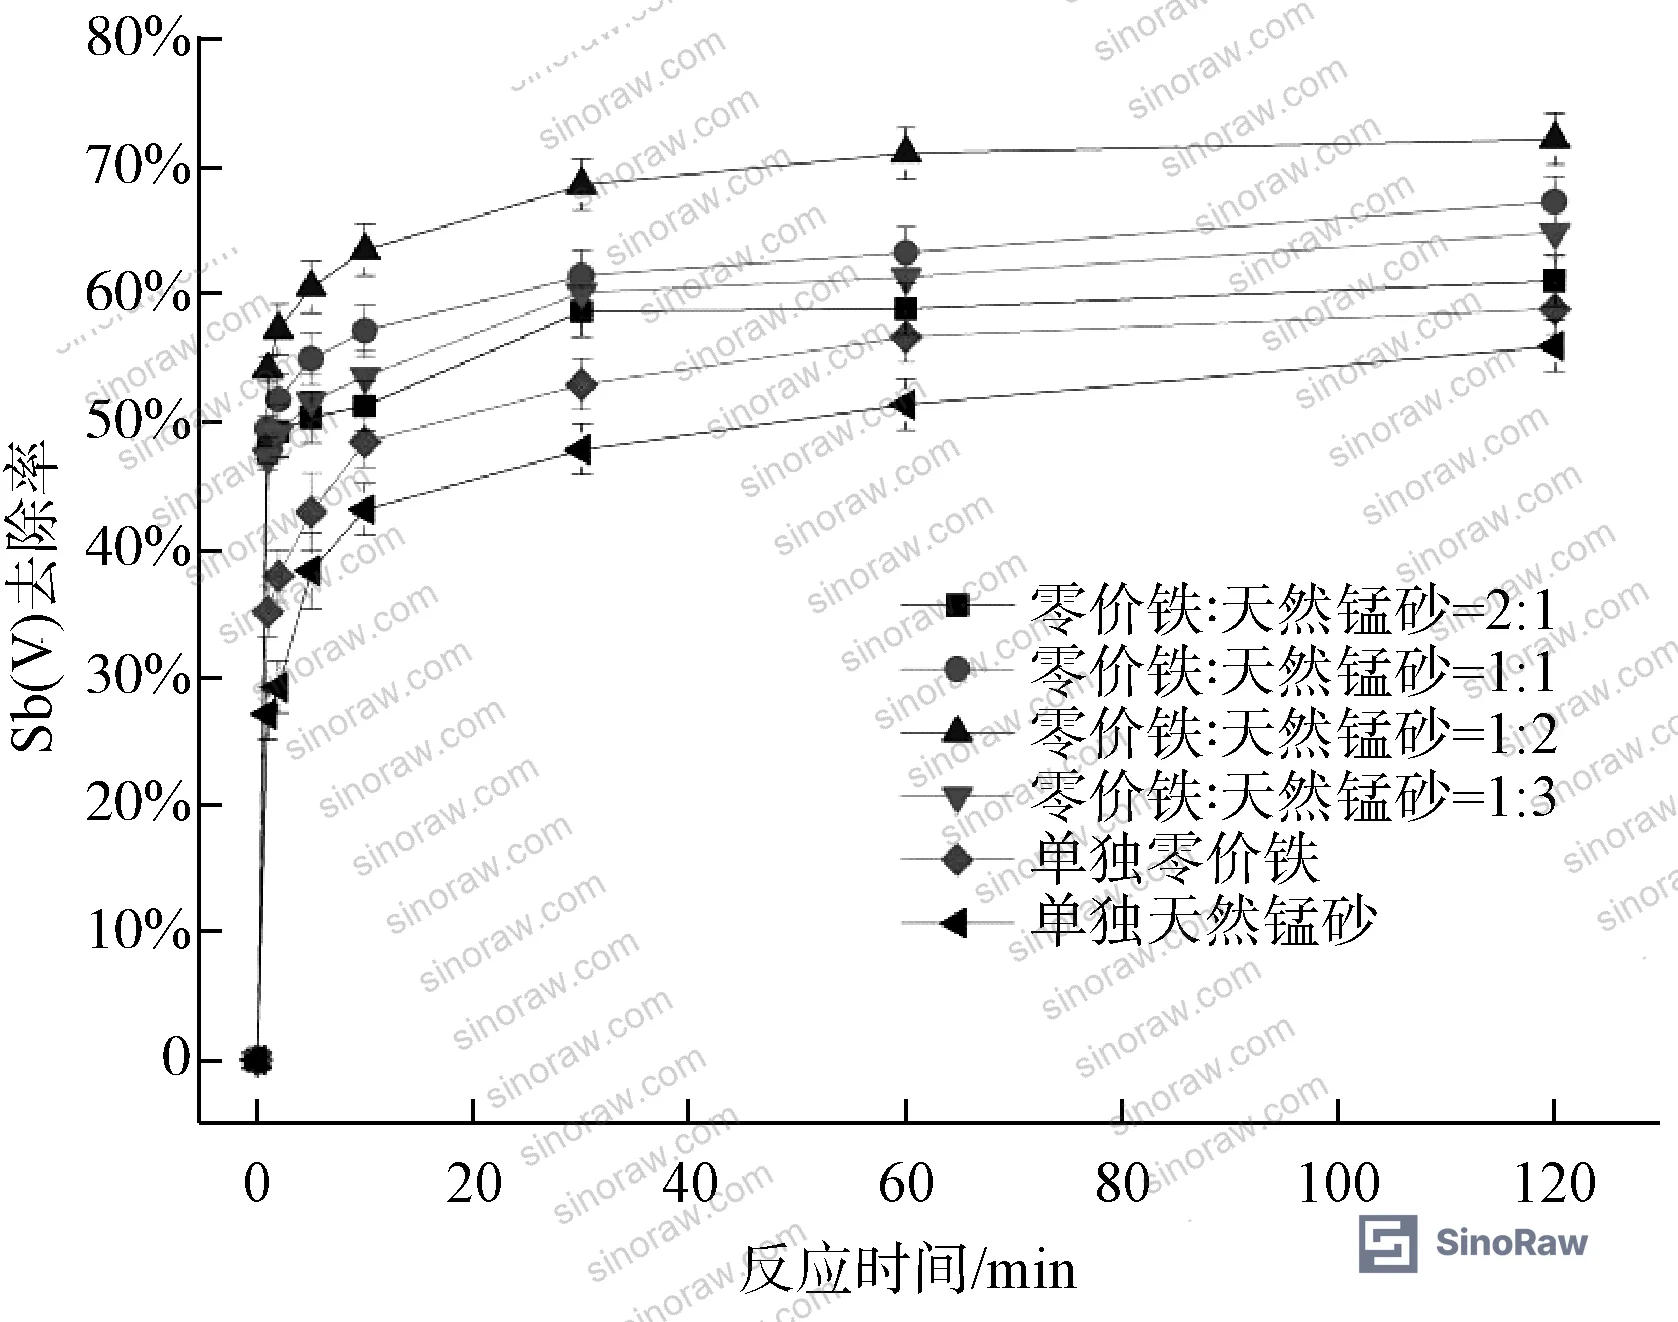
At a nZVI:manganese sand ratio of 1:2 (by mass), Sb(V) removal performance peaks. Standalone zero-valent iron alone achieves only ~50% removal because it provides reduction capacity but insufficient adsorption sites. Natural manganese sand alone, without the zero-valent iron reductant, also tops out at ~50% for Sb(V) — it has surface adsorption sites but cannot reduce Sb(V) to the more readily adsorbed Sb(III) form. The synergy is what matters.
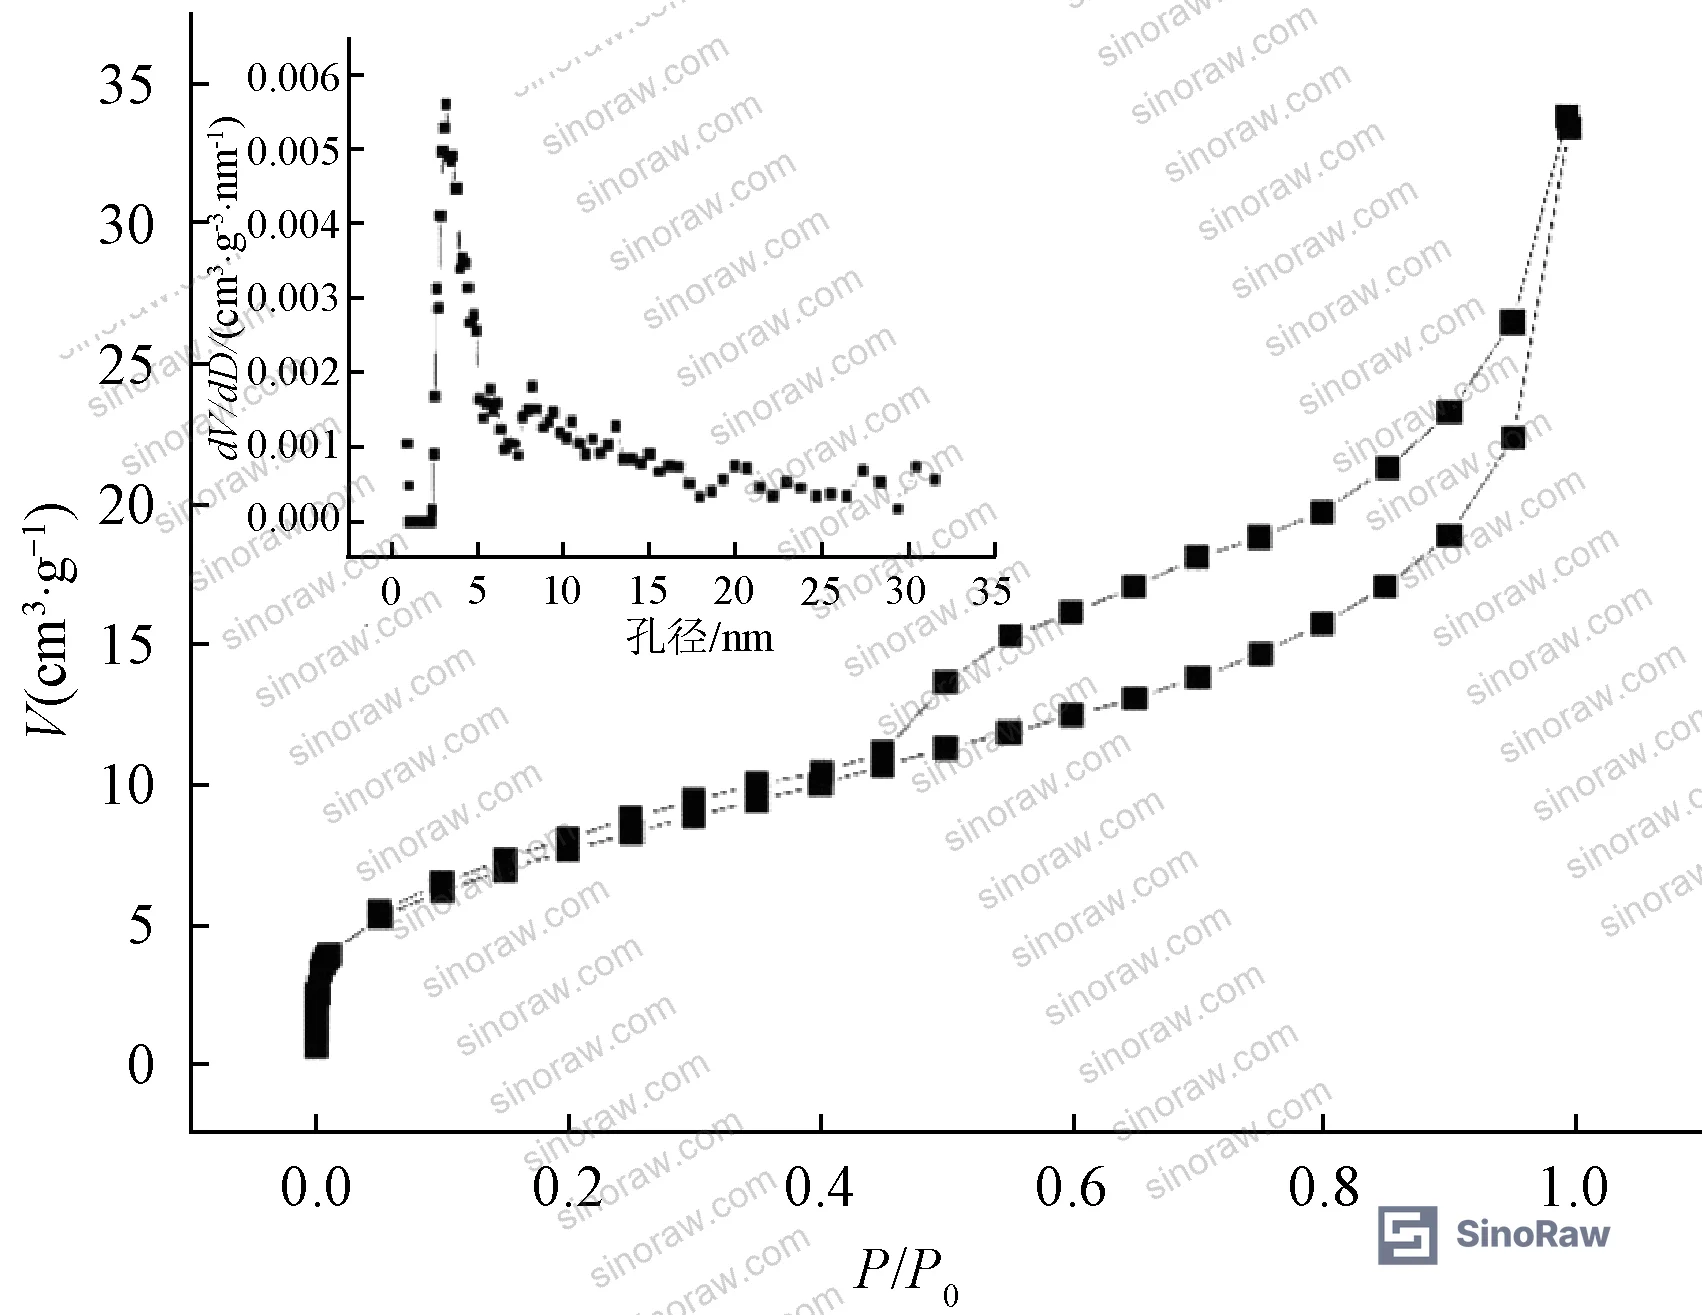
When the ratio is reversed to 2:1 (excess iron), performance drops to its worst point. Excess nZVI physically blocks the pore channels of the manganese sand substrate, reducing effective surface area and eliminating the active contact sites that drive adsorption. The BET surface area of the optimized 1:2 composite is 27.434 m²/g with a pore volume of 0.057 cm³/g and a mean pore diameter of 2.6 nm — confirming mesoporous character. Excess iron loading compresses those values.
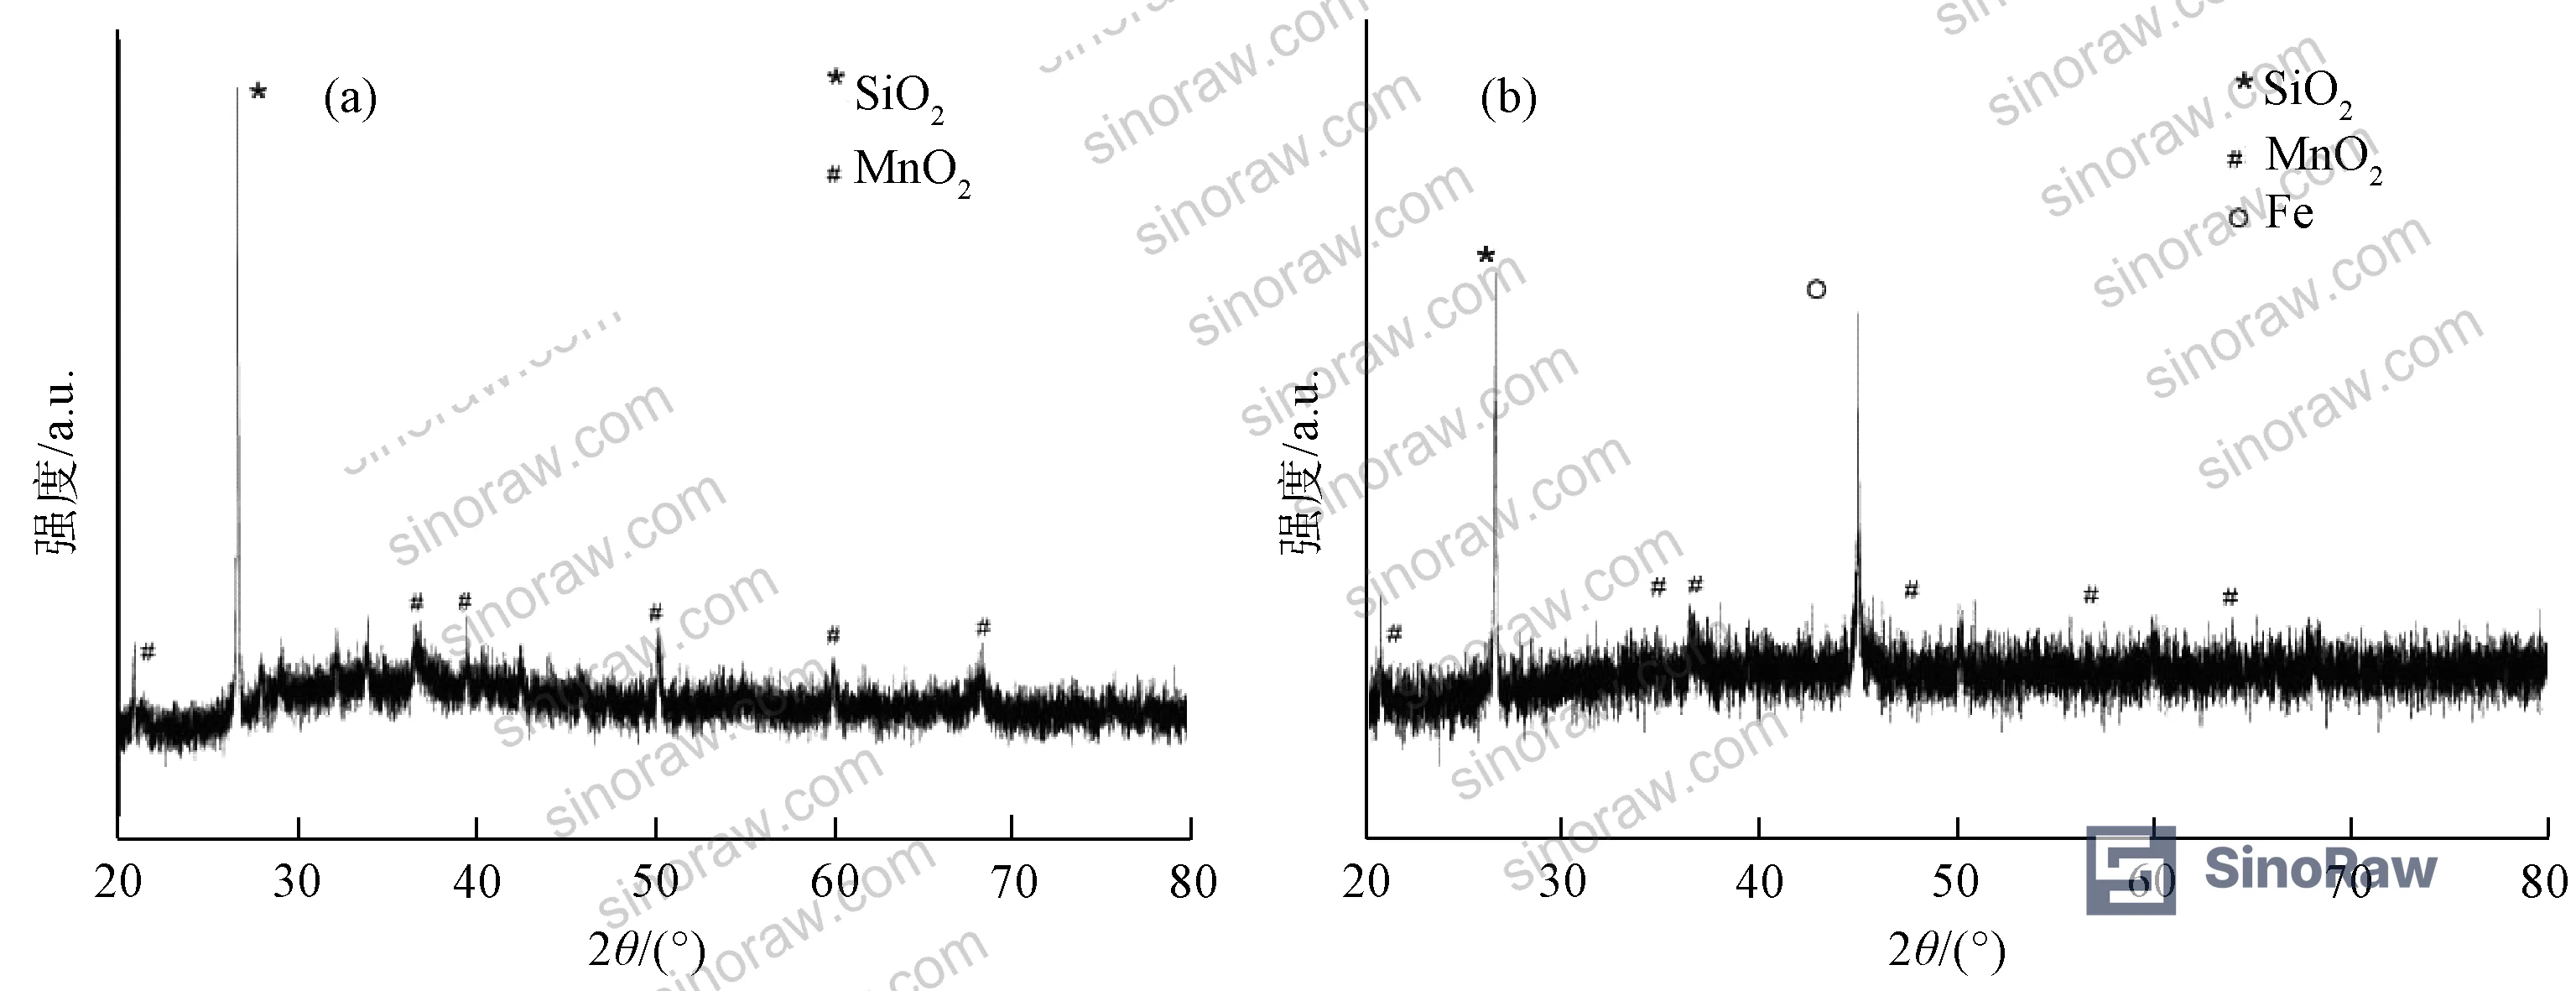
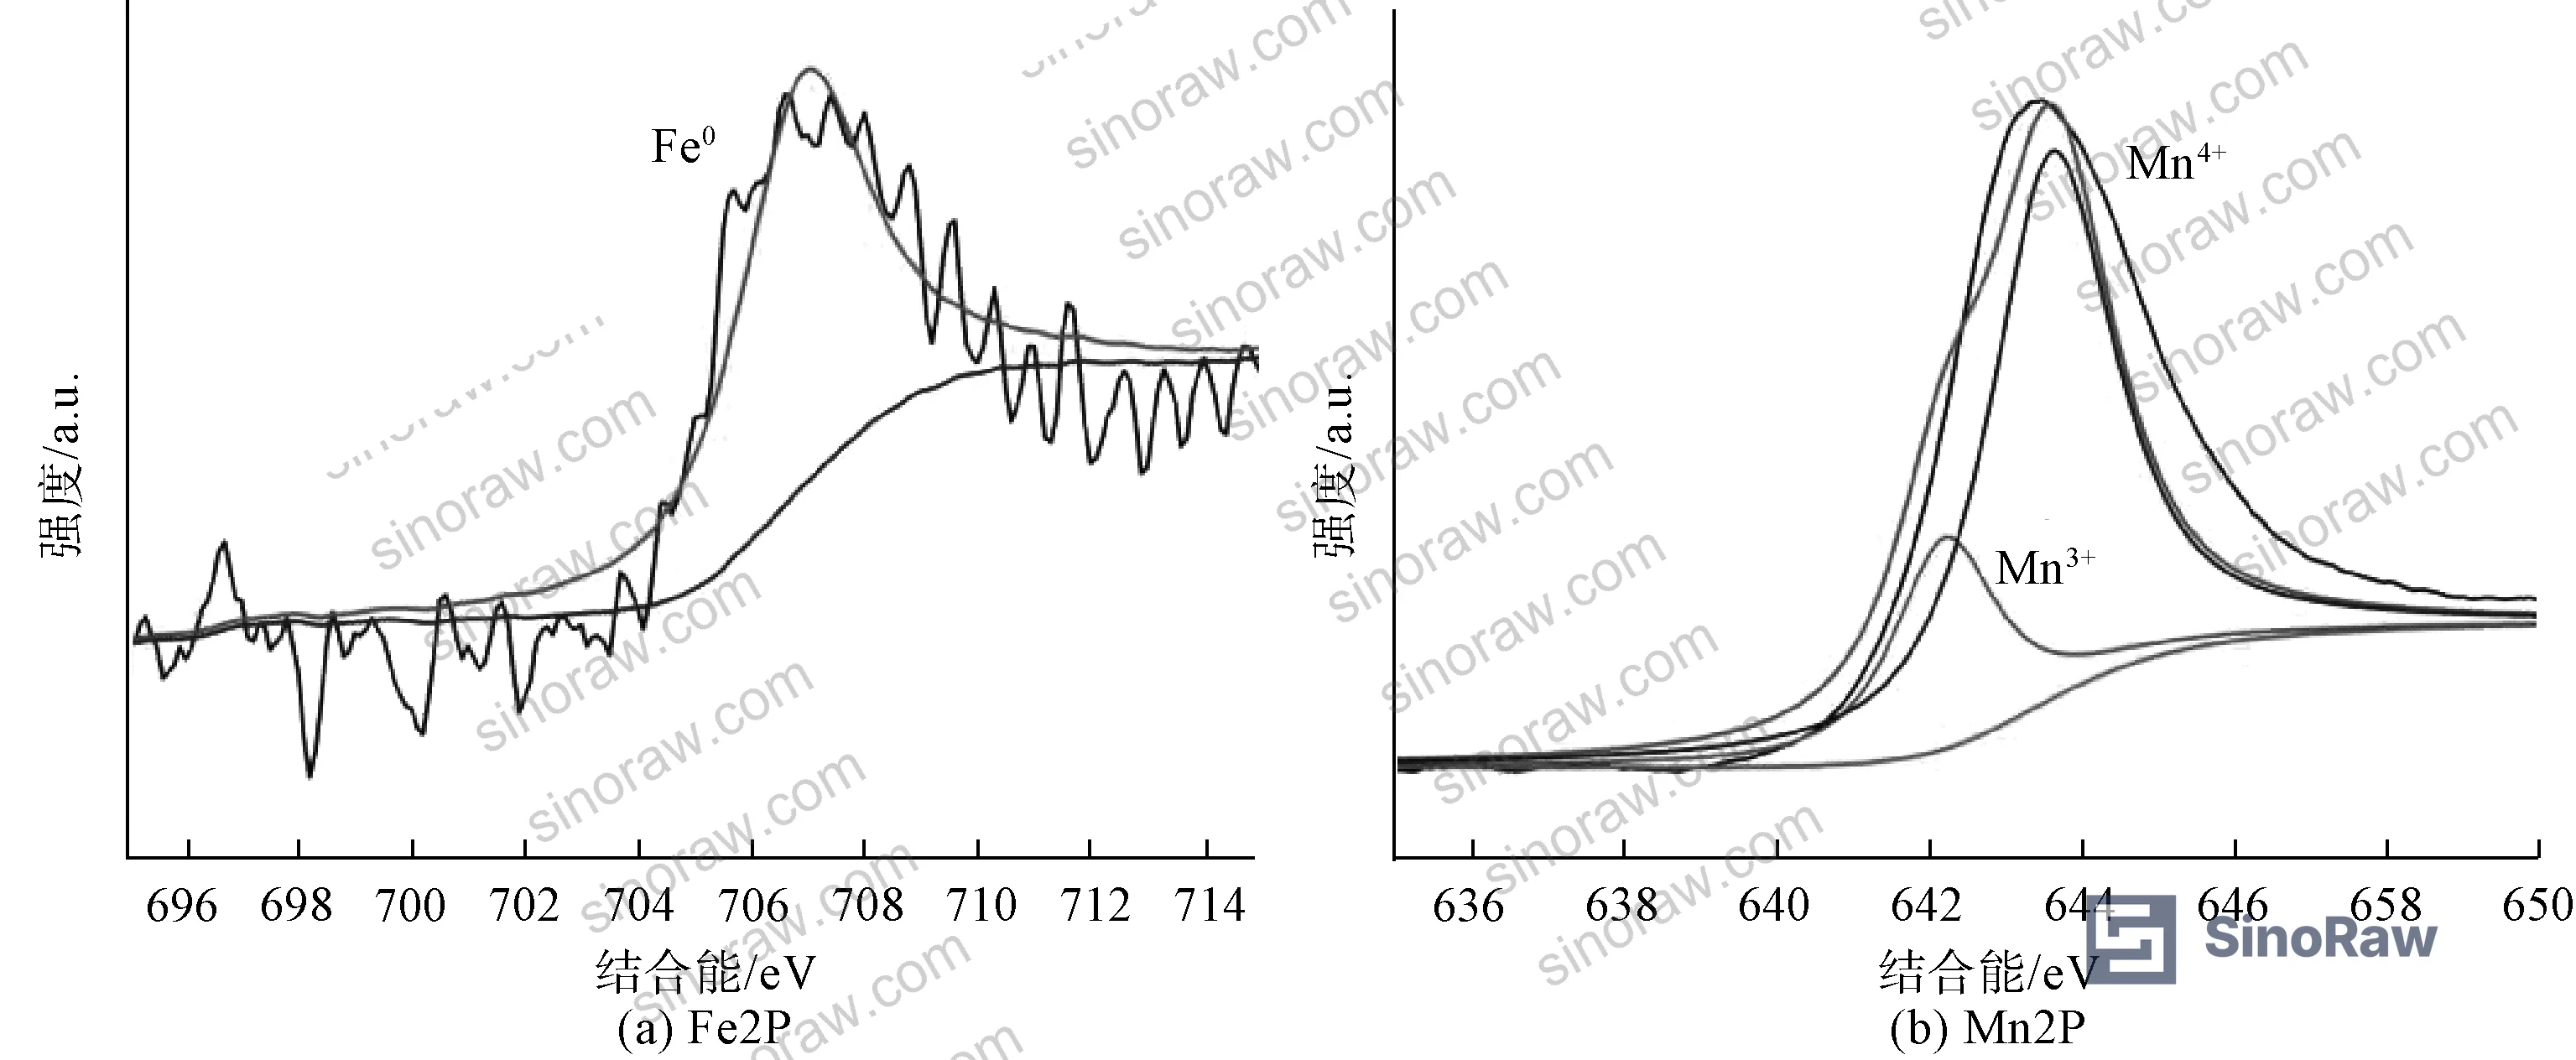
XRD analysis confirms the composite structure: the manganese sand substrate shows characteristic MnO₂ and SiO₂ peaks, while the loaded composite exhibits a sharp, high-intensity Fe⁰ peak at 2θ ≈ 45°, confirming successful nZVI synthesis and particle size control. XPS data shows the Fe2p spectrum with a characteristic Fe⁰ absorption peak at 706.9 eV — direct evidence that zero-valent iron was successfully incorporated rather than oxidized during synthesis.
One important side effect during preparation: when sodium borohydride (NaBH₄) is added in excess as the reducing agent, a portion of Mn⁴⁺ in the manganese sand is reduced to Mn³⁺. The Mn2p XPS spectrum shows characteristic peaks at 642.2 eV (Mn³⁺) and 644.4 eV (Mn⁴⁺), confirming this partial reduction. Most of the Mn⁴⁺ remains unreduced when NaBH₄ dosage is controlled correctly. Suppliers who cannot demonstrate precise reductant dosage control during synthesis are producing inconsistent material.
Comparison: Performance by Loading Configuration
| Configuration | nZVI:MnSand Ratio | Sb(V) Removal Efficiency | Key Limitation |
|---|---|---|---|
| nZVI only | 100% Fe, 0% MnSand | ~50% | Reduction only, insufficient adsorption sites |
| Natural MnSand only | 0% Fe, 100% MnSand | ~50% | Adsorption sites present but no Sb(V)→Sb(III) reduction |
| Composite (optimal) | 1:2 | >70% (pH 7.5 conditions) | Performance degrades at pH >5 and with PO₄³⁻ |
| Composite (excess Fe) | 2:1 | Worst performance | Fe blocks MnSand pore channels, reduces surface area |
Honestly, most buyers over-specify iron content when sourcing reactive filter media. They assume a higher active-component loading means better performance. The data here shows the opposite — the manganese sand substrate is doing the heavy lifting on adsorption, and the nZVI is a catalyst for valence reduction, not a bulk adsorbent. Get the ratio wrong and you’re paying more for worse results.
The ASTM D3985 Oxygen Gas Transmission Rate Through Plastic Film and Sheeting framework, while specific to barrier films, illustrates a broader principle relevant here: functional performance testing under real conditions (not just material specification sheets) is the only way to qualify composite materials. The same logic applies to composite filter media — demand test data, not just composition certificates.
pH Sensitivity, Dosage Effects, and Competitive Ion Interference #
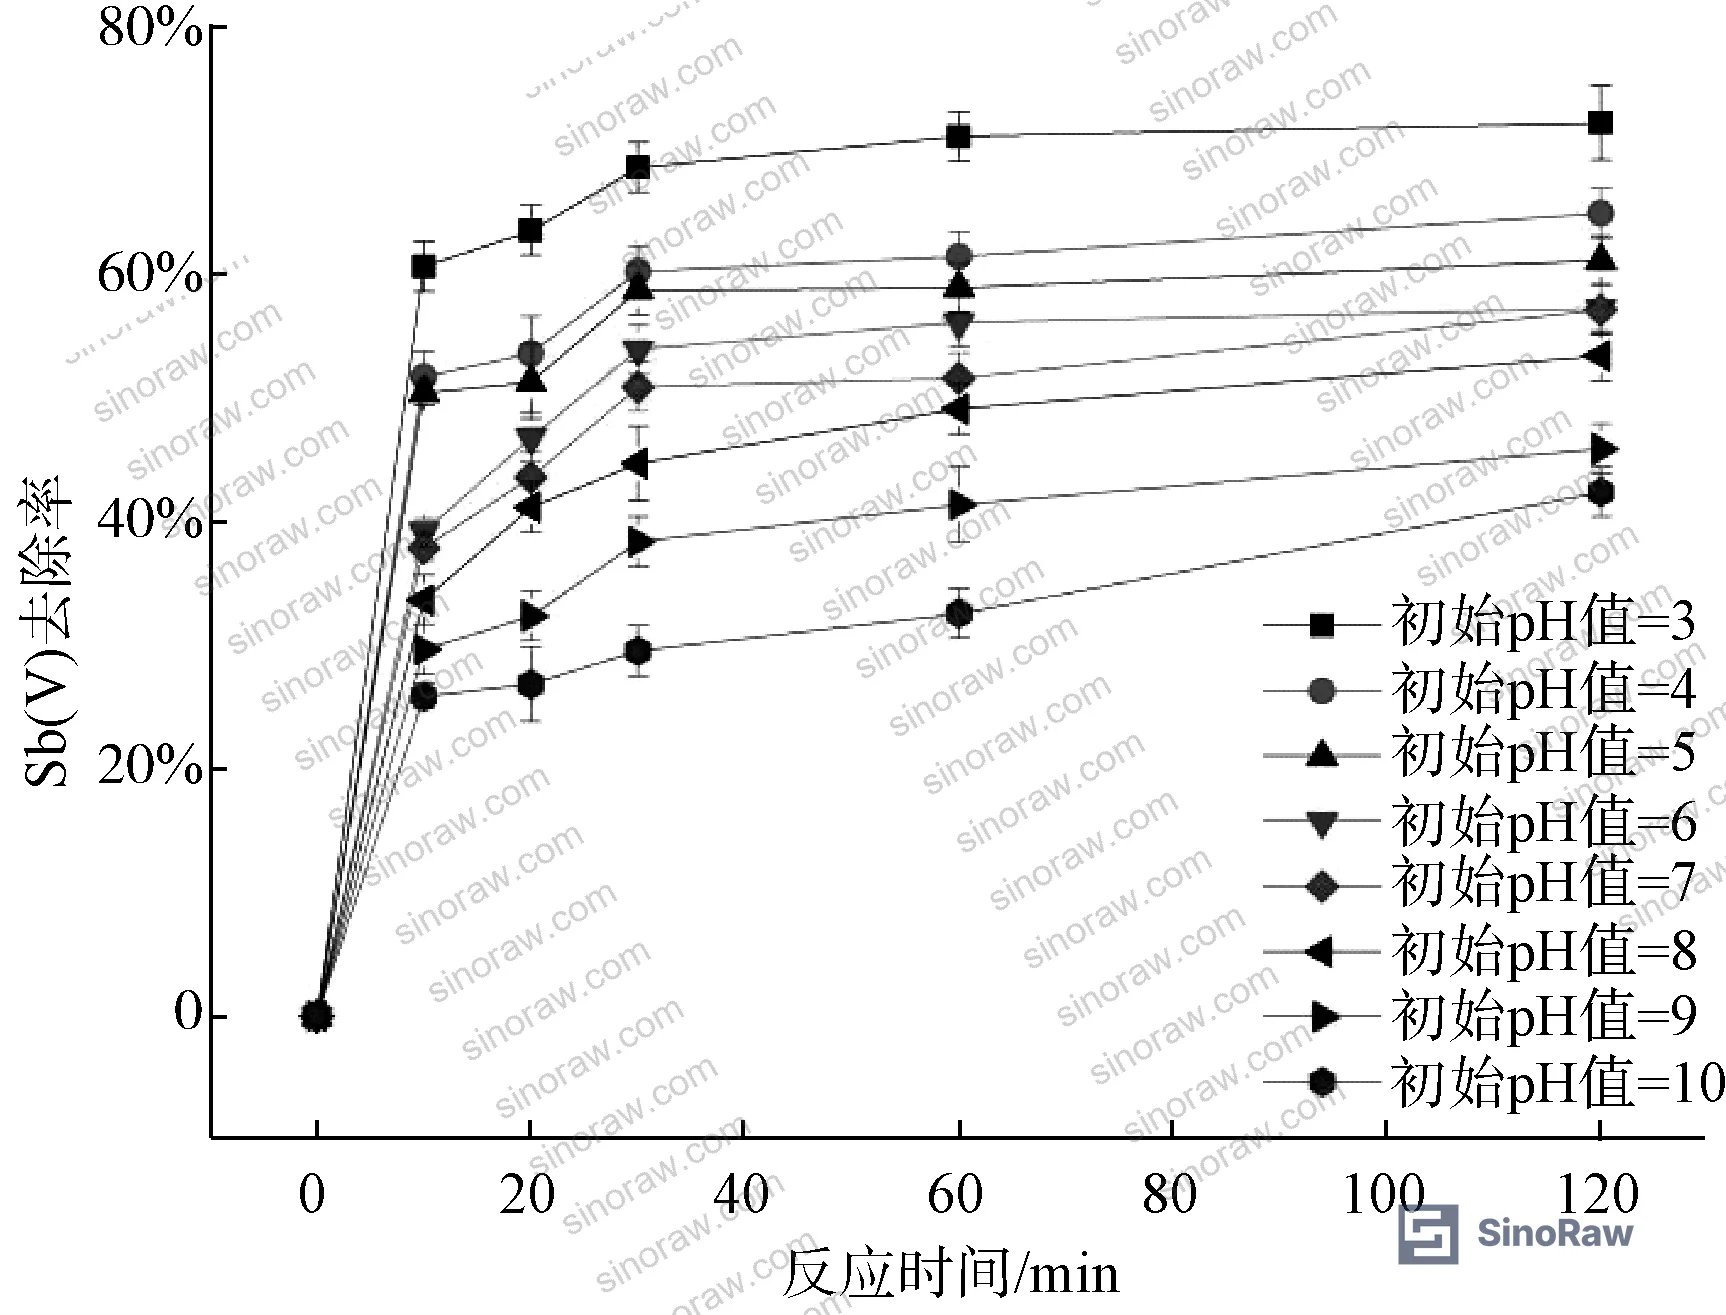
pH is the operational variable that collapses performance fastest. At pH 3 (optimal), Sb(V) removal is maximized through two reinforcing mechanisms: surface protonation of the adsorbent increases positive surface charge, enhancing electrostatic attraction to the anionic Sb(OH)₆⁻ species that dominates in solution; and the abundant H⁺ ions participate directly in the nZVI reduction reaction while also generating H₂ gas that maintains the anaerobic microenvironment, preventing iron surface passivation.
As pH rises, both mechanisms degrade. In alkaline conditions, Fe³⁺ generated during the reduction reaction converts to Fe(OH)₃ precipitate that coats the nZVI surface, creating an electron transfer barrier that blocks further Sb(V) reduction. At the near-neutral pH of 7.5 (typical for real wastewater influent), removal efficiency with a dosage of 1.0 g/L does not exceed 70%. That’s a meaningful constraint for anyone designing a treatment system.
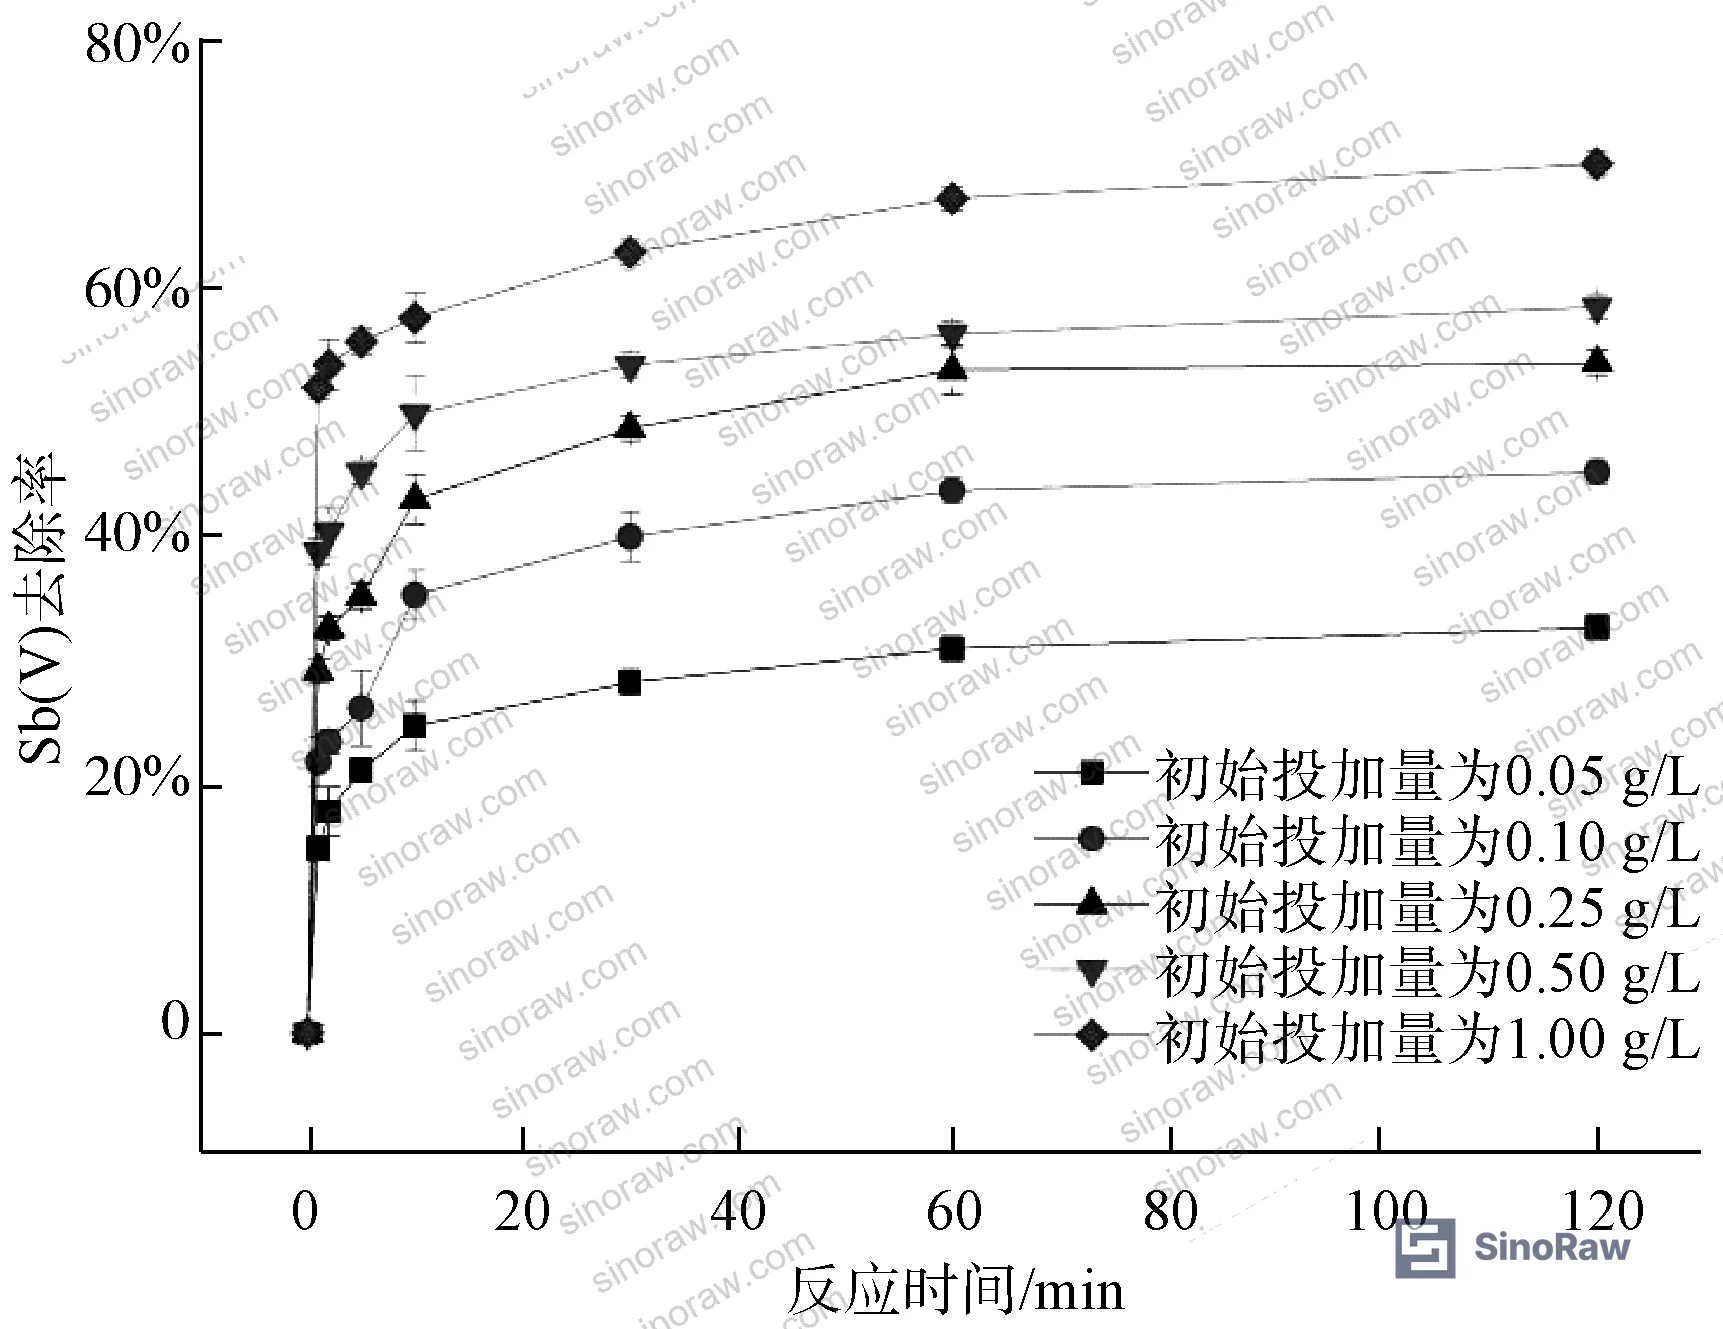
Dosage effects are predictable: increasing filter media concentration increases available adsorption sites and improves removal. However, there is no shortcut — if you cannot control influent pH, you must compensate with higher dosage, and that has direct cost implications.
The co-existing ion data is where this gets procurement-critical. Carbonate (CO₃²⁻) and sulfate (SO₄²⁻) ions at tested concentrations have minimal impact on removal efficiency — both are common wastewater constituents, so that’s reassuring. Phosphate (PO₄³⁻) is a different story entirely.
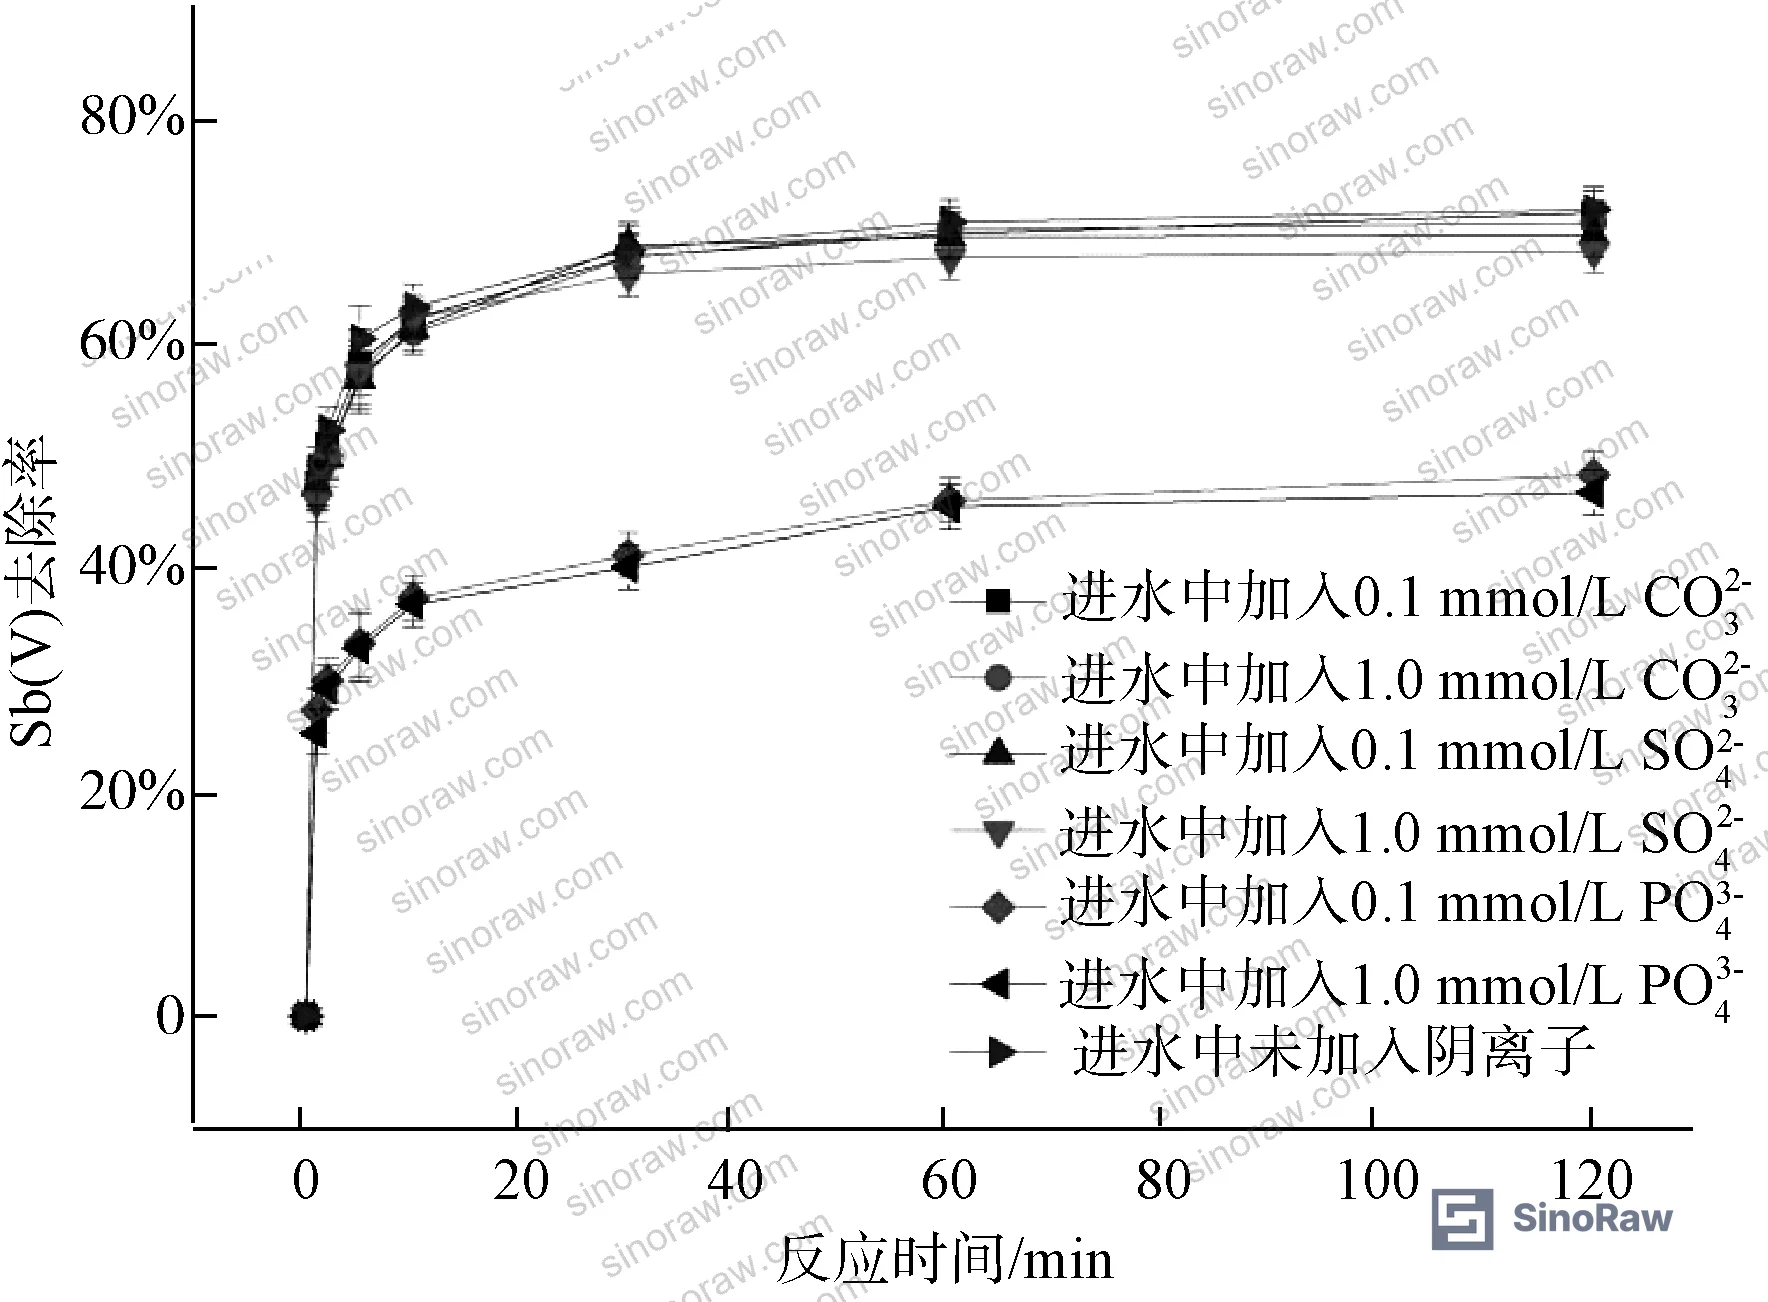
When phosphate is present, removal efficiency drops from 70% to approximately 40% — a 30 percentage point collapse. The mechanism is competitive adsorption: phosphorus and antimony belong to the same main group in the periodic table, sharing structural similarity in their oxy-anion forms. Phosphate and antimonate compete directly for the same adsorption sites on the manganese sand surface. Buyers sourcing this material for phosphate-containing wastewater streams need to either pre-treat for phosphate removal or factor in a substantially higher media dosage.
Most procurement teams don’t realize that antimony speciation — Sb(III) versus Sb(V) — matters enormously to material selection. The removal mechanism here is a two-stage process: nZVI reduces Sb(V) to Sb(III), and then MnO₂ in the manganese sand adsorbs the Sb(III). Suppliers offering “general antimony removal” media without specifying which oxidation state their product is optimized for are either unaware of this distinction or selling undifferentiated commodity material. Ask the question directly.
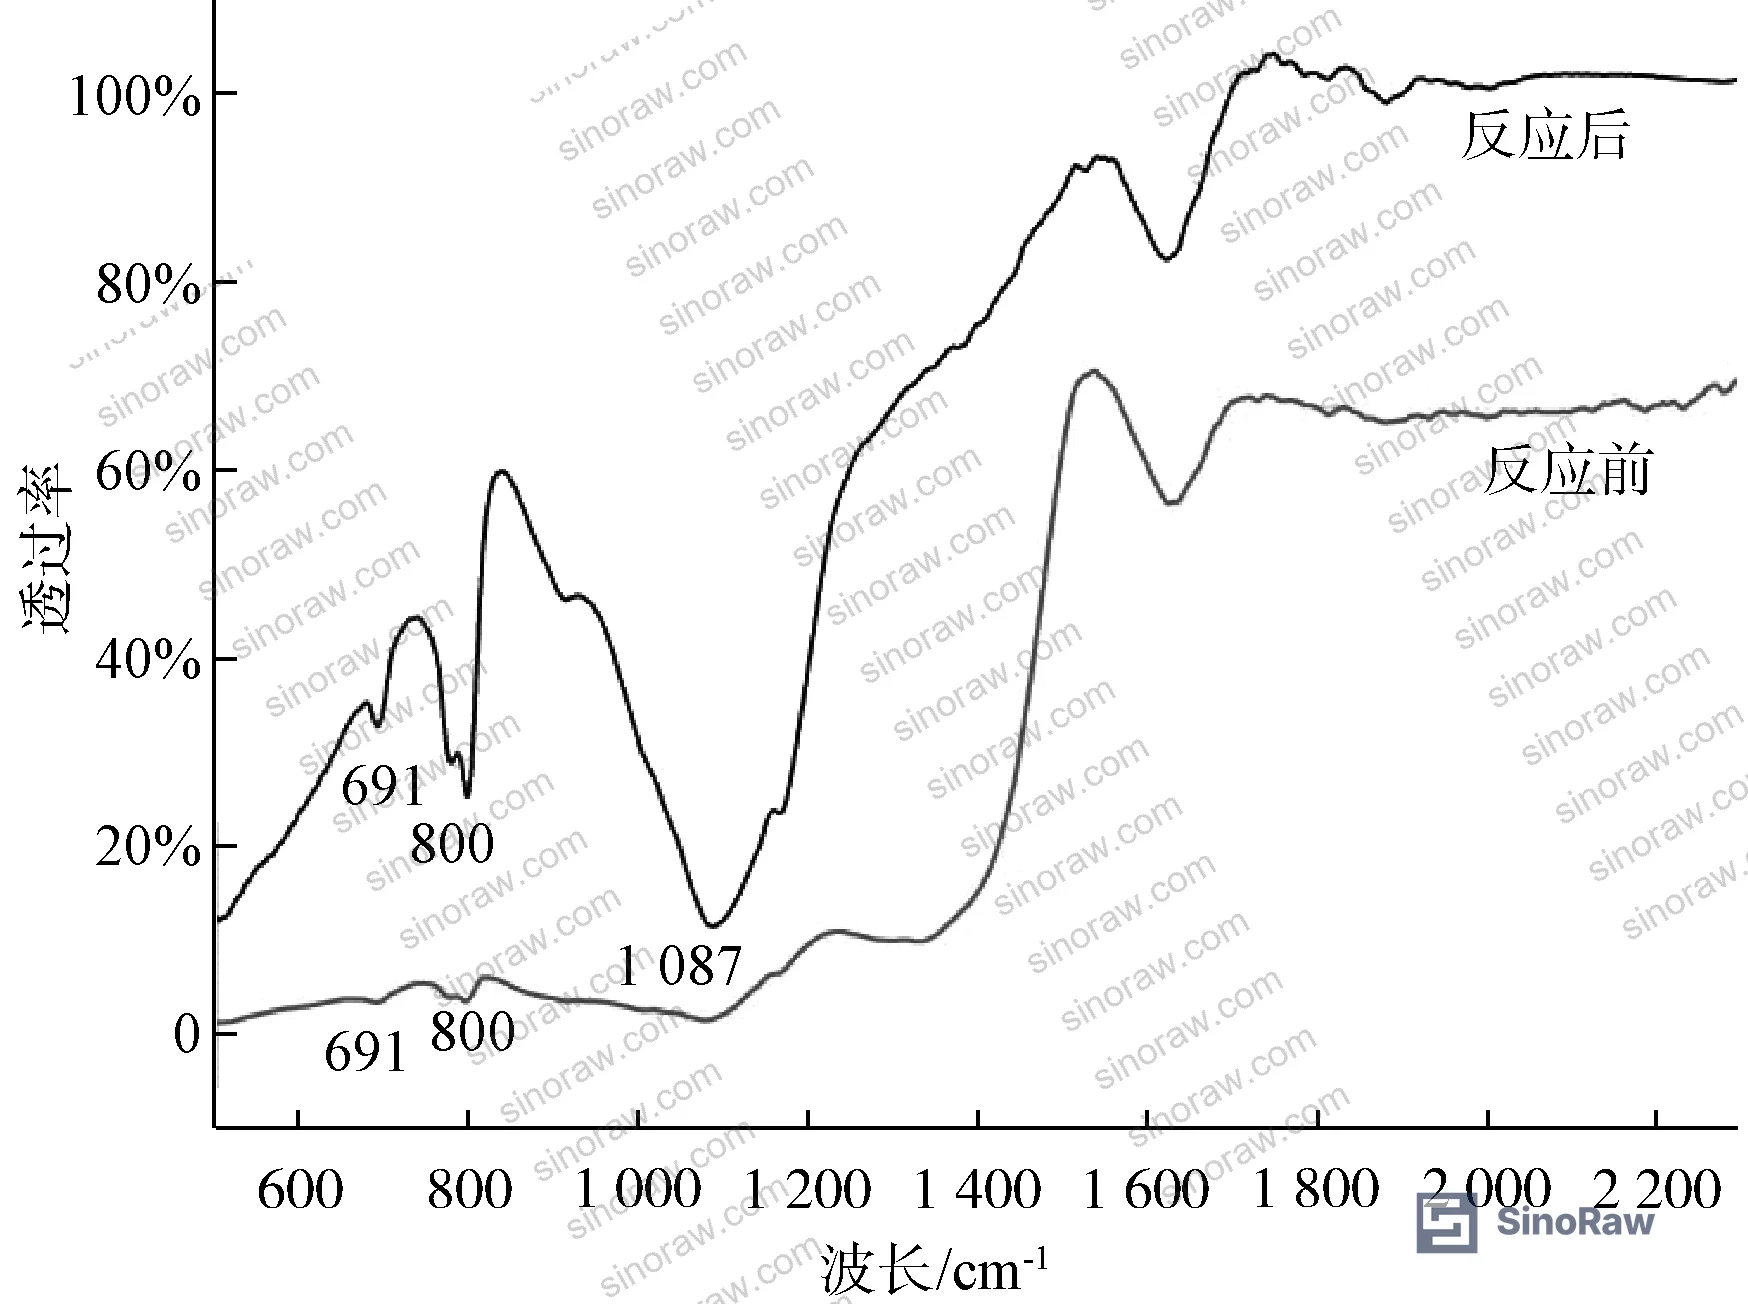
FTIR analysis of the composite material before and after Sb(V) adsorption confirms the reaction mechanism: characteristic peaks at 691 cm⁻¹ (Fe-O bending vibration), 800 cm⁻¹ (Mn-O lattice vibration), and a new absorption peak at 1087 cm⁻¹ post-reaction attributed to Sb-O bonds — direct spectroscopic evidence that Sb(V) was adsorbed onto the material surface through chemical interaction, not merely physical entrapment.
Adsorption Kinetics: What Second-Order Fit Tells You About the Reaction Mechanism #
Kinetic modelling using pseudo-first-order and pseudo-second-order models provides a direct window into whether an adsorption process is primarily physical or chemical — and whether a supplier’s material will perform consistently in continuous-flow applications rather than just batch tests.
For nZVI-loaded manganese sand, the pseudo-second-order kinetic model fits with R² = 0.999, while the pseudo-first-order model fits poorly at R² = 0.876. The equilibrium adsorption capacity (qe) from the second-order fit is 2.557 mg/g, with a rate constant K₁ of 0.015 min⁻¹.
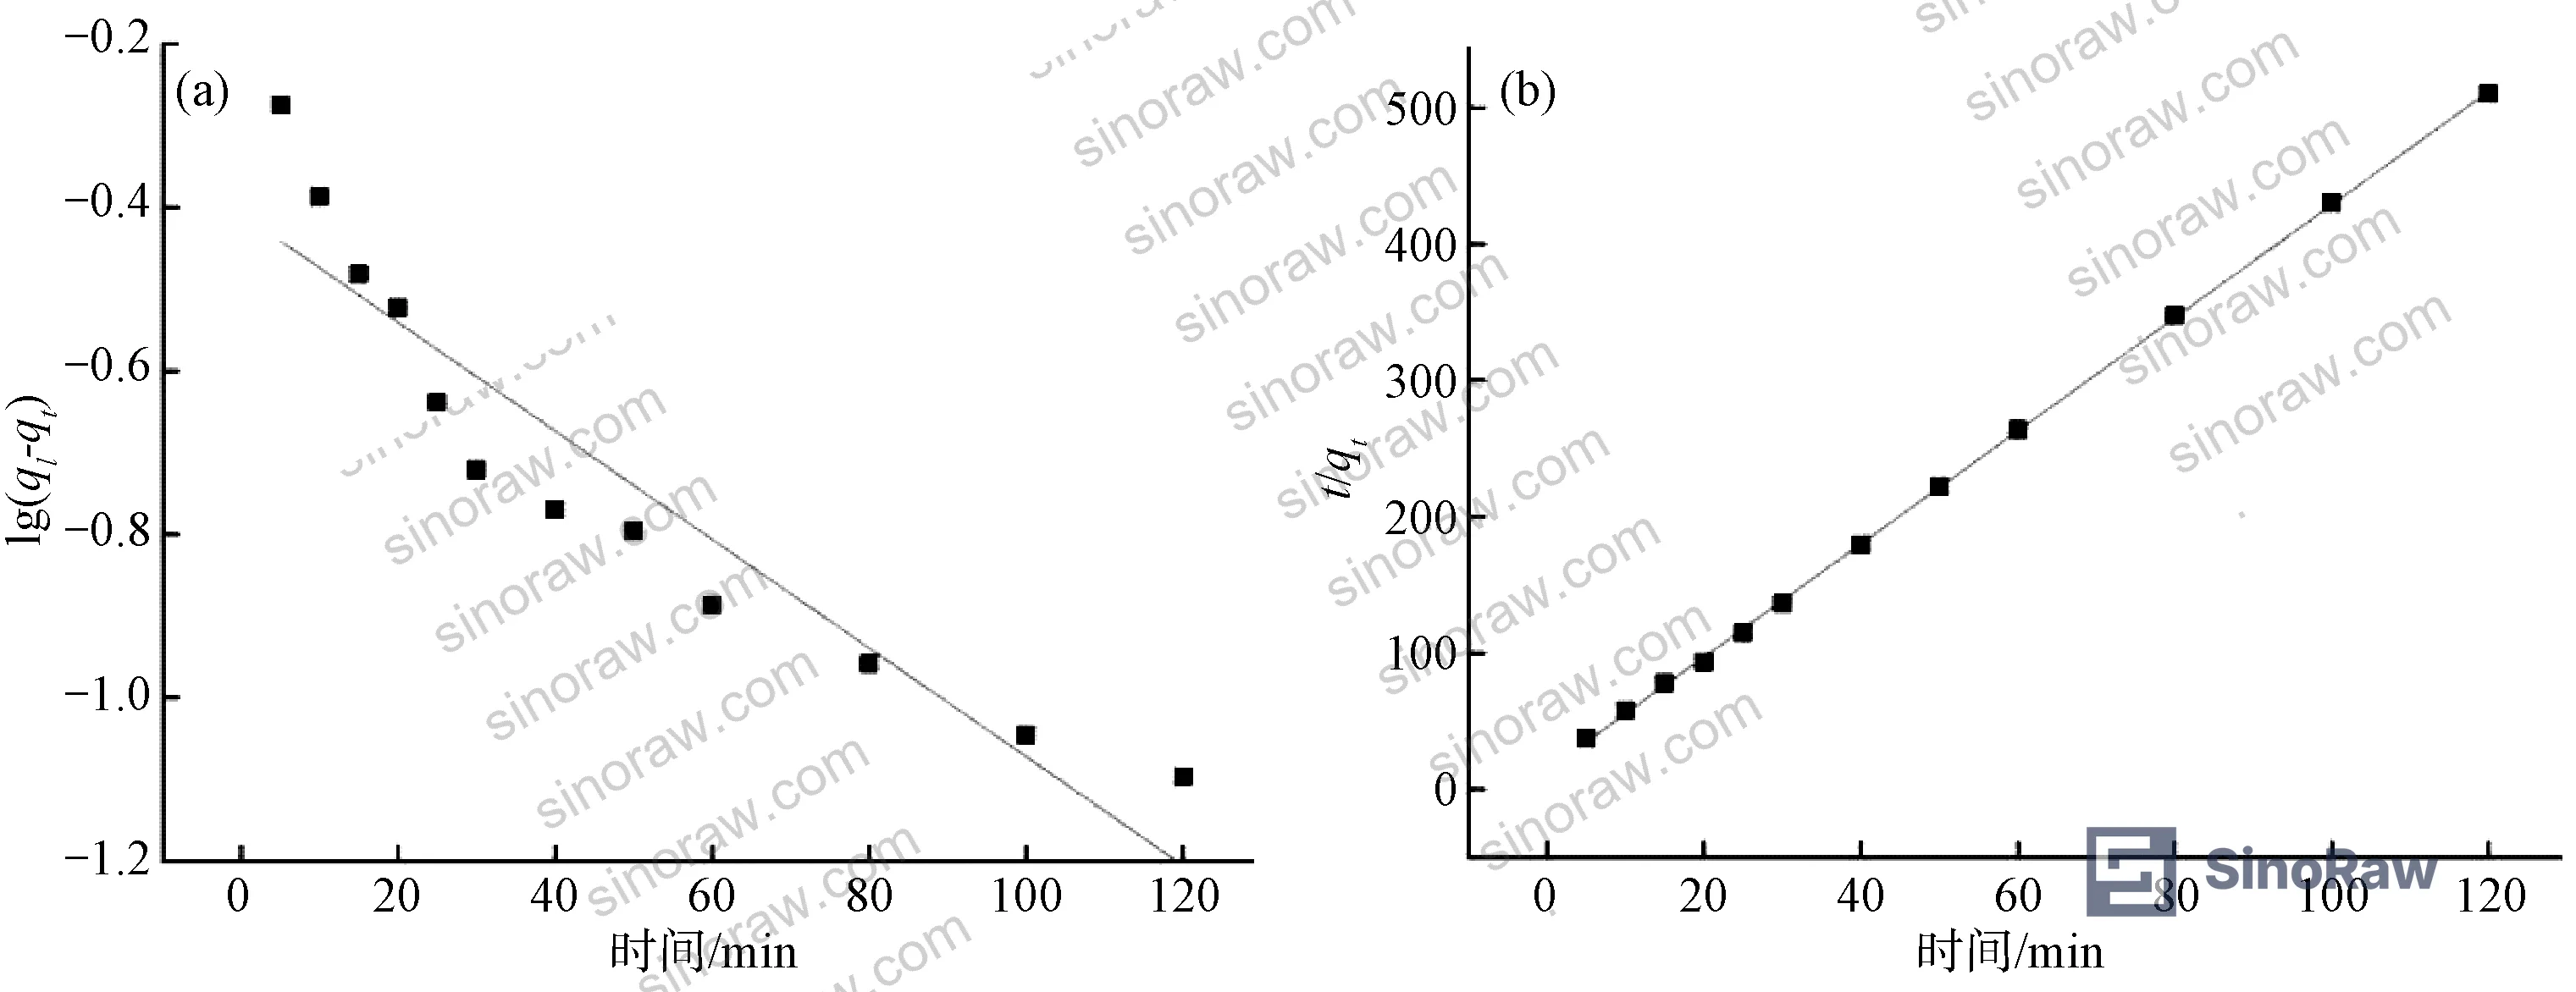
The strong pseudo-second-order fit indicates the process involves both physical adsorption and chemical adsorption simultaneously — a composite adsorption mechanism. This is consistent with the two-stage removal pathway: chemical reduction of Sb(V) to Sb(III) by nZVI, followed by surface adsorption of Sb(III) by MnO₂. The high R² value also suggests the process proceeds readily under the tested conditions, which is a positive signal for operational stability.
In supplier qualification work evaluating multiple batches of similar composite media, we’ve seen kinetics data used as a differentiator that quickly separates credible manufacturers from those pasting in copied spec sheets. Three of six samples from unqualified suppliers in one evaluation round showed R² values below 0.92 for second-order fit — indicating inconsistent material synthesis and unpredictable field performance. Request the raw kinetics data, not just the summary table.
Compliance with ISO 9001:2015 Quality management systems is a baseline expectation for any supplier of engineered composite filter media, but it tells you nothing about material-specific performance consistency. Kinetic fit data does.
Practical Guidance for Buyers #
If your application involves treating antimony-contaminated water or industrial wastewater to meet sub-5 μg/L discharge limits, nZVI-loaded manganese sand composite media is a technically viable and cost-accessible option — but only when sourced from suppliers who understand the synthesis variables that determine performance.
The top three disqualifiers from suppliers in this category: wrong nZVI:MnSand ratio (anything other than 1:2 by mass unless they can demonstrate equivalent BET surface area), inability to provide pH sensitivity data across the pH 3–9 range, and no documentation of phosphate interference testing. Any supplier who cannot answer questions about competitive adsorption with phosphate ions almost certainly hasn’t characterized their product properly.
At sinoraw.com, our role is to help overseas procurement engineers and technical buyers identify and pre-screen Chinese manufacturers of industrial materials like composite filter media before you commit to an RFQ — so you’re evaluating qualified suppliers, not running your own discovery process. The REACH Regulation (EC) No 1907/2006 compliance status of the constituent materials (iron, manganese compounds) should also be confirmed for export applications into EU markets.
Verify that your supplier’s batch release specification includes BET surface area confirmation (≥27 m²/g), XPS confirmation of Fe⁰ peak at 706.9 eV, and second-order kinetics R² ≥ 0.999. If they can’t provide those three data points, treat it as a disqualification signal. Also confirm that ISO 14001:2015 Environmental management systems certification is in place — NaBH₄ reduction synthesis generates hydrogen gas and borate waste streams that require proper environmental controls.
Need help identifying qualified suppliers for nZVI-loaded manganese sand filter media? Talk to our sourcing team →
Supplier Qualification Questions #
- What is the BET specific surface area of your nZVI-loaded manganese sand filter media, and can you provide the adsorption-desorption isotherm data confirming mesoporous type IV isotherm with H3 hysteresis loop?
- What is the Fe⁰ binding energy peak position in your XPS Fe2p spectrum, and can you confirm the characteristic absorption at 706.9 eV to verify successful zero-valent iron synthesis rather than oxidized iron species?
- At what nZVI:manganese sand mass loading ratio do you manufacture your composite, and what Sb(V) removal efficiency have you measured at pH 7.5 with a dosage of 1.0 g/L — can you provide the removal rate versus loading ratio curve?
- What is the pseudo-second-order kinetic fit R² value for your material’s Sb(V) adsorption, and what equilibrium adsorption capacity (qe) does your batch release specification require — is the threshold set at ≥2.557 mg/g or higher?
- How does the presence of phosphate (PO₄³⁻) affect your material’s Sb(V) removal efficiency, and at what phosphate concentration does removal drop below 50% — can you provide the co-existing anion interference data for CO₃²⁻, SO₄²⁻, and PO₄³⁻?
Sourcing Checklist #
- ☐ BET specific surface area confirmed ≥27.434 m²/g via nitrogen adsorption-desorption isotherm analysis on production batch samples
- ☐ XPS spectrum confirms Fe⁰ characteristic peak at 706.9 eV binding energy, verifying zero-valent iron content rather than oxidized iron phases
- ☐ nZVI:MnSand mass loading ratio documented as 1:2 in manufacturing specification, with deviation tolerance stated
- ☐ Pseudo-second-order kinetic fit R² ≥ 0.999 confirmed on batch qualification data, with raw kinetics data available for review
- ☐ Sb(V) removal efficiency ≥70% demonstrated at 1.0 g/L dosage and pH ≤7.5 in test report from independent or in-house laboratory
- ☐ Phosphate interference data available showing removal efficiency vs. PO₄³⁻ concentration, with testing confirming the competitive adsorption threshold
- ☐ NaBH₄ reductant dosage controlled to prevent excess Mn⁴⁺ reduction, with XPS Mn2p data confirming Mn³⁺ peak at 642.2 eV remains minor relative to Mn⁴⁺ peak at 644.4 eV
- ☐ Supplier holds ISO 9001:2015 certification with scope covering composite adsorbent media manufacturing
Key Specifications Table #
| Parameter | Recommended Value | Verification Method |
|---|---|---|
| BET specific surface area | ≥27.434 m²/g | N₂ adsorption-desorption BET analysis (ChemBET TPR/TPD or equivalent) |
| Mean pore diameter | ~2.6 nm (mesoporous range) | BJH pore size distribution from BET isotherm |
| Pore volume | ≥0.057 cm³/g | BET adsorption-desorption analysis |
| Fe⁰ XPS binding energy peak | 706.9 eV (Fe2p spectrum) | X-ray photoelectron spectroscopy (XPS) |
| nZVI:MnSand loading ratio | 1:2 by mass (optimal) | Manufacturing batch record + BET surface area confirmation |
| Pseudo-second-order kinetics R² | ≥0.999 | Batch adsorption kinetics experiment, t/qt vs. t curve fit |
| Equilibrium adsorption capacity (qe) | ≥2.557 mg/g | Pseudo-second-order kinetic model fit from batch test |
| Sb(V) removal efficiency | ≥70% at dosage 1.0 g/L, pH ≤7.5 | ICP-OES measurement (PE/Optima 8000 or equivalent), 0.45 μm filtration |
Can’t find a supplier meeting these specs? Submit your requirements and we’ll match you within 48 hours.
References #
Data source: Synergistic Removal of Antimony(V) from Aqueous Solution Using Nano Zero-Valent Iron Loaded Manganese Sand Filter Media: Preparation, Characterization, and Adsorption Mechanism, Y.-B. Jiang et al., Journal of Hazardous Materials, 2023
Frequently Asked Questions #
Why does excess zero-valent iron loading reduce Sb(V) removal performance?
When the nZVI:manganese sand ratio exceeds 1:1 by mass (e.g., 2:1), excess iron particles physically occupy the pore channels of the manganese sand substrate, reducing BET surface area and blocking the active adsorption sites on MnO₂ surfaces. The result is that both reduction capacity and adsorption capacity are compromised simultaneously — you get neither the reduction benefit of iron nor the adsorption benefit of manganese sand.
What makes phosphate a more serious interferent than sulfate or carbonate?
Phosphate (PO₄³⁻) and antimonate (SbO₄³⁻/Sb(OH)₆⁻) are structural analogs — phosphorus and antimony occupy the same main group in the periodic table, producing oxy-anion species with nearly identical geometry and charge distribution. They compete directly for the same surface binding sites on MnO₂. Sulfate and carbonate lack this structural mimicry and have minimal impact on removal efficiency at typical wastewater concentrations.
Can this material be used without pH adjustment in real wastewater treatment?
Yes, but at a performance penalty. At the typical near-neutral pH of real wastewater influent (~7.5), removal efficiency with a 1.0 g/L dosage tops out below 70%. If pH adjustment to the optimal range (pH 3) is operationally impractical, the dosage must be increased substantially to compensate. Buyers should request supplier guidance on the dosage-pH trade-off curve before committing to a system design specification.
How do you confirm that zero-valent iron was successfully synthesized rather than oxidized iron?
XPS analysis is the definitive test. A characteristic Fe⁰ absorption peak at 706.9 eV in the Fe2p XPS spectrum confirms zero-valent iron. If the spectrum shows only Fe²⁺ or Fe³⁺ peaks without the 706.9 eV signal, the synthesis failed — either through oxidation during preparation or improper NaBH₄ reduction. Any supplier of nZVI-loaded media should be able to provide this data on request.
What does the pseudo-second-order kinetic fit tell me about long-term operational stability?
The strong pseudo-second-order fit (R² = 0.999) indicates the adsorption process involves chemical bonding at active surface sites, not just physical surface accumulation. This means the material’s removal mechanism is well-defined and reproducible. It also suggests the process involves both physical and chemical adsorption in combination — which generally correlates with more stable performance across variable operating conditions compared to purely physisorptive media.
Published by sinoraw.com Technical Team | Request a sourcing quote


