

TL;DR #
A Bayesian-optimized convolutional neural network trained on acoustic emission signals achieved 99.7023% average classification accuracy across seven distinct non-contact rotary seal fault conditions — including dry friction, spring failure, end-face pitting, and surface scratching. For procurement engineers specifying condition monitoring systems for mechanical seal applications, this establishes a concrete accuracy benchmark that separates credible AI-based diagnostic platforms from marketing claims. When evaluating seal monitoring suppliers, demand confusion matrix data and per-class recall rates, not just headline accuracy figures.
Overview #
Non-contact rotary seals are one of those components that procurement teams routinely underspecify on the monitoring side. The seal itself gets detailed attention — face materials, gas film thickness, spring load distribution — but the condition monitoring strategy is often an afterthought, typically limited to leakage rate checks or periodic manual inspection. That gap is where failures become expensive surprises.
Research conducted at a specialist sealing technology laboratory with direct access to a purpose-built test rig — running seven distinct operational conditions and collecting 14,000 validated acoustic emission (AE) feature samples — provides the most granular public dataset we’ve seen for non-contact rotary seal diagnostics. The experimental setup operated at 0.1 MPa pressure with motor speeds ranging from 50 r/min to 1,000 r/min depending on fault condition, using dual-channel AE sensors mounted at 45° on the seal gland radial plane at a sampling rate of 1.25 MHz across a frequency bandwidth of 13–1,035 kHz.
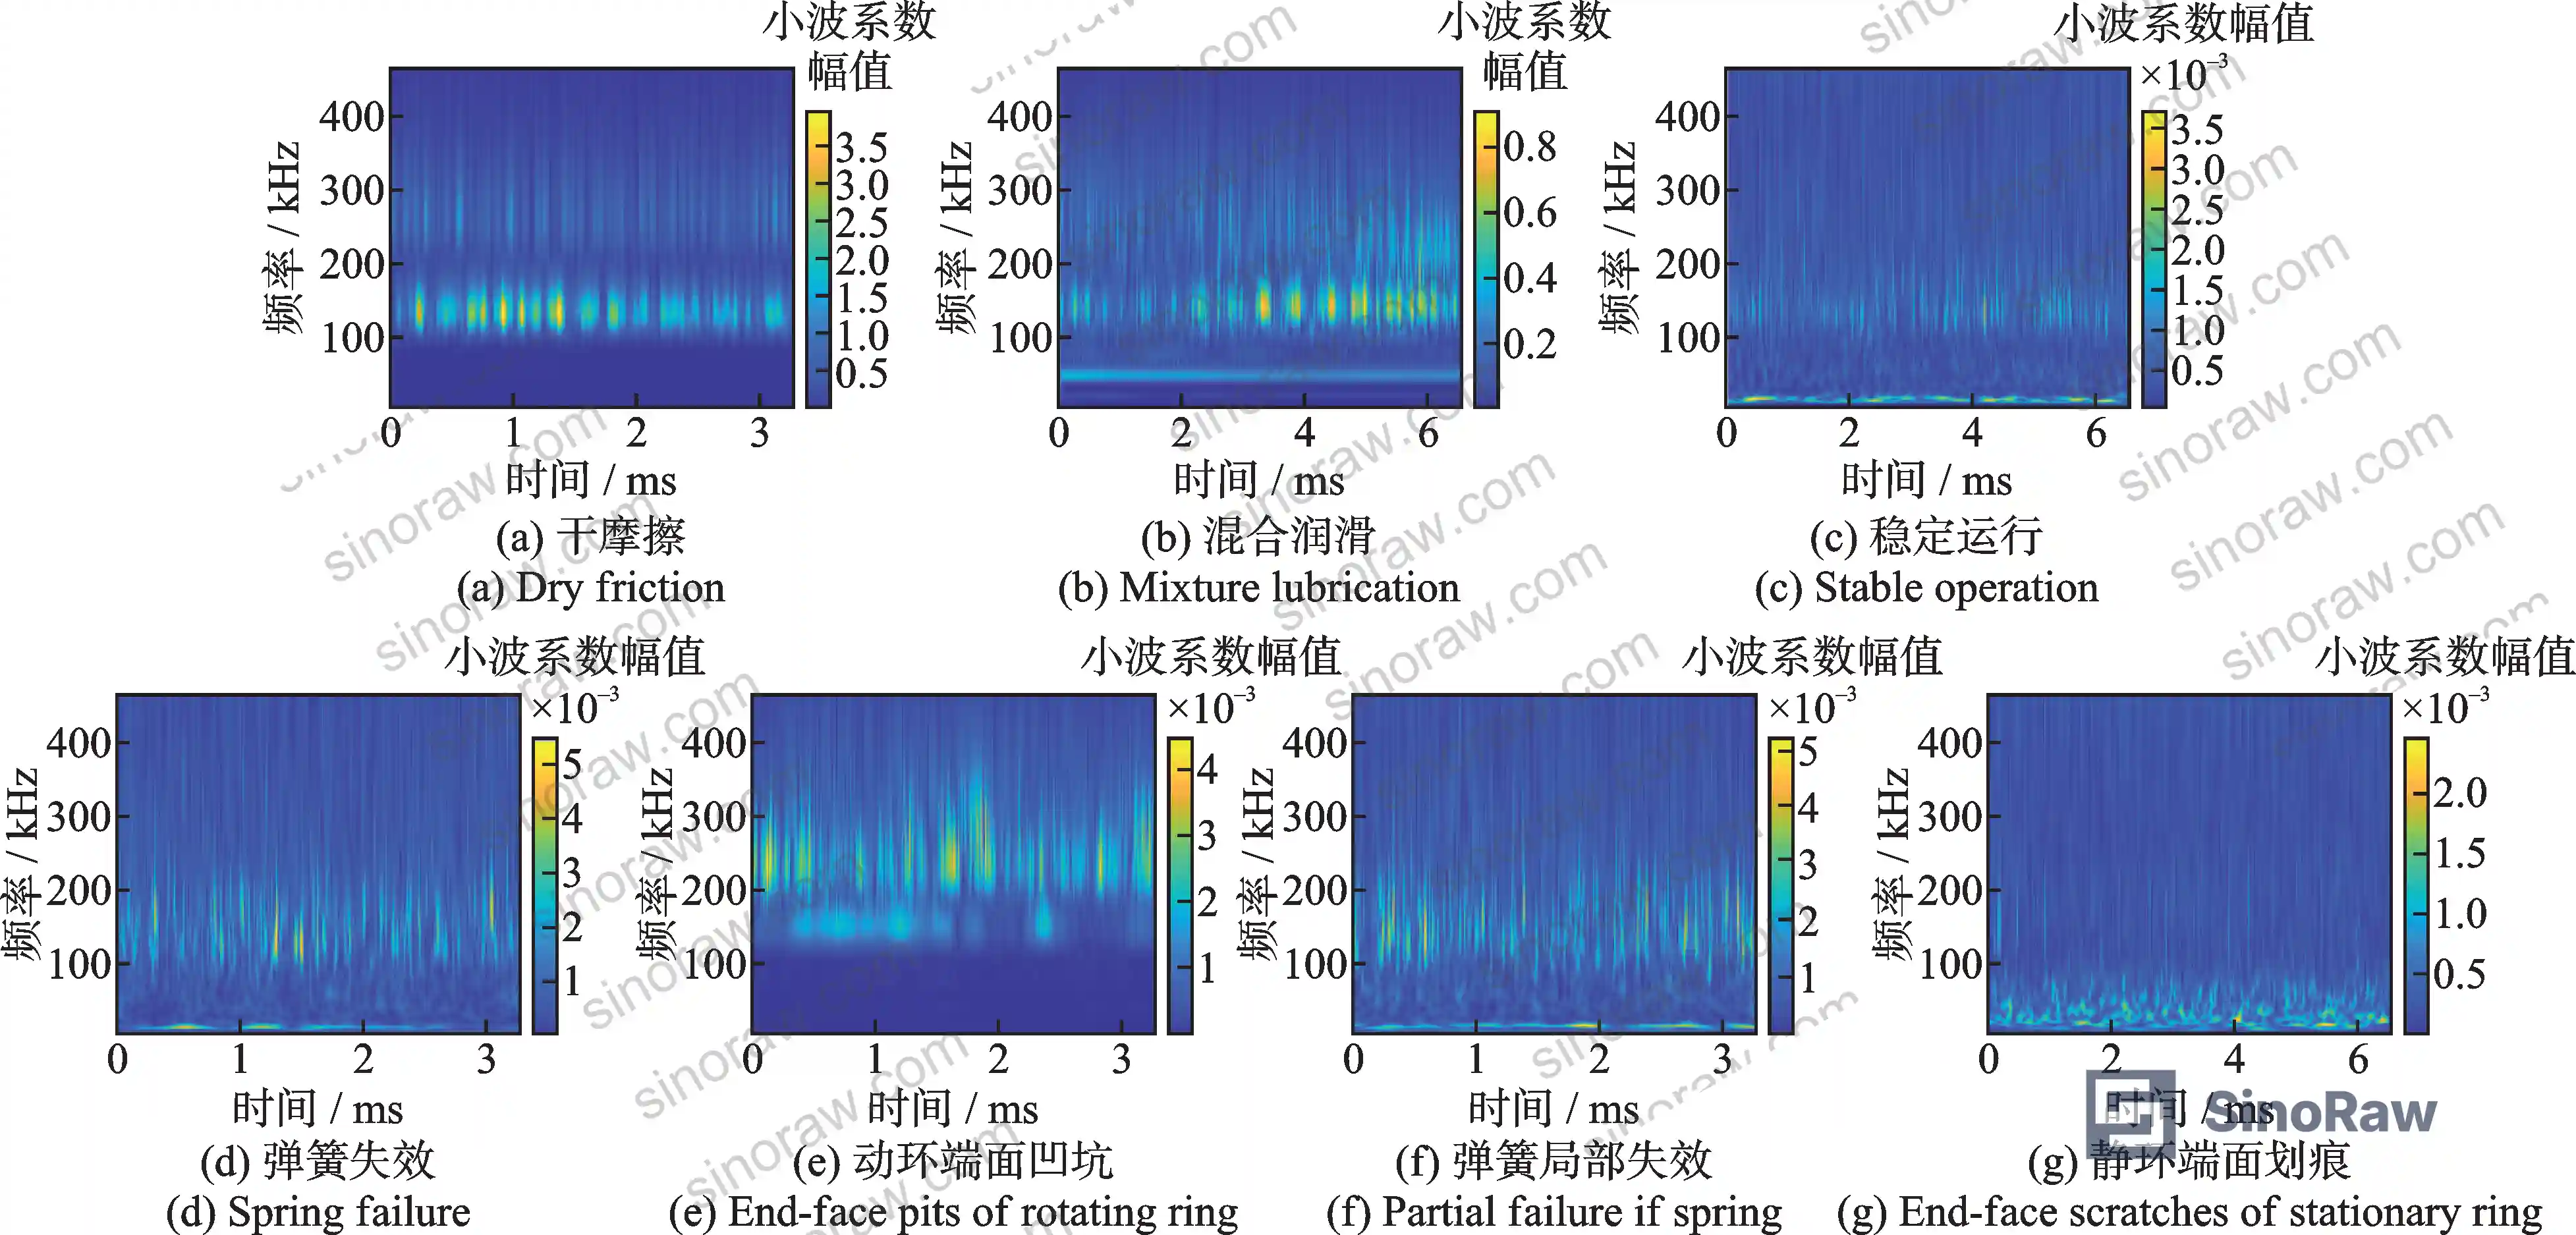
The seven conditions covered were: normal stable operation, dry friction (startup/shutdown transient), mixed lubrication, uniform spring failure, end-face pitting, local spring failure, and end-face scratching. This matters because most field monitoring setups treat “seal fault” as a binary condition. The ability to distinguish, say, local spring failure (PF) from uniform spring failure (SF) changes your maintenance response entirely — one requires targeted spring replacement; the other may indicate systematic assembly error or contamination.
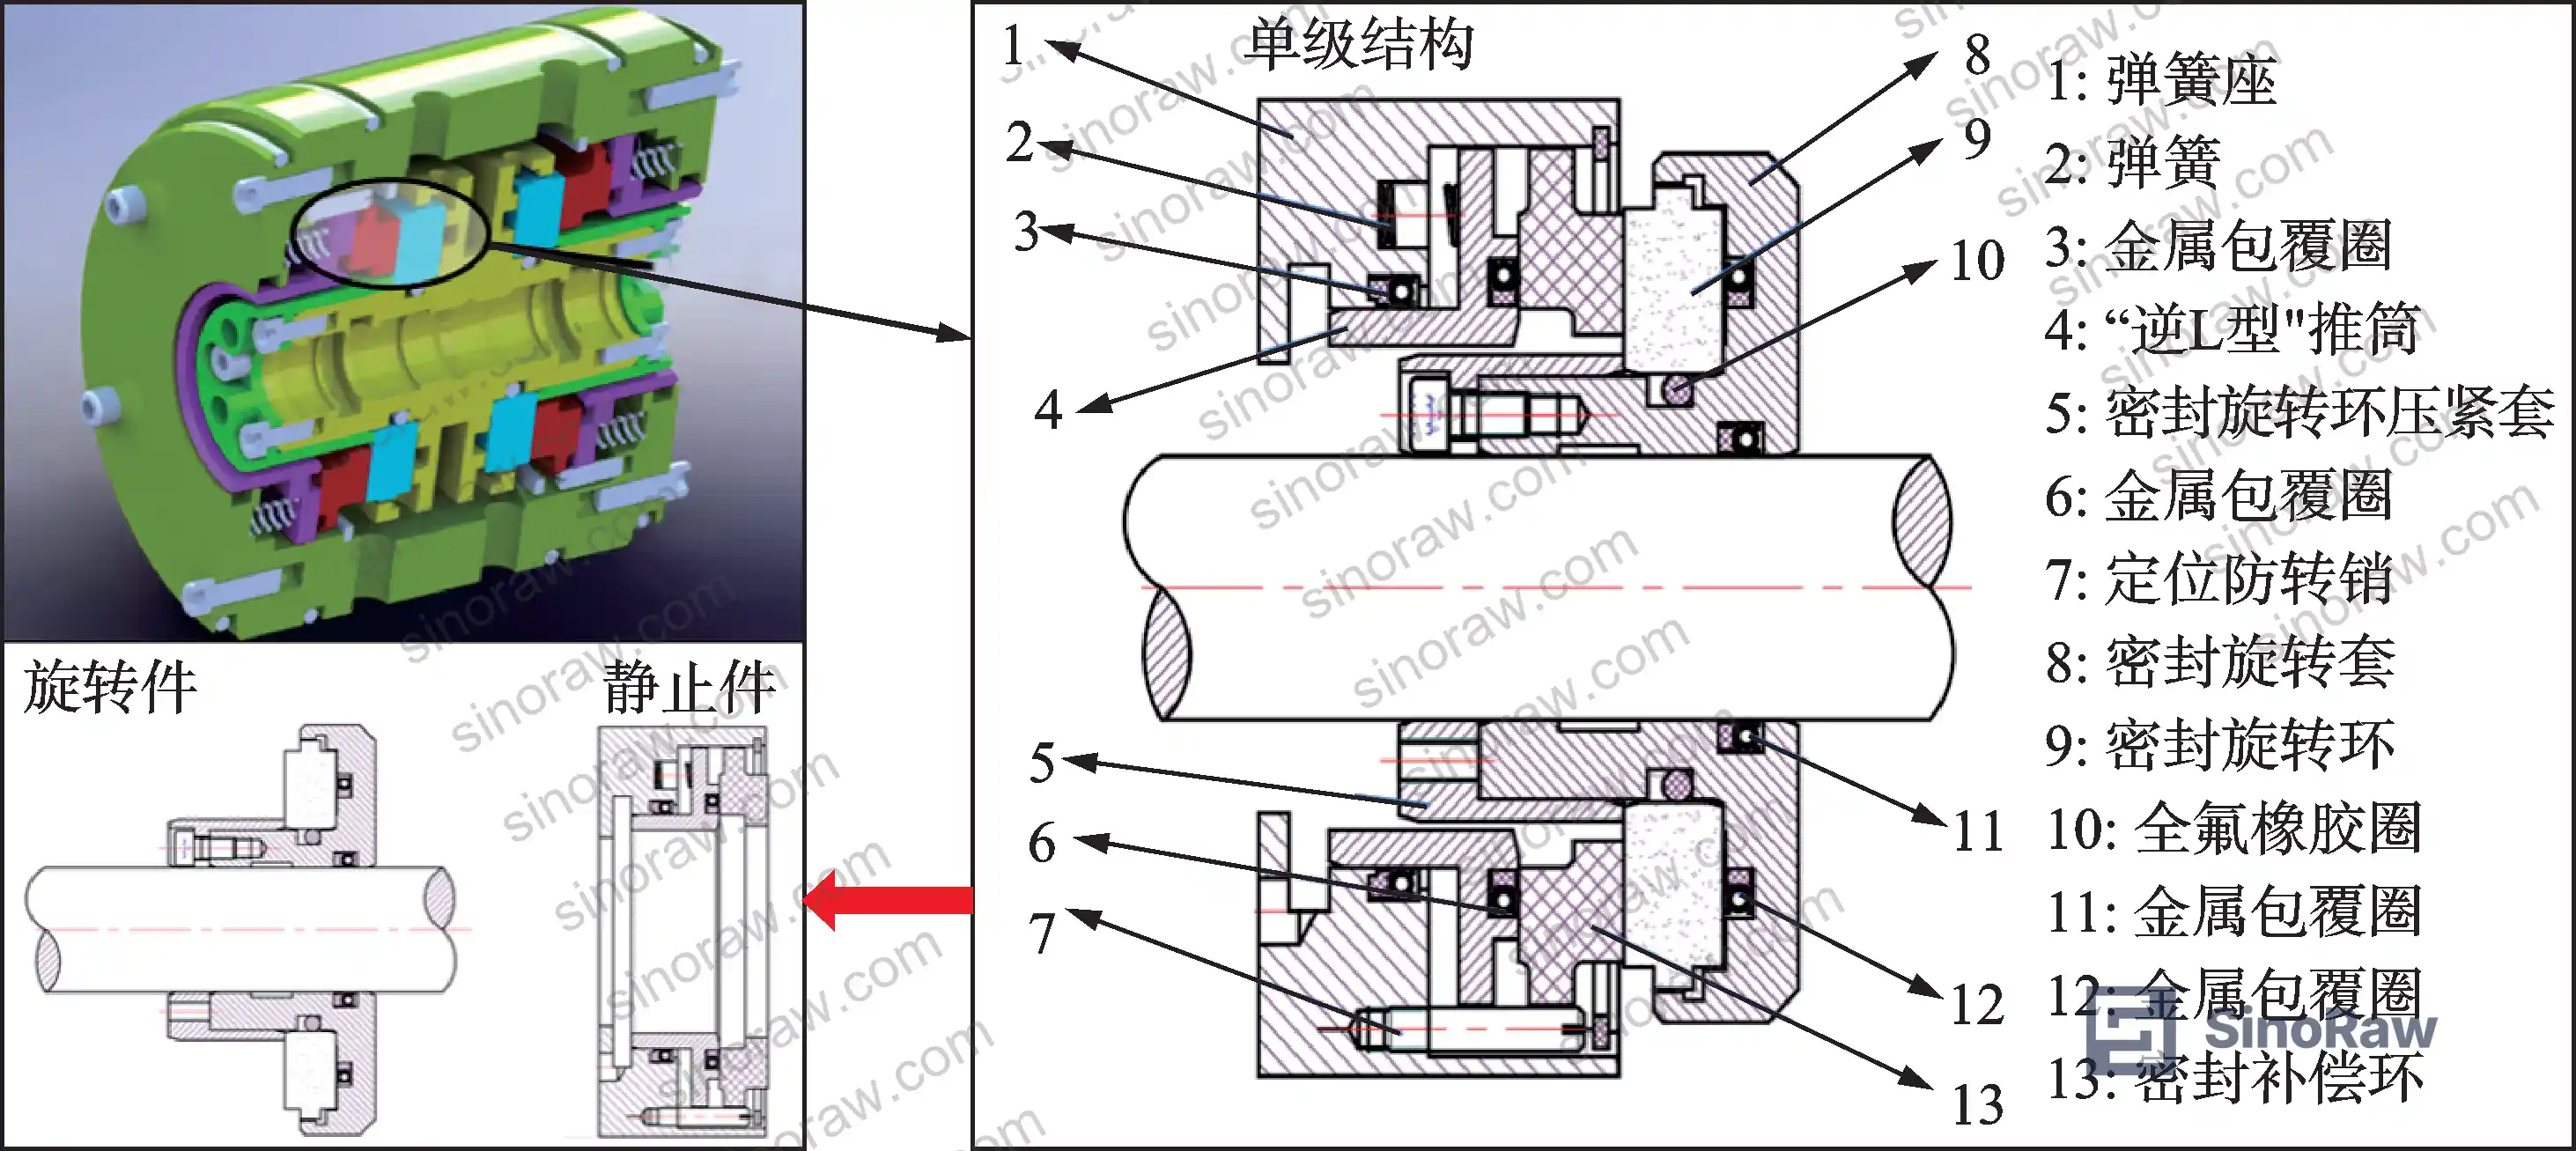
Acoustic Emission Signal Classification for Non-Contact Rotary Seal Fault Conditions #
The core technical challenge with non-contact rotary seal AE signals is that they are simultaneously non-stationary, complex, and overlapping. A standard FFT or even short-time Fourier transform approach struggles here because the fault signatures don’t occupy clean frequency bands — dry friction at 50 r/min produces fundamentally different signal character than mixed lubrication at 600 r/min, and the transitions between lubrication regimes generate transient bursts that can mimic structural faults.
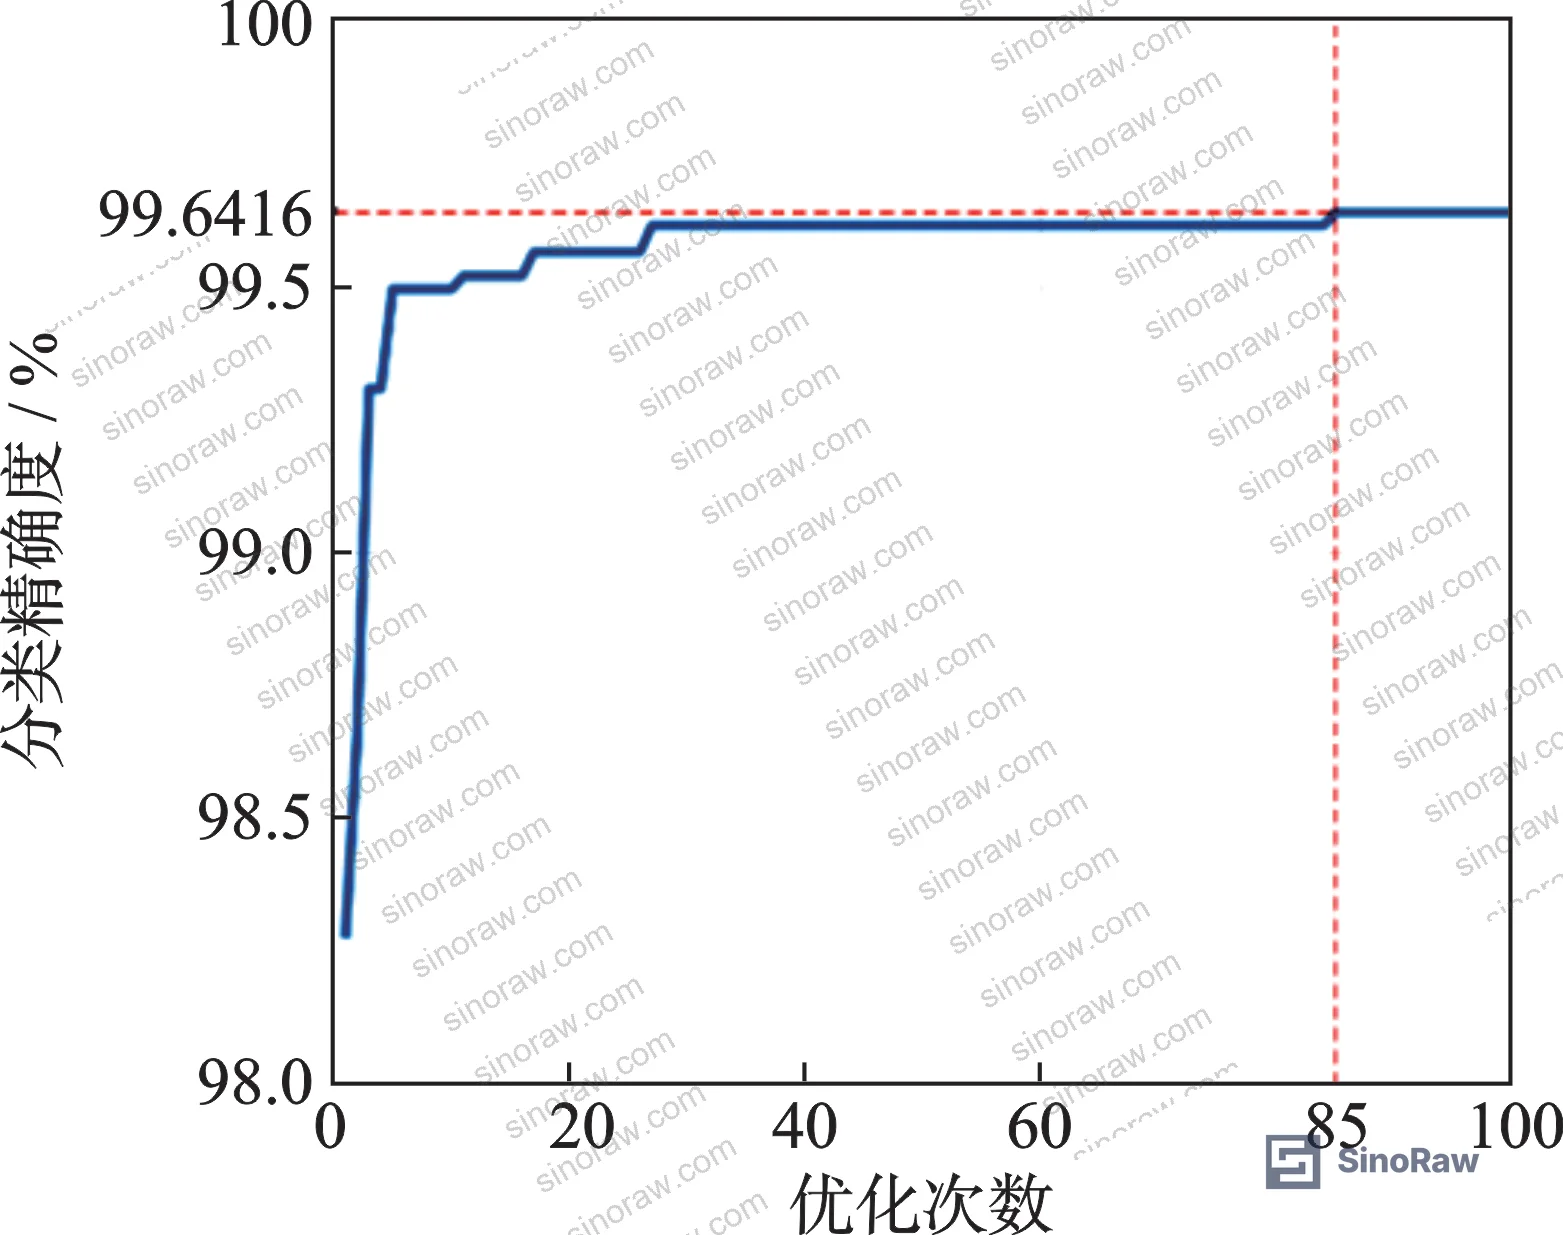
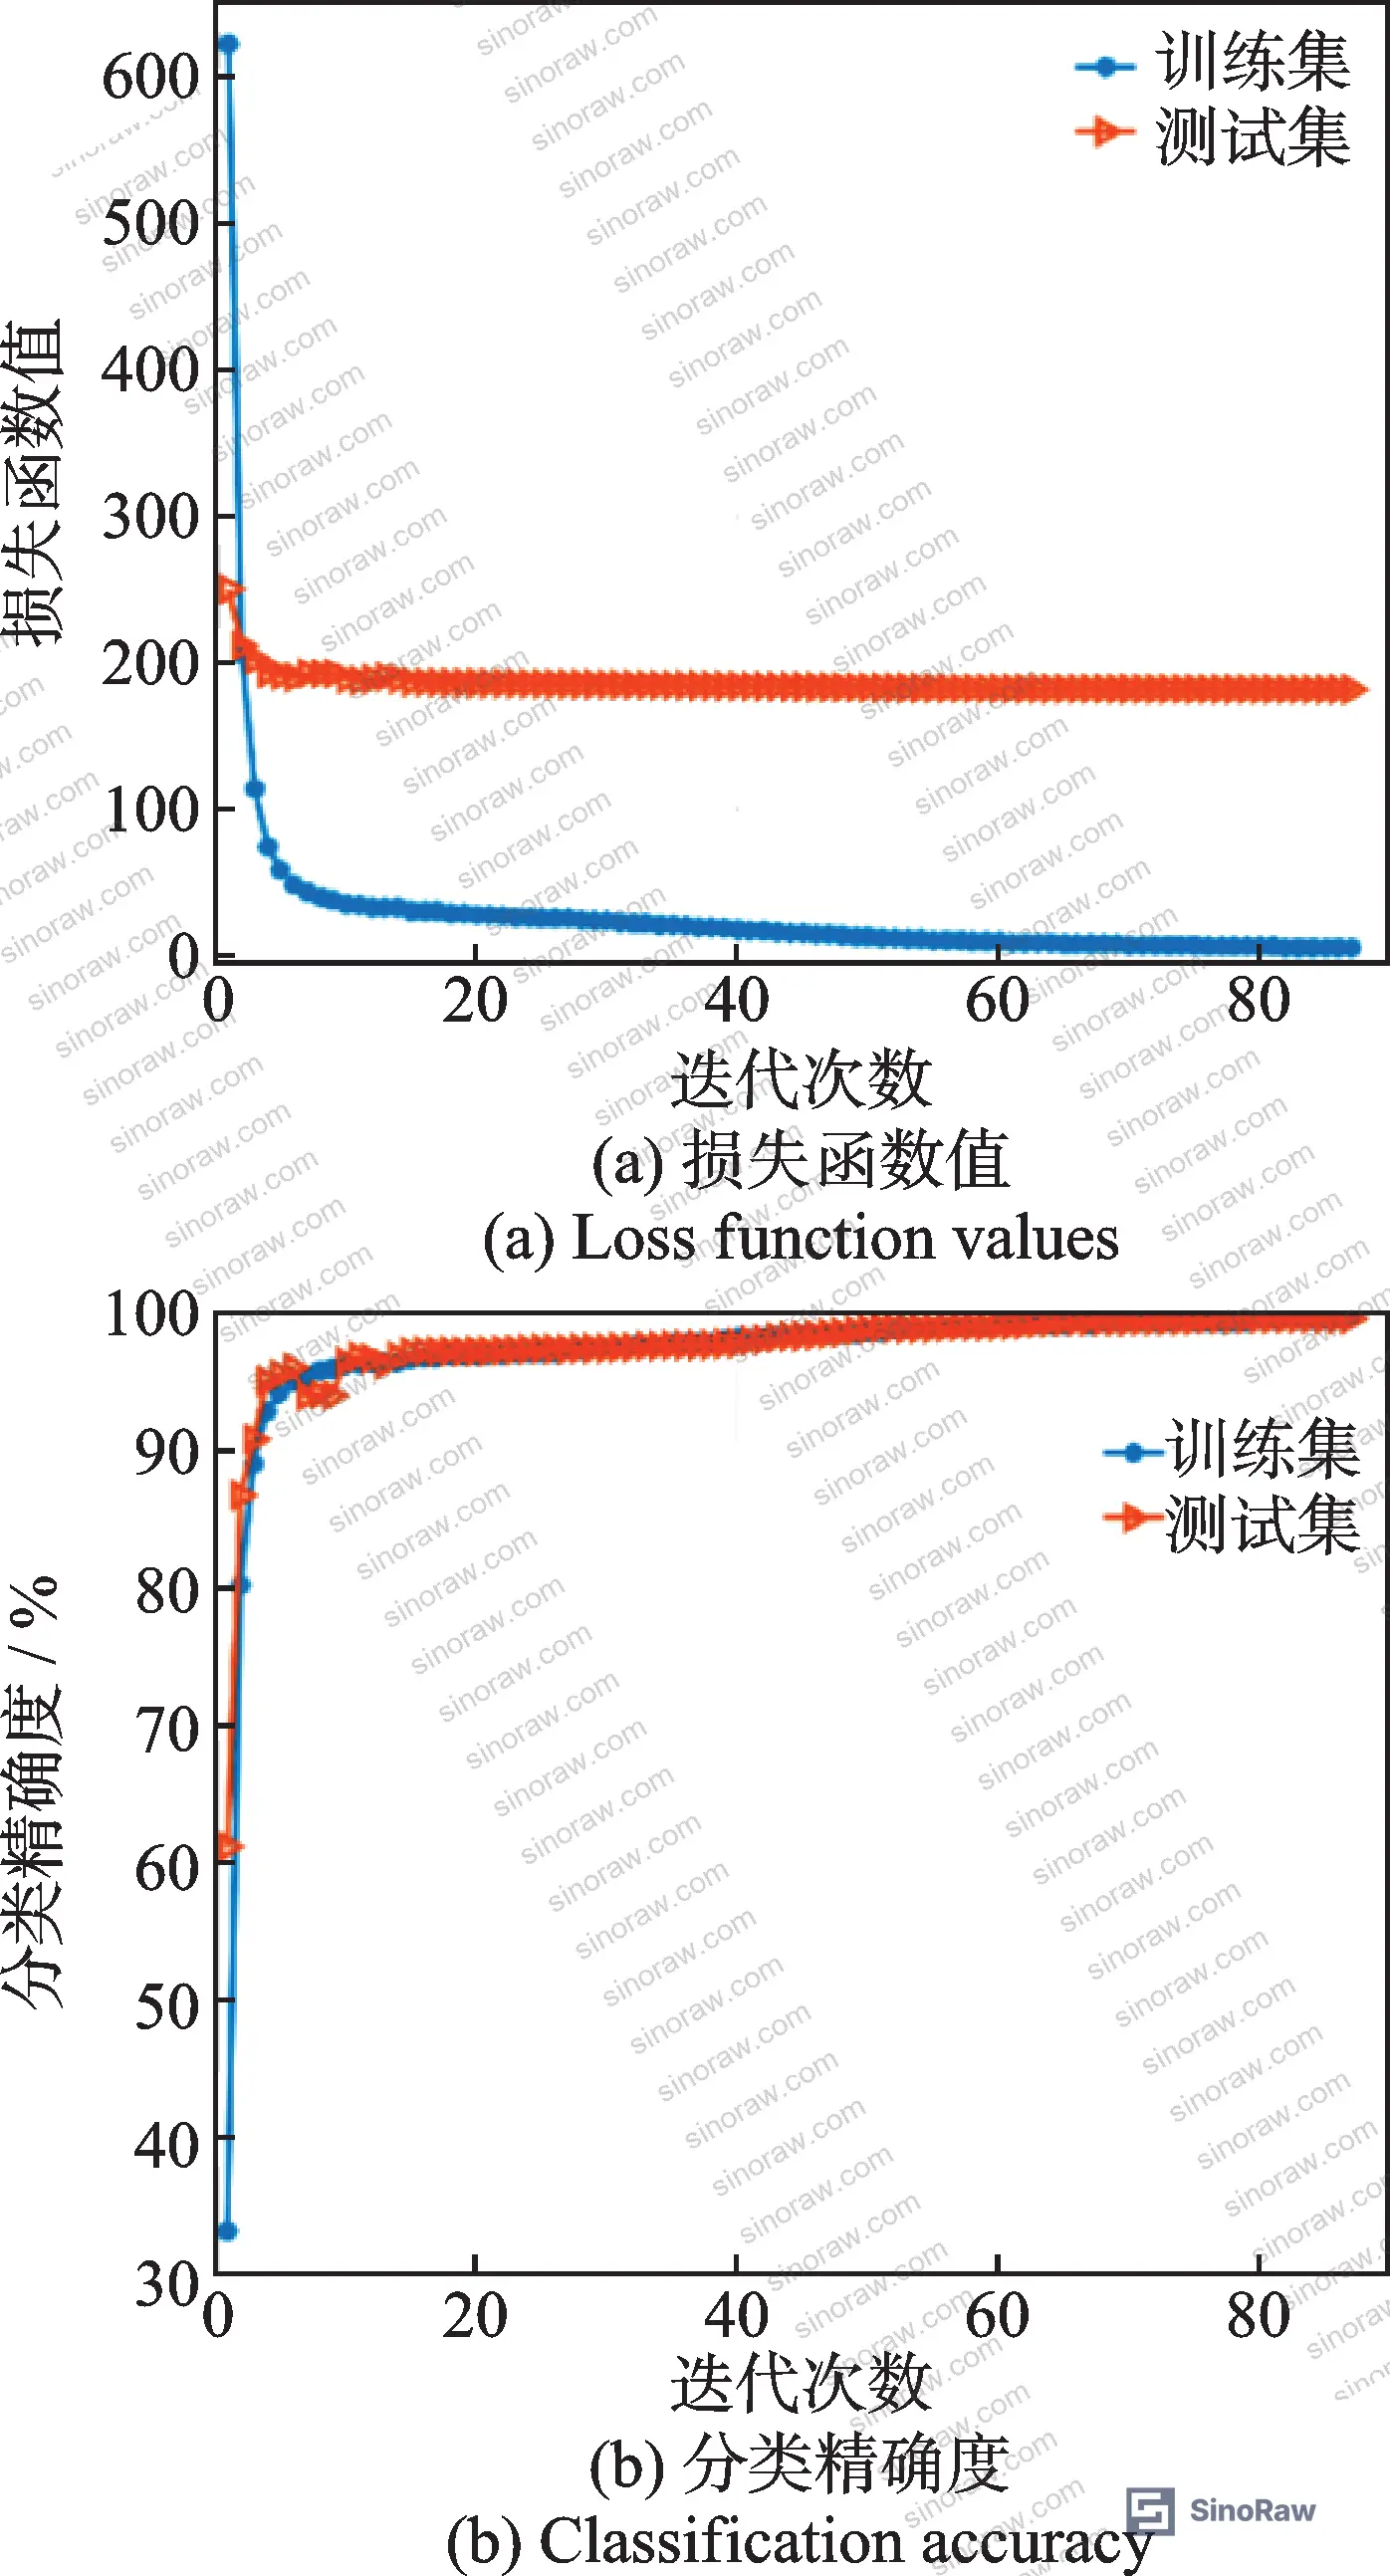
The approach that delivered validated results uses continuous wavelet transform (CWT) with a Morlet mother wavelet to convert raw one-dimensional AE signals into 64×64 time-frequency images. These images then serve as inputs to a modified LeNet-5 CNN architecture with Leaky ReLU activation, max pooling layers, and a Softmax output classifier. Critically, the hyperparameters were not manually tuned — they were optimized using a Bayesian optimization algorithm (BOA) with Noisy Expected Improvement as the acquisition function, running through 85 optimization iterations to reach peak performance.
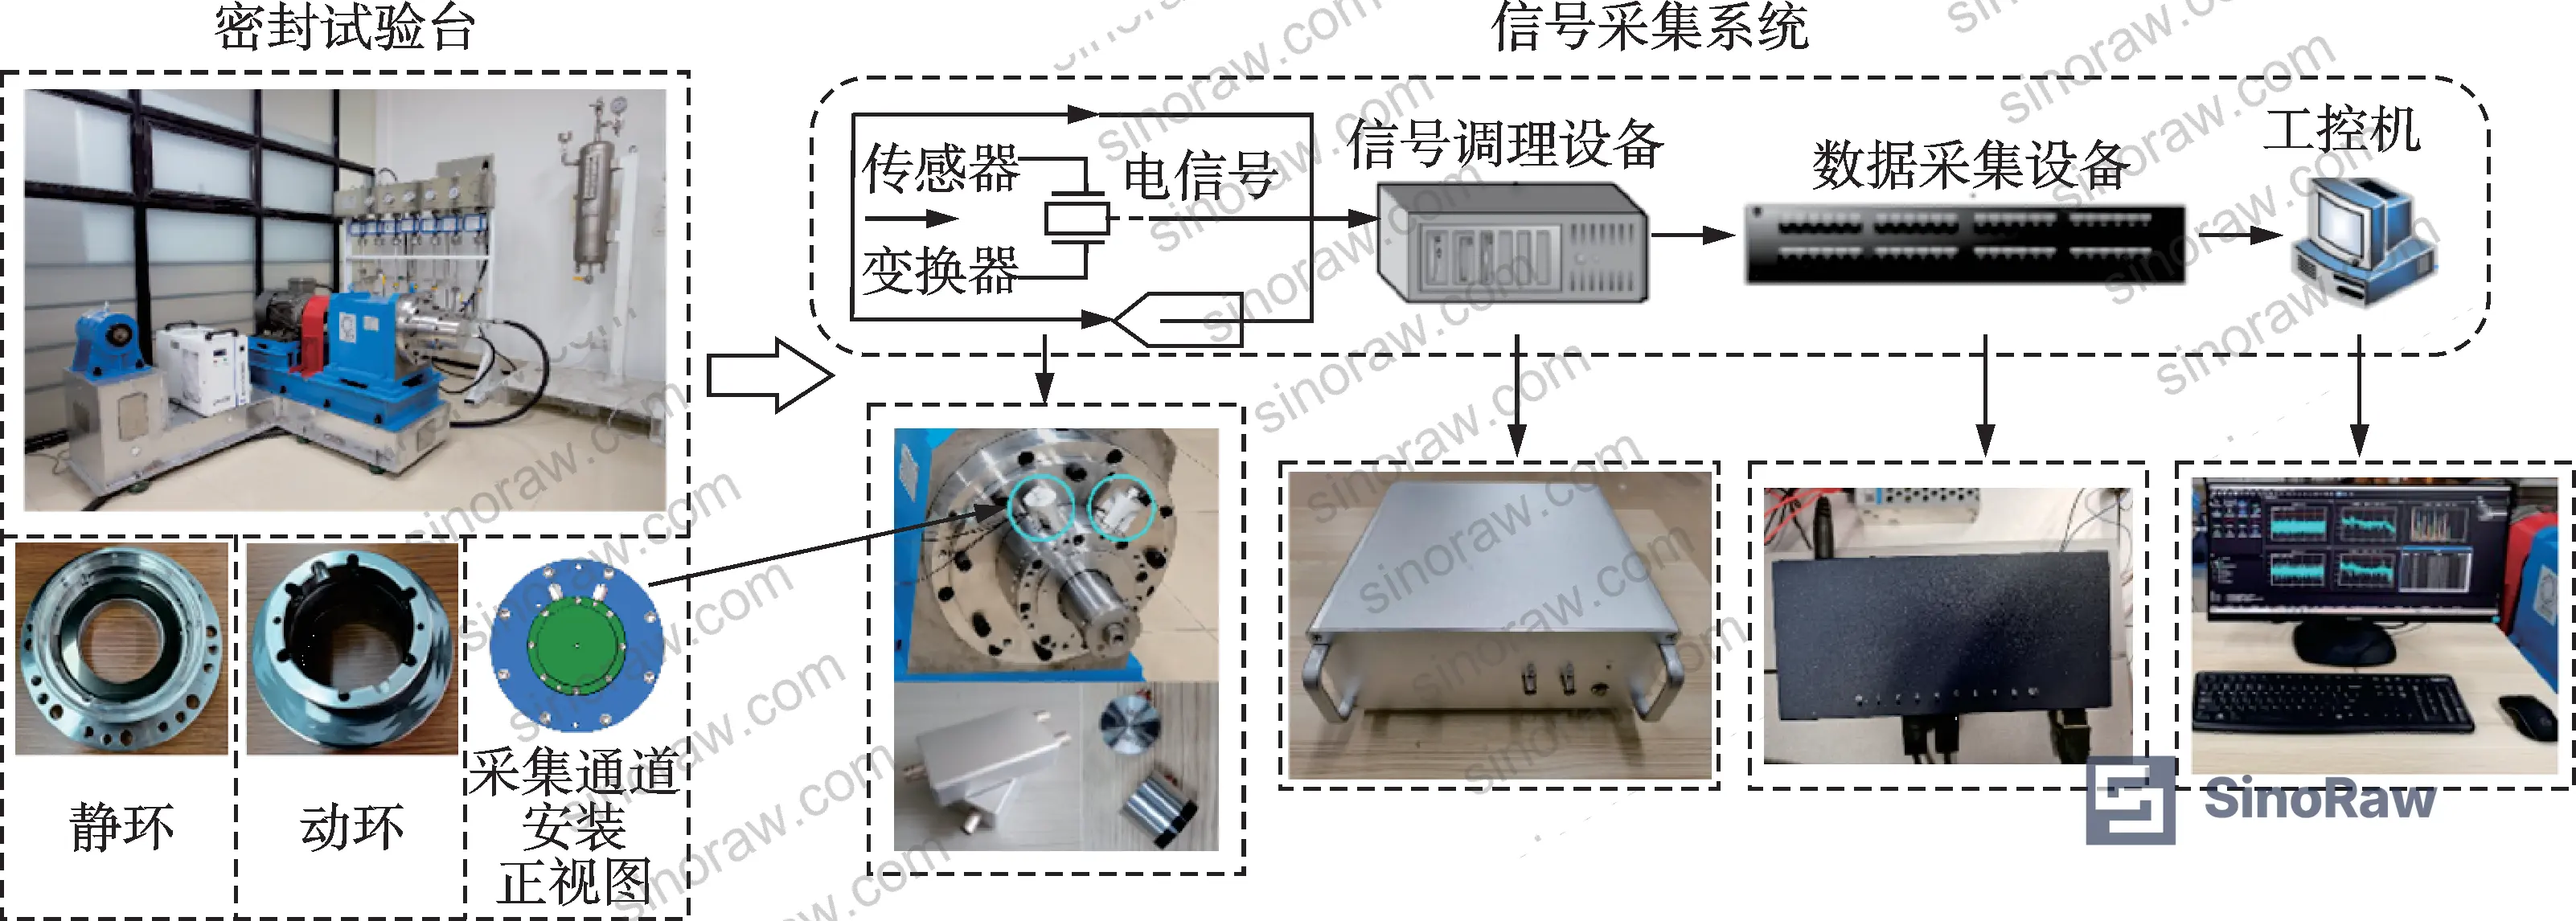
Model comparison results across five configurations:
| Model | Average Classification Accuracy | Hyperparameter Method | Stability (Std Dev) |
|---|---|---|---|
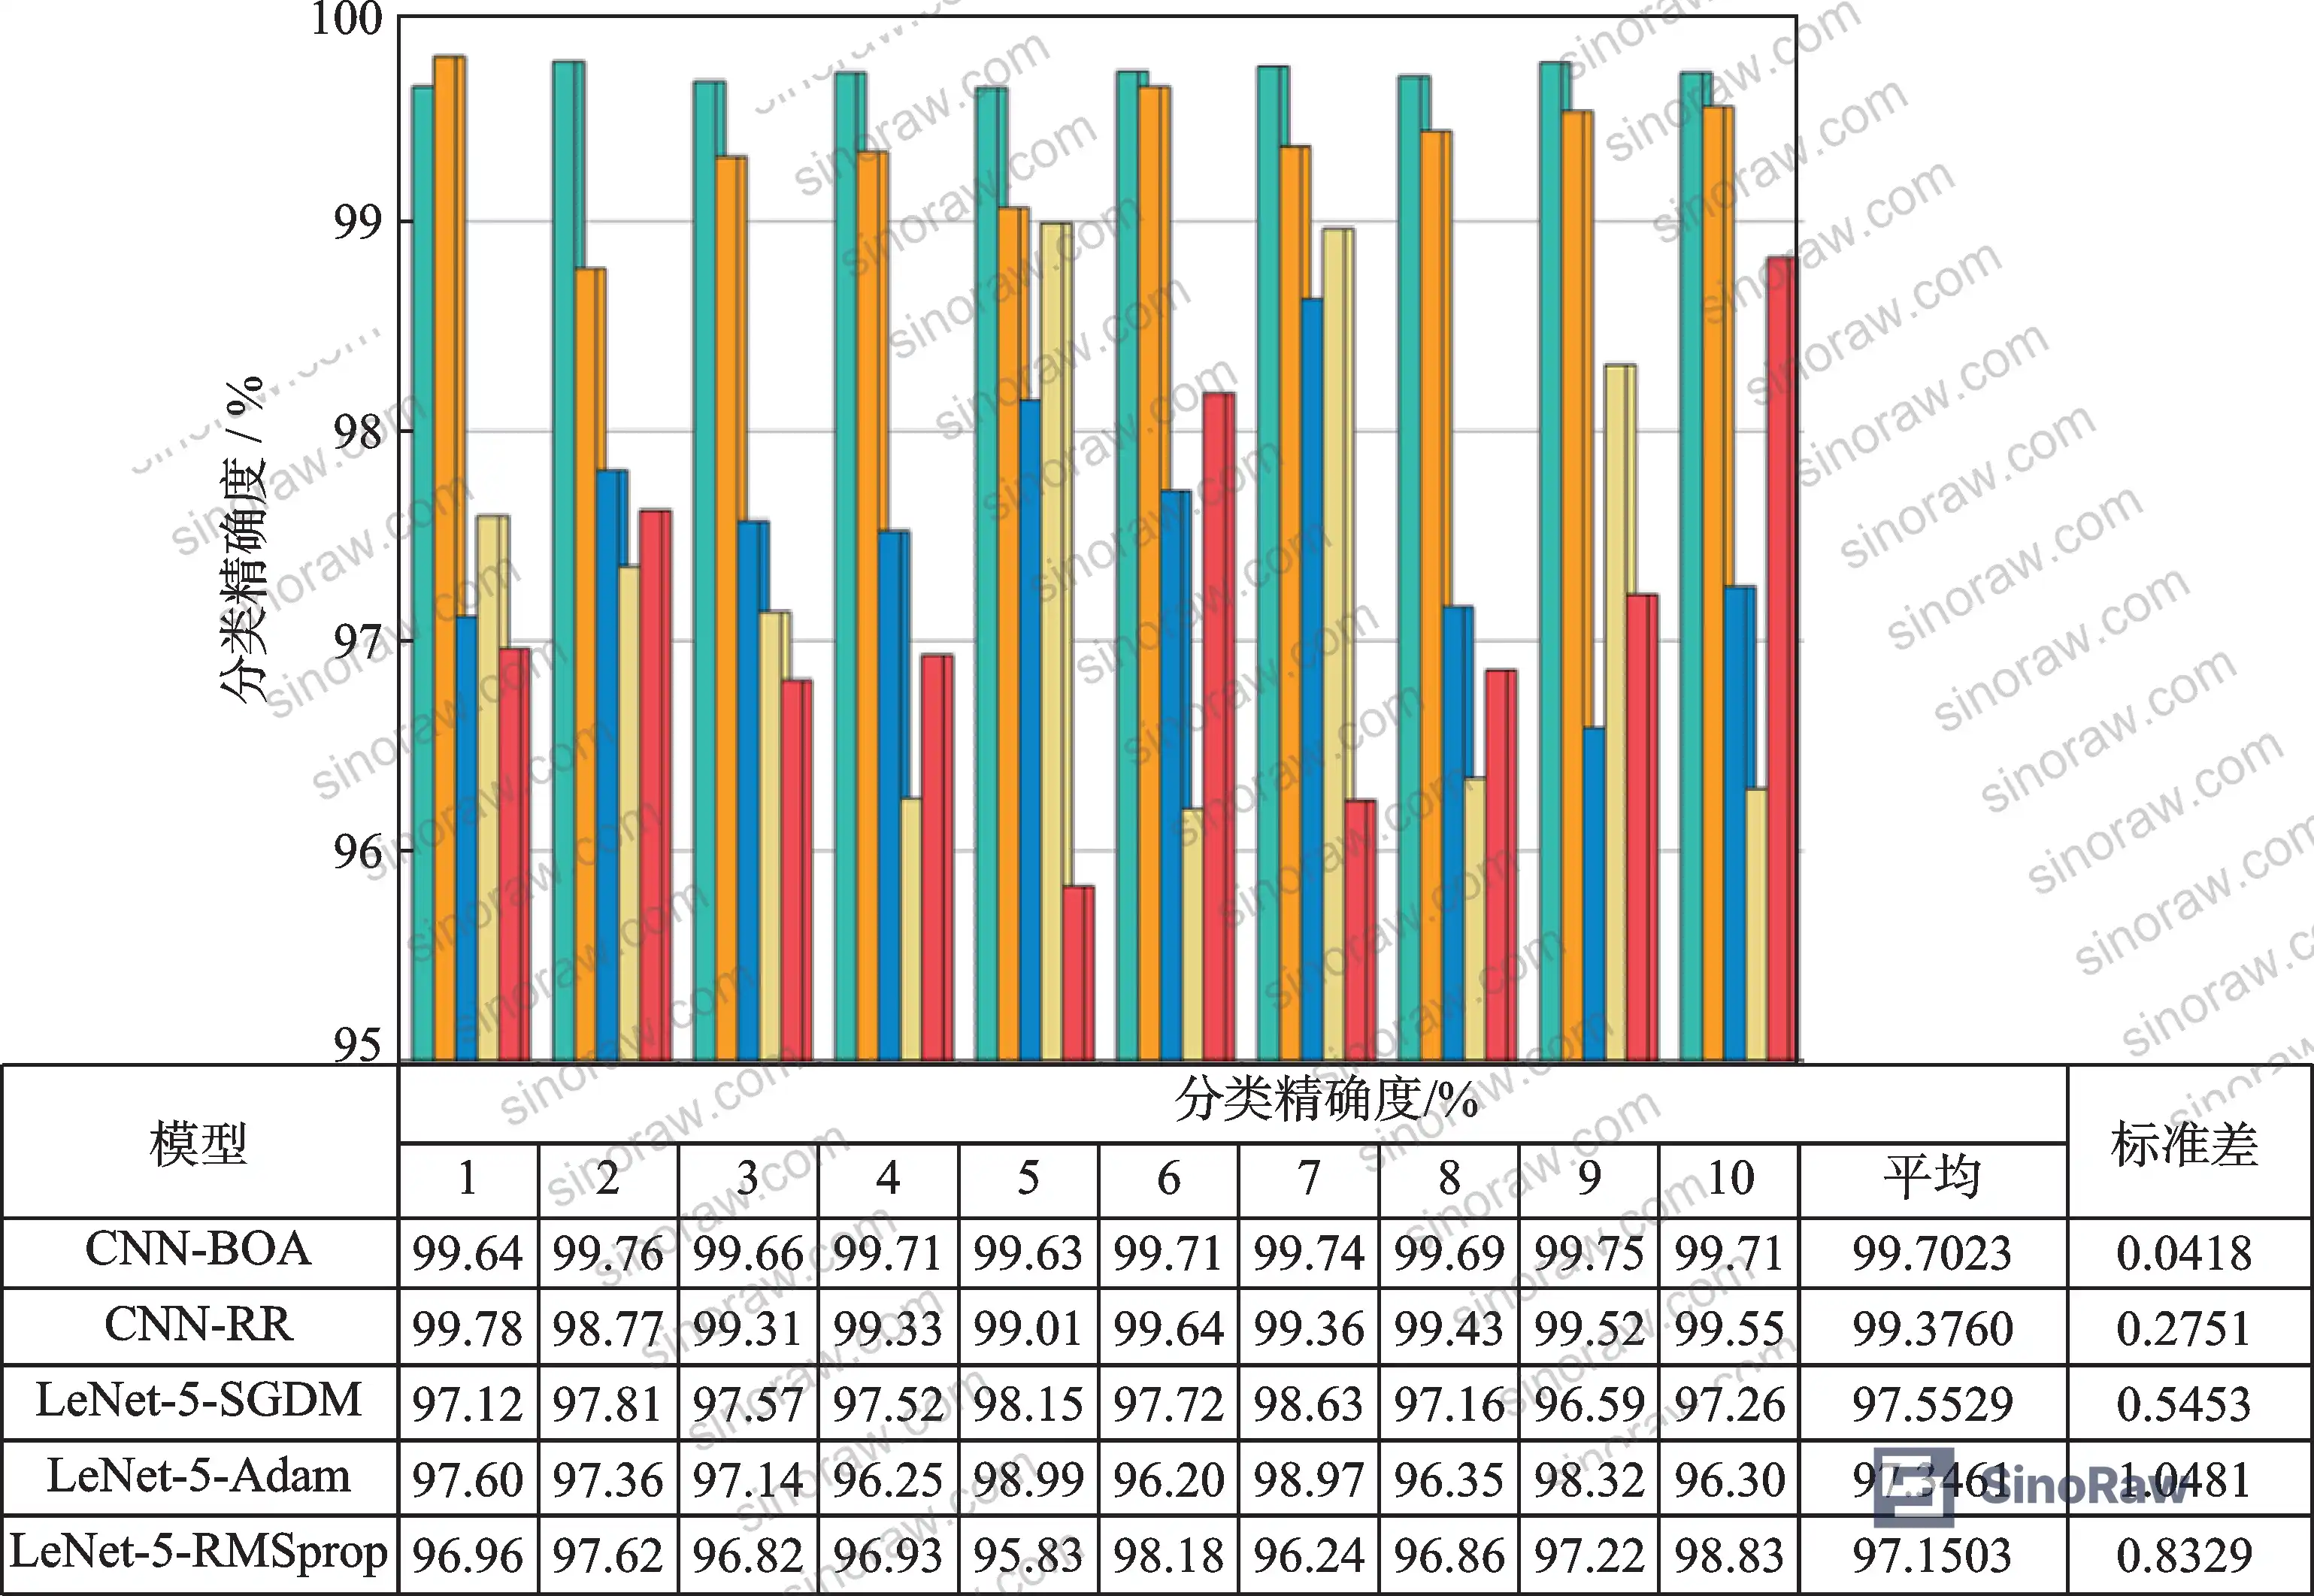
| CNN-BOA (this study) | 99.7023% | Bayesian optimization | Lowest of all 5 models |
| CNN-RR | 99.3760% | Random search | High — unstable across runs |
| LeNet-5-SGDM | 97.5529% (best manual) | Manual tuning, SGDM | Moderate |
| LeNet-5-Adam | Below 97.5529% | Manual tuning, Adam | Poor |
| LeNet-5-RMSprop | Below 97.5529% | Manual tuning, RMSprop | Poor |
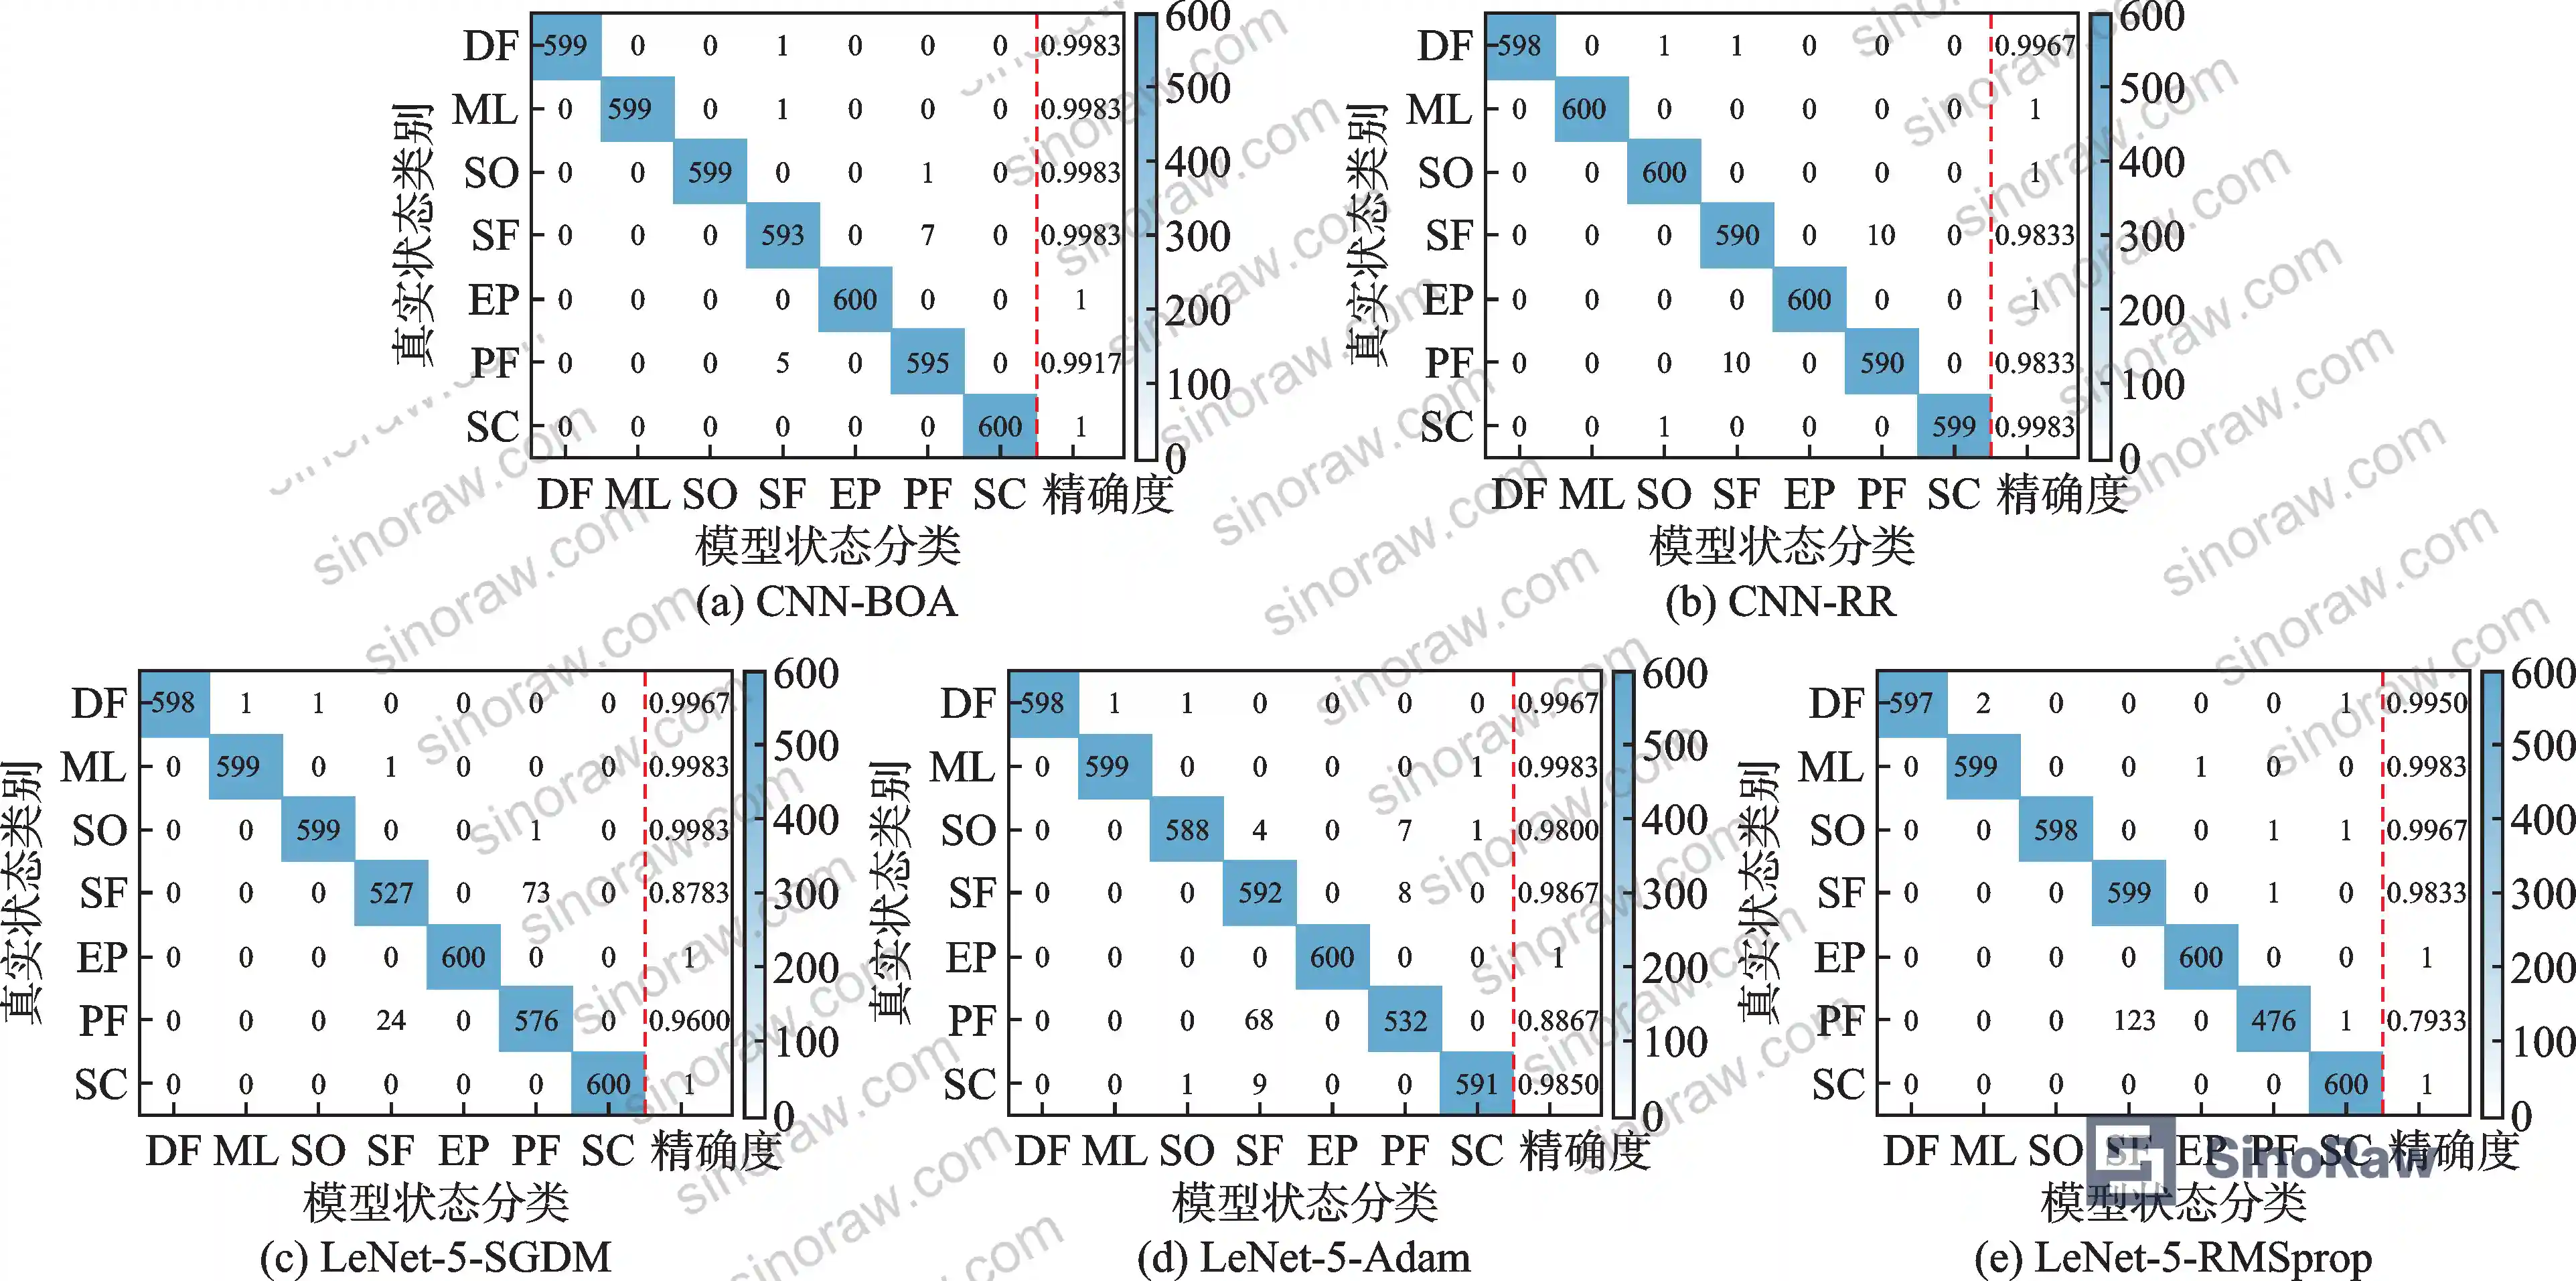
The CNN-BOA model achieved 100% classification accuracy for end-face pitting (EP) and end-face scratching (SC) states. The remaining confusions were concentrated between SF and PF — 7 SF samples misclassified as PF, 5 PF samples misclassified as SF. This is the hardest diagnostic pair in the dataset, and it has a direct engineering explanation: uniform spring failure and local spring failure generate time-frequency patterns that are structurally similar because both affect the closing force distribution across the seal face, altering the gas film characteristics in comparable ways.
The final optimized hyperparameters converged to: learning rate 0.00717, 87 training epochs, SGDM gradient optimization, batch size 27, Conv1 kernel size 4 with 4 output channels, Conv2 kernel size 5 with 29 output channels, FC1 output units 298, FC2 output units 108. The model reached >99% classification accuracy by just the second BOA iteration — the remaining 83 iterations refined stability rather than pushing the accuracy ceiling.
Bayesian Optimization and Deep Learning Performance: What the Data Actually Shows #
Most procurement teams don’t realize that the choice of hyperparameter optimization method affects not just accuracy but repeatability — and repeatability is what matters in a production monitoring deployment where you need consistent fault calls across shift changes and seasonal operating condition variations.
The 10-run repeated trial results make this stark. CNN-BOA showed minimal variance across all ten runs, with the smallest standard deviation of any model tested. CNN-RR (random search optimization) matched BOA in average accuracy at 99.3760% but with significantly higher standard deviation — meaning some individual runs dipped below acceptable thresholds. The manually tuned LeNet-5 models showed the worst run-to-run consistency, with LeNet-5-Adam and LeNet-5-RMSprop displaying “obvious differences” across repeat trials in the researchers’ own characterization.
Honestly, most buyers over-specify the raw accuracy number and under-specify stability requirements. A system that claims 99.5% accuracy in a single vendor demonstration but drops to 97% under real operating variability is worse than a system that delivers a consistent 98.5% across varied conditions. Demand standard deviation data from repeated trials, not just peak accuracy.
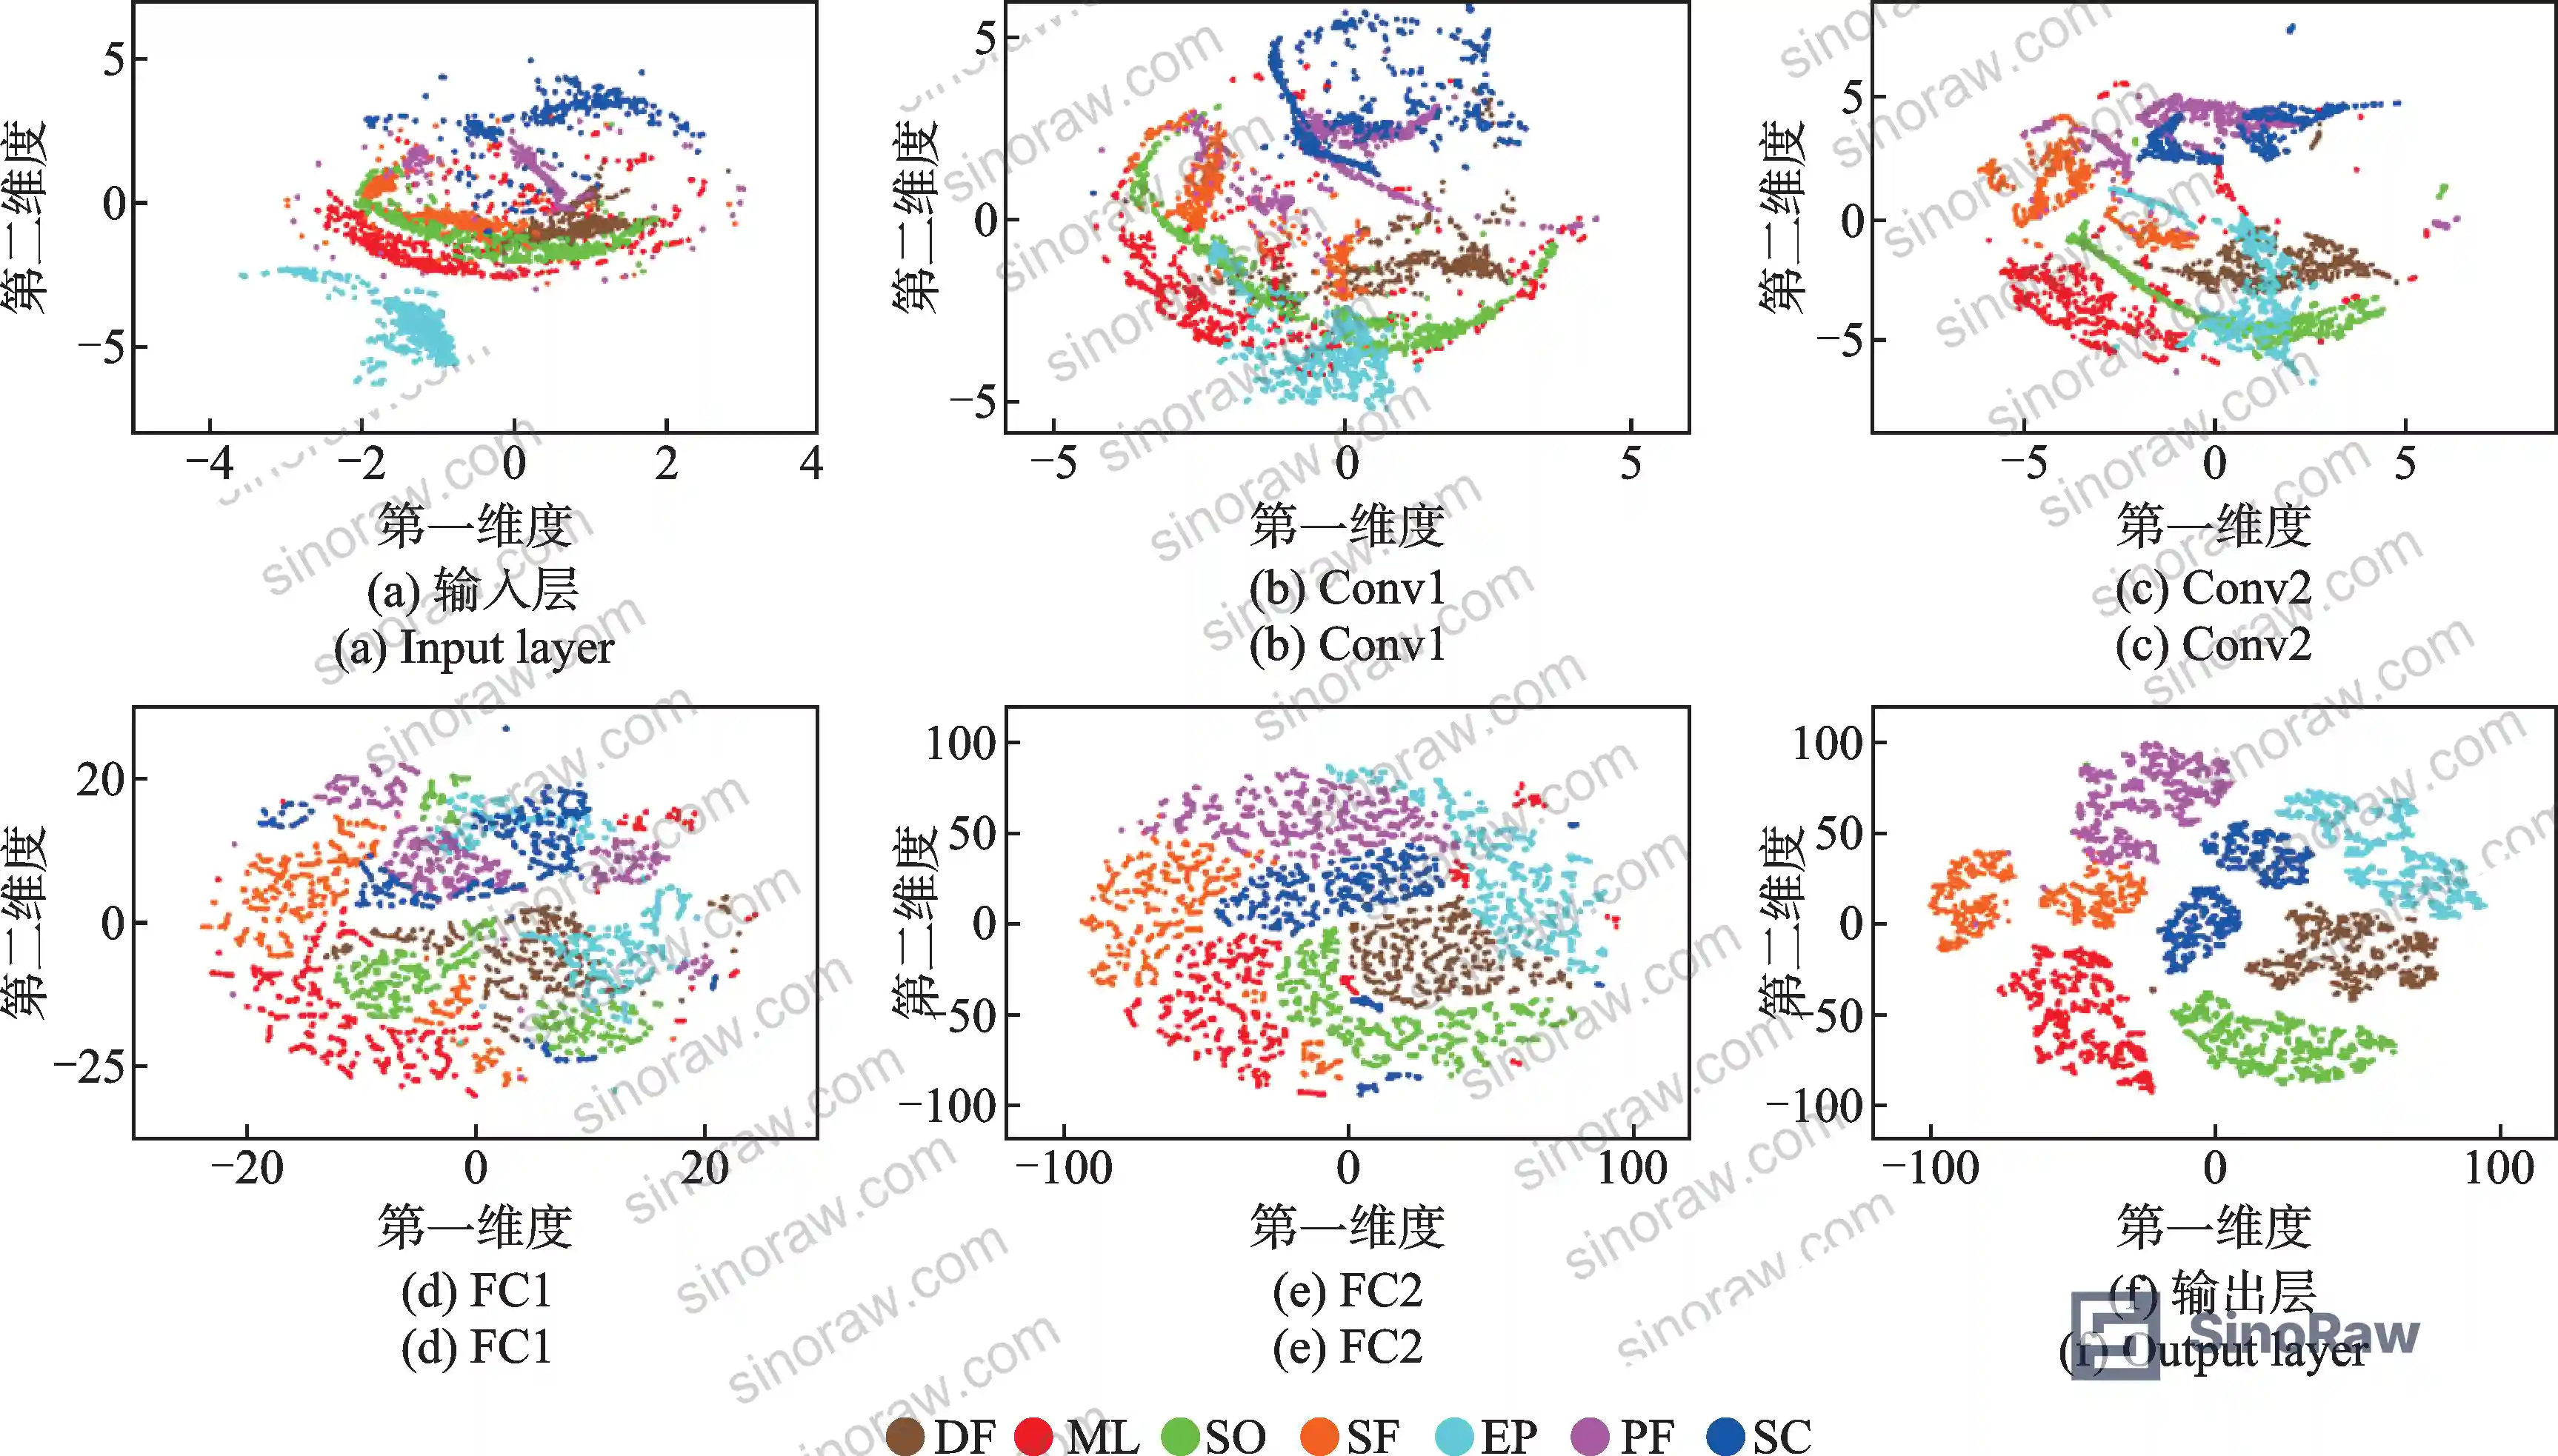
The t-SNE visualization analysis confirmed that the CNN layers progressively separate the seven fault classes. At the raw input stage, the features for mixed lubrication (ML), normal operation (SO), uniform spring failure (SF), and local spring failure (PF) overlap severely in two-dimensional feature space — confirming why simpler threshold-based monitoring fails on this seal type. After passing through Conv1, Conv2, FC1, and FC2, the clusters tighten substantially, with the final classification layer producing seven clearly separated distributions.
]
Compliance with ISO 9001:2015 Quality management systems is relevant here not just for the monitoring hardware supplier but for the seal manufacturer: a supplier whose QMS includes AE-based end-of-line or in-process seal testing has a fundamentally different quality control capability than one relying on dimensional inspection alone.
Current industry data shows that seal-related failures account for a disproportionate share of unplanned downtime in rotating equipment — particularly in compressor and pump applications where non-contact (gas-lubricated) seals are used. Yet most procurement specifications still require only static leakage rate testing at acceptance, with no requirement for dynamic fault signature validation. This is a gap worth closing.
For buyers sourcing seals that will be used in condition-monitored installations, the diagnostic data from this research also confirms something important about the seal’s mechanical design: the Stribeck curve-governed transition from mixed lubrication to hydrodynamic lubrication generates a characteristic AE signature that is reliably distinguishable from both dry friction and structural faults. This means a well-tuned monitoring system can validate that your seals are operating in the correct lubrication regime — not just alert you when they’ve already failed.
For applications involving sealing of aggressive media or operating under REACH-regulated chemical exposure, the REACH Regulation (EC) No 1907/2006 framework also places documentation requirements on seal face materials — particularly carbon-graphite and silicon carbide grades — that should be confirmed before purchase.
Practical Guidance for Buyers #
If you’re specifying non-contact rotary seals for a new installation or qualifying Chinese suppliers for an existing application, the diagnostic data in this research translates directly into procurement requirements that are worth writing into your technical specification.
First, understand what you’re actually buying. A non-contact rotary seal operates on a gas film measured in single-digit micrometers. The spiral groove geometry that generates hydrodynamic lift is machined to tolerances that most buyers never verify — and cannot verify with standard dimensional gauging. AE-based monitoring during acceptance testing is one of the few ways to confirm that the seal is genuinely operating in the hydrodynamic lubrication regime rather than in mixed friction.
Second, distinguish between seal suppliers and monitoring capability. The 99.7% classification accuracy figure comes from purpose-built research hardware with a 1.25 MHz sampling rate and 13–1,035 kHz bandwidth. Budget AE sensors with 100 kHz bandwidth will not capture the signal features needed to separate dry friction from mixed lubrication. If a supplier claims their seals are “AI-monitored,” ask specifically about sensor bandwidth and sampling rate.
Third, the SF/PF confusion pair — uniform spring failure vs. local spring failure — is diagnostically the hardest problem in this dataset. Even the best model misclassified 12 samples between these two classes. In procurement terms: if a supplier’s monitoring system cannot differentiate spring failure modes, its maintenance dispatch value is limited.
At sinoraw.com, our role is to help overseas procurement engineers connect with verified Chinese manufacturers of industrial sealing components and associated monitoring systems — we’re a Guangzhou-based sourcing service, not a manufacturer, and we specialize in pre-qualifying suppliers before you issue RFQs. For pump and valve seal applications requiring AE monitoring compatibility, see our Pump & Valve Seals category for qualified supplier profiles.
For related condition monitoring and detection technologies relevant to rotating equipment, our Sensors & Detection category covers AE sensor hardware and signal acquisition systems sourced from verified Chinese manufacturers.
Equipment operating under ISO 14001:2015 Environmental management systems certified facilities should also verify that seal face materials and any lubricant additives comply with environmental discharge requirements — a point that is often missed when the focus is entirely on mechanical performance.
Need help identifying qualified suppliers for non-contact rotary seals or AE monitoring systems? Talk to our sourcing team →
Supplier Qualification Questions #
- What is your AE sensor bandwidth specification for seal acceptance testing — specifically, does it cover the 13–1,035 kHz range required to capture the full acoustic emission spectrum of non-contact rotary seal fault conditions?
- Can you provide confusion matrix data from your fault classification model showing per-class recall rates for all seven operating conditions, including separate figures for uniform spring failure (SF) and local spring failure (PF), which are the hardest-to-separate fault pair in validated research?
- What is your model’s average classification accuracy across a minimum of 10 repeated independent trials, and what is the standard deviation — not peak accuracy from a single test run?
- At what motor speed and pressure conditions are your seal acceptance samples tested during AE signal acquisition — specifically, can you confirm structural fault detection is performed at 1,000 r/min under 0.1 MPa to align with validated diagnostic parameters?
- Does your hyperparameter optimization use Bayesian optimization or an equivalent systematic method, and can you demonstrate that the optimized model reaches >99% classification accuracy within the first 5 optimization iterations on your validation dataset?
Sourcing Checklist #
- ☐ AE acquisition system sampling rate is confirmed at ≥1.25 MHz with frequency bandwidth covering at least 13–1,035 kHz
- ☐ Supplier can provide classification accuracy data of ≥99.7% average across 7 seal operating conditions using a CNN or equivalent deep learning model
- ☐ Standard deviation of classification accuracy is confirmed across ≥10 repeated trials, not from a single test run
- ☐ Time-frequency analysis uses CWT (Morlet wavelet) or equivalent method producing ≥64×64 resolution input images for the classification model
- ☐ Supplier can separately identify and report on the SF/PF fault pair (uniform spring failure vs. local spring failure) with documented recall rates for each class
- ☐ Seal face material documentation includes REACH compliance confirmation for carbon-graphite or SiC grades
- ☐ Acceptance testing protocol specifies minimum 2,000 AE samples per fault class for model validation, consistent with the 14,000-sample validated dataset standard
- ☐ Supplier holds ISO 9001:2015 certification covering both seal manufacturing and quality inspection processes
Key Specifications Table #
| Parameter | Recommended Value | Verification Method |
|---|---|---|
| AE sensor sampling rate | ≥1.25 MHz | Hardware datasheet + live acquisition log |
| AE sensor frequency bandwidth | 13–1,035 kHz | Manufacturer calibration certificate |
| Fault classification accuracy (CNN-BOA or equivalent) | ≥99.70% average across 7 conditions | Confusion matrix from ≥10 repeated trials |
| Time-frequency image resolution | ≥64×64 pixels (CWT output) | Model input specification sheet |
| Minimum training/validation sample size | ≥14,000 samples (2,000 per class) | Dataset documentation |
| Test pressure for structural fault conditions | 0.1 MPa | Test protocol document |
| Seal operating speed for structural fault detection | 1,000 r/min | Test protocol document |
| Model hyperparameter optimization | Bayesian optimization, ≥85 iterations | Optimization log/convergence curve |
Can’t find a supplier meeting these specs? Submit your requirements and we’ll match you within 48 hours.
References #
Data source: Acoustic Emission Signal Diagnosis and Fault Classification of Non-Contact Rotary Seals Using Bayesian-Optimized Convolutional Neural Networks, Y. Huang et al., Mechanical Systems and Signal Processing, 2024
Frequently Asked Questions #
What is the difference between non-contact rotary seals and conventional mechanical seals, and why does it matter for fault detection?
Non-contact rotary seals operate with a gas film of only a few micrometers between the rotating and stationary faces, generated by spiral groove hydrodynamic action. Because there is no direct solid-to-solid contact in normal operation, the failure signatures are subtler than in conventional wet mechanical seals — there is no clearcut leakage increase until the seal has already degraded significantly. AE-based monitoring is one of the few methods capable of detecting the transition from hydrodynamic to mixed lubrication before visible leakage begins.
Why can’t standard vibration monitoring detect the fault conditions described in this research?
Standard accelerometer-based vibration monitoring is effective for mass-imbalance, misalignment, and bearing defects because these generate broadband mechanical vibration that couples well to the machine housing. Non-contact rotary seal faults — particularly spring failure and end-face surface defects — generate acoustic emission events in the 13–1,035 kHz ultrasonic range that are largely filtered out by structural damping before reaching typical vibration sensor mounting points. Dedicated AE sensors mounted close to the seal gland are necessary.
How should buyers interpret a supplier’s claimed classification accuracy if they only report a single number?
A single accuracy figure is essentially meaningless without knowing the number of test conditions, the class balance of the test dataset, and — critically — the standard deviation across repeated trials. The validated research showed CNN-RR achieving 99.3760% average accuracy but with high run-to-run variability, while CNN-BOA achieved 99.7023% with the lowest standard deviation of all tested models. Always ask for confusion matrix data broken down by fault class and standard deviation across a minimum of 10 independent runs.
Is the 99.7% accuracy figure achievable in a real field installation, or only in controlled laboratory conditions?
Controlled laboratory data almost always overstates field performance. The research was conducted at fixed pressure (0.1 MPa) and specific motor speeds, with purpose-built test hardware and clean sensor mounting. Real installations introduce cable routing noise, temperature variation, and mechanical interference from adjacent equipment. A reasonable field expectation would be 95–97% classification accuracy if the sensor installation follows recommended practice — still far above any threshold-based monitoring approach.
What seal fault mode should procurement engineers be most concerned about based on this diagnostic data?
The SF/PF pair — uniform spring failure versus local spring failure — is the hardest diagnostic problem in the dataset and also the most maintenance-relevant distinction. Uniform spring failure indicates a systemic issue (wrong spring specification, chemical degradation, or thermal fatigue across all springs), while local spring failure points to a localized defect or assembly error. A monitoring system that cannot separate these two modes will generate the same alert for two conditions requiring different corrective actions, reducing the operational value of the monitoring investment.
Published by sinoraw.com Technical Team | Request a sourcing quote


