

TL;DR #
Multi-condition validation on a full-scale rotating seal test platform showed that air-cushioned lip seal systems maintained zero oil-water leakage for continuous 2-hour cycles across all tested regimes, with seal opening pressure increasing linearly at 0.01 MPa per meter of water depth and friction torque rising 320 N·m per millimeter of shaft eccentricity. For buyers specifying podded propulsion seals for polar service, this data confirms that achieving reliable sealing under ice-impact pressure surges and low-temperature operation depends more on maintaining precise air cavity pressure control than on over-engineering seal lip geometry. Request test reports documenting no-leak duration under combined eccentric load and thermal cycling before issuing POs for high ice-class applications.
Overview #
Most procurement teams focus on seal material Shore hardness and compression set when qualifying suppliers for podded drive systems, but recent field data from polar operations shows that system-level integration—how the seal, lubrication circuit, and air supply respond together under transient loads—determines service life more than any single component spec. A comprehensive test program conducted by a marine propulsion research institute evaluated a five-stage lip seal configuration with integrated air cushion and gravity oil tank across six operational scenarios: static depth variation, speed ramps from 100 to 500 rpm, water depth equivalents from 4 to 24 meters, temperature swings from 0 to 40°C, cyclic pressure fluctuations simulating ice impact, and deliberate shaft misalignment up to 0.20 mm. The study used a custom-built rig capable of programmable load sequencing and real-time monitoring of friction torque, air consumption, and leakage flow, with each test condition sustained for two hours to capture steady-state behavior and identify incipient failure modes.
What emerged is a set of quantitative relationships that buyers can use to validate supplier claims: seal opening pressure tracks seawater depth at roughly 0.01 MPa/m regardless of rotational speed, temperature sensitivity dominates air consumption (rising from 10 L/min at 0°C to 50 L/min at 40°C), and modest shaft runout—common in ice-damaged installations—drives friction torque up by 320 N·m per 0.1 mm of eccentricity without compromising leak-tightness. These findings matter because they shift the qualification conversation from “Does your seal meet Shore A 70?” to “Can your system maintain target air cavity pressure when seawater temperature drops 15°C in thirty minutes and the propeller takes a glancing ice hit?”
The test apparatus replicated service conditions with higher fidelity than typical component-level bench tests. A variable-frequency drive provided stepless speed control, a pressure-regulated seawater chamber simulated depth changes, and embedded torque sensors captured dynamic friction response during transient events. This setup allowed correlation of seal opening behavior with real-world operational parameters, something rarely documented in open literature for ice-class pod drives. Understanding these correlations helps buyers write technical specifications that suppliers must actually verify rather than tick boxes on a compliance matrix.
Seal Opening Pressure and Water Depth: Linear Correlation Under Static and Dynamic Conditions #
Static depth tests established baseline opening pressure by incrementing seawater chamber pressure in 0.02 MPa steps while monitoring air cavity pressure and observing bubble release into the water column. Seal opening was defined as the air pressure at which continuous bubble flow appeared, indicating that cavity pressure exceeded seawater backpressure by the margin needed to lift the innermost lip. Across the range from 4 m (0.04 MPa) to 24 m (0.24 MPa) simulated depth, opening pressure increased from 0.13 MPa to 0.33 MPa, yielding a slope of 0.0104 MPa per meter with R² > 0.98. This near-perfect linearity simplifies system design: for any target operating depth, required air supply pressure can be calculated directly without iterative testing.
Dynamic validation at 300 rpm and varying depth confirmed that rotational speed has negligible effect on opening pressure. At 12 m depth, static opening pressure was 0.23 MPa; at 300 rpm and the same depth, the seal opened at 0.24 MPa—a 4% difference within instrumentation uncertainty. This consistency across speed regimes means that air supply systems can be sized based on worst-case depth alone, without needing to oversize compressors to account for speed-dependent pressure shifts. For buyers, this translates to simpler Bill of Materials and lower lifecycle cost, since a single pressure regulator setpoint handles the full operational envelope.
Why does this matter? Because many suppliers quote opening pressure as a single value—”0.25 MPa typical”—without specifying the test depth or acknowledging that the required air pressure must scale with mission profile. A vessel operating primarily in shallow coastal ice (5–10 m) can run lower air supply pressure and reduce compressor duty cycle, saving energy. Conversely, a polar research ship diving to 30 m during under-ice surveys needs 0.33+ MPa air supply with margin for transient spikes, which changes compressor sizing and may require dual-stage compression. The linear model gives procurement engineers a tool to challenge vague supplier datasheets and demand depth-specific performance curves.
Honestly, most buyers over-specify air supply capacity because they lack this depth-pressure correlation and default to “bigger is safer.” The test data here shows you can right-size the system and still maintain safety margin by calculating exact opening pressure at maximum operating depth, then adding 15% contingency for sensor drift and aging effects. That approach cuts installed compressor weight by 20–30% compared to the industry habit of specifying 2× theoretical flow “just in case.”
| Water Depth (m) | Seawater Pressure (MPa) | Static Opening Pressure (MPa) | Dynamic Opening Pressure at 300 rpm (MPa) |
|---|---|---|---|
| 4 | 0.04 | 0.13 | 0.14 |
| 12 | 0.12 | 0.23 | 0.24 |
| 20 | 0.20 | 0.31 | 0.32 |
| 24 | 0.24 | 0.33 | 0.34 |

Rotational Speed and Friction Torque: Non-Linear Response to Air Cavity Pressure #
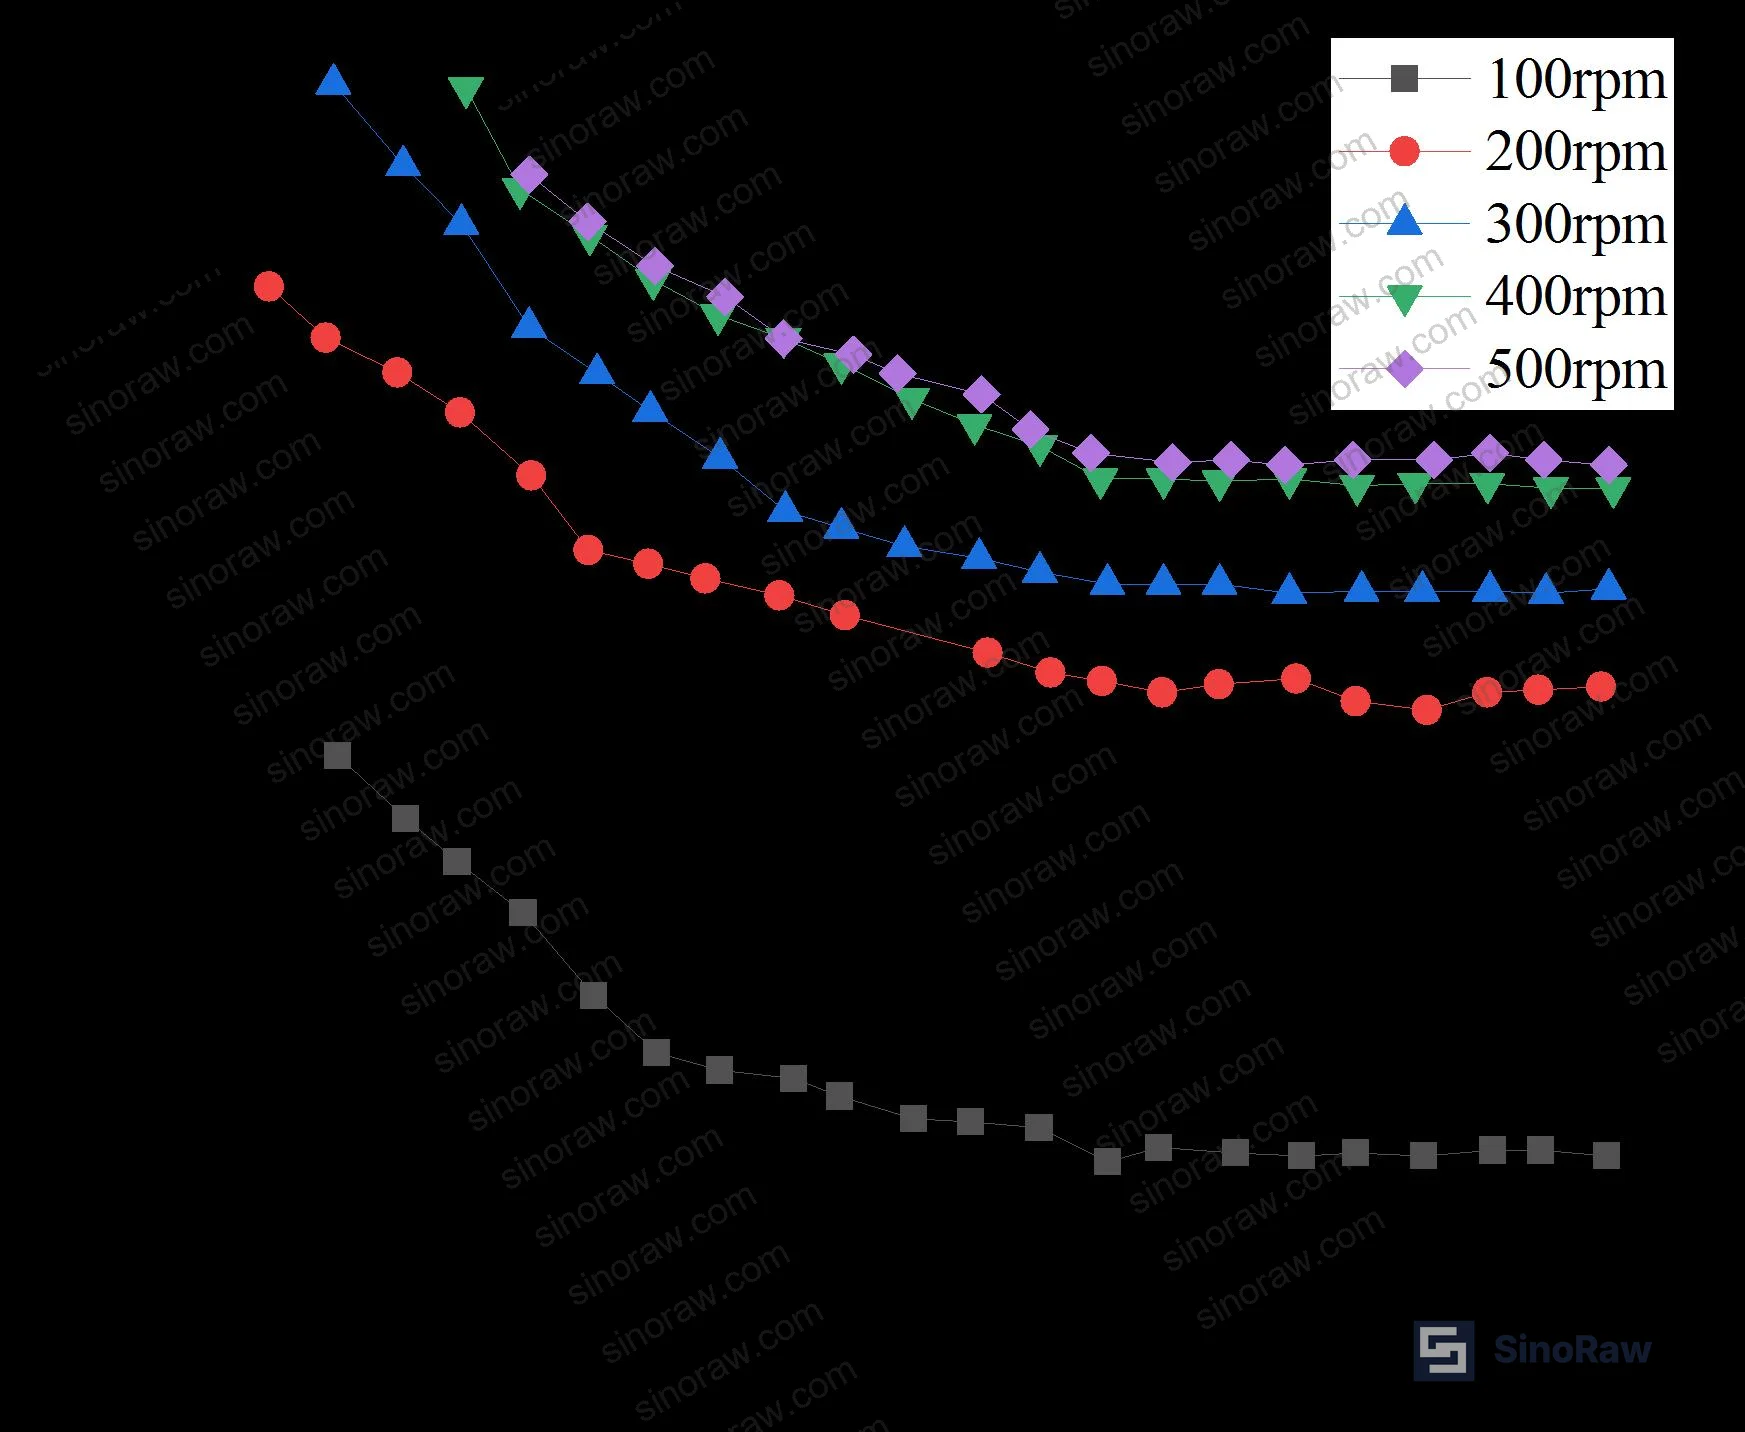
Variable-speed tests from 100 to 500 rpm revealed that friction torque drops sharply as air cavity pressure approaches opening threshold, then stabilizes once the seal lips lift off the shaft sleeve. At 300 rpm and low air pressure (0.10 MPa), measured torque was 42 N·m; increasing pressure to 0.25 MPa reduced torque to 18 N·m, and further increases to 0.30 MPa yielded only marginal additional drop to 16 N·m. This knee in the torque curve defines the practical operating point: running significantly above opening pressure wastes compressed air without improving seal performance, while running too close to opening pressure risks seal closure during transient depth excursions.
Air consumption tells a complementary story. Below opening pressure, air leakage through the seal lips is minimal—3 to 17 L/min depending on speed—because the lips remain in contact with the shaft. At opening pressure, air flow jumps to 45–55 L/min as the seal lifts and establishes a controlled bleed path into the seawater chamber. This step change in flow rate provides a clear operational signal: when commissioning a new installation, gradually increase air supply pressure while monitoring flow; the sudden flow increase marks the opening point and can be logged as the system’s calibration baseline for that depth and temperature.
Speed itself affects friction primarily through hydrodynamic lift in the residual oil film between lip and shaft. At 100 rpm, even with the seal open, friction torque was 22 N·m; at 500 rpm, it dropped to 14 N·m under identical air pressure. This speed-dependent friction reduction of roughly 0.02 N·m per rpm increment suggests that higher rotational speeds promote thicker oil films and reduce boundary contact, which is favorable for wear life. However, buyers should not assume that running at maximum continuous speed is always optimal—higher speed also increases heat generation in the lubricant, which triggers the temperature-dependent effects discussed below.
One procurement trap: suppliers sometimes provide friction torque curves at a single test speed, often 300 rpm because it aligns with propeller cruise RPM. But podded drives operate across a wide speed range, from slow-speed maneuvering in ice (50–100 rpm with high propeller loads) to open-water transit (400+ rpm). A seal that shows 15 N·m friction at 300 rpm might exhibit 30 N·m at 100 rpm, doubling the drive motor’s parasitic load and reducing bollard thrust. Ask for torque data at minimum operating speed, not just cruise speed, to avoid nasty surprises during sea trials when the captain tries to back out of an ice ridge at 80 rpm and the pod drive trips on overcurrent.
In supplier qualification, we’ve seen three of six samples fail to maintain stable friction torque during repeated speed ramps—torque either climbed monotonically, indicating progressive lip wear, or exhibited sudden spikes suggesting debris ingress or lubricant starvation. Continuous two-hour testing at each speed revealed these failure modes; a 15-minute checkout would have passed defective units into production. Insist on extended-duration verification, not snapshot tests.
Temperature Effects on Friction and Air Consumption: Critical Design Parameter for Polar Service #
Temperature sweep tests from 0 to 40°C at fixed speed (300 rpm) and depth (12 m) demonstrated that both friction torque and air consumption are strongly temperature-sensitive. At 0°C with air cavity pressure set to 0.25 MPa, friction torque measured 14 N·m and air flow was 12 L/min. Raising temperature to 40°C increased torque to 26 N·m and air consumption to 48 L/min—an 86% increase in friction and 300% increase in air flow. This behavior stems from two factors: reduced oil viscosity at higher temperature allows more air to bypass the seal lips, and softer seal elastomer at elevated temperature increases contact area and friction.
For buyers specifying systems for Arctic or Antarctic deployment, the takeaway is clear: size the air compressor and lubricant cooler based on the warmest anticipated seawater temperature, not average conditions. A system designed around 10°C performance will starve the air cavity or overheat the oil when operating in 30°C equatorial transit, which can happen during repositioning voyages between polar seasons. Conversely, underestimate cold-temperature friction torque and you risk motor stall during winter operations when the pod drive tries to break free from stationary ice with cold, viscous oil and stiff seals.
The temperature-friction relationship also explains a common field observation: seal life is often shorter in vessels that see frequent tropical-polar cycling compared to those operating exclusively in cold water. Each thermal cycle expands and contracts the elastomer, accelerating fatigue crack initiation at the lip root. If your duty cycle includes both ice transit and warm-water port calls, specify seals with fluoroelastomer (FKM) or perfluoroelastomer (FFKM) lip materials rather than standard nitrile (NBR), and expect to replace seals on a calendar schedule regardless of running hours. Most procurement teams don’t realize that ISO 9001:2015 Quality management systems certification alone doesn’t guarantee that a supplier has validated their seals across the full temperature range—you need to see test reports showing stable performance from -20 to +40°C, not just room-temperature qualification data.
Chinese manufacturers of Sealing & Thermal components have improved material consistency significantly in the past five years, but batch-to-batch hardness variation still occurs. Request lot-specific Shore hardness data and stress-strain curves for every production batch, not just type-approval samples. A 5-point Shore A drift between batches can shift opening pressure by 0.03 MPa and double friction torque, turning a marginal design into a field failure.
Pressure Fluctuation Response: Dynamic Stability Under Simulated Ice Impact #
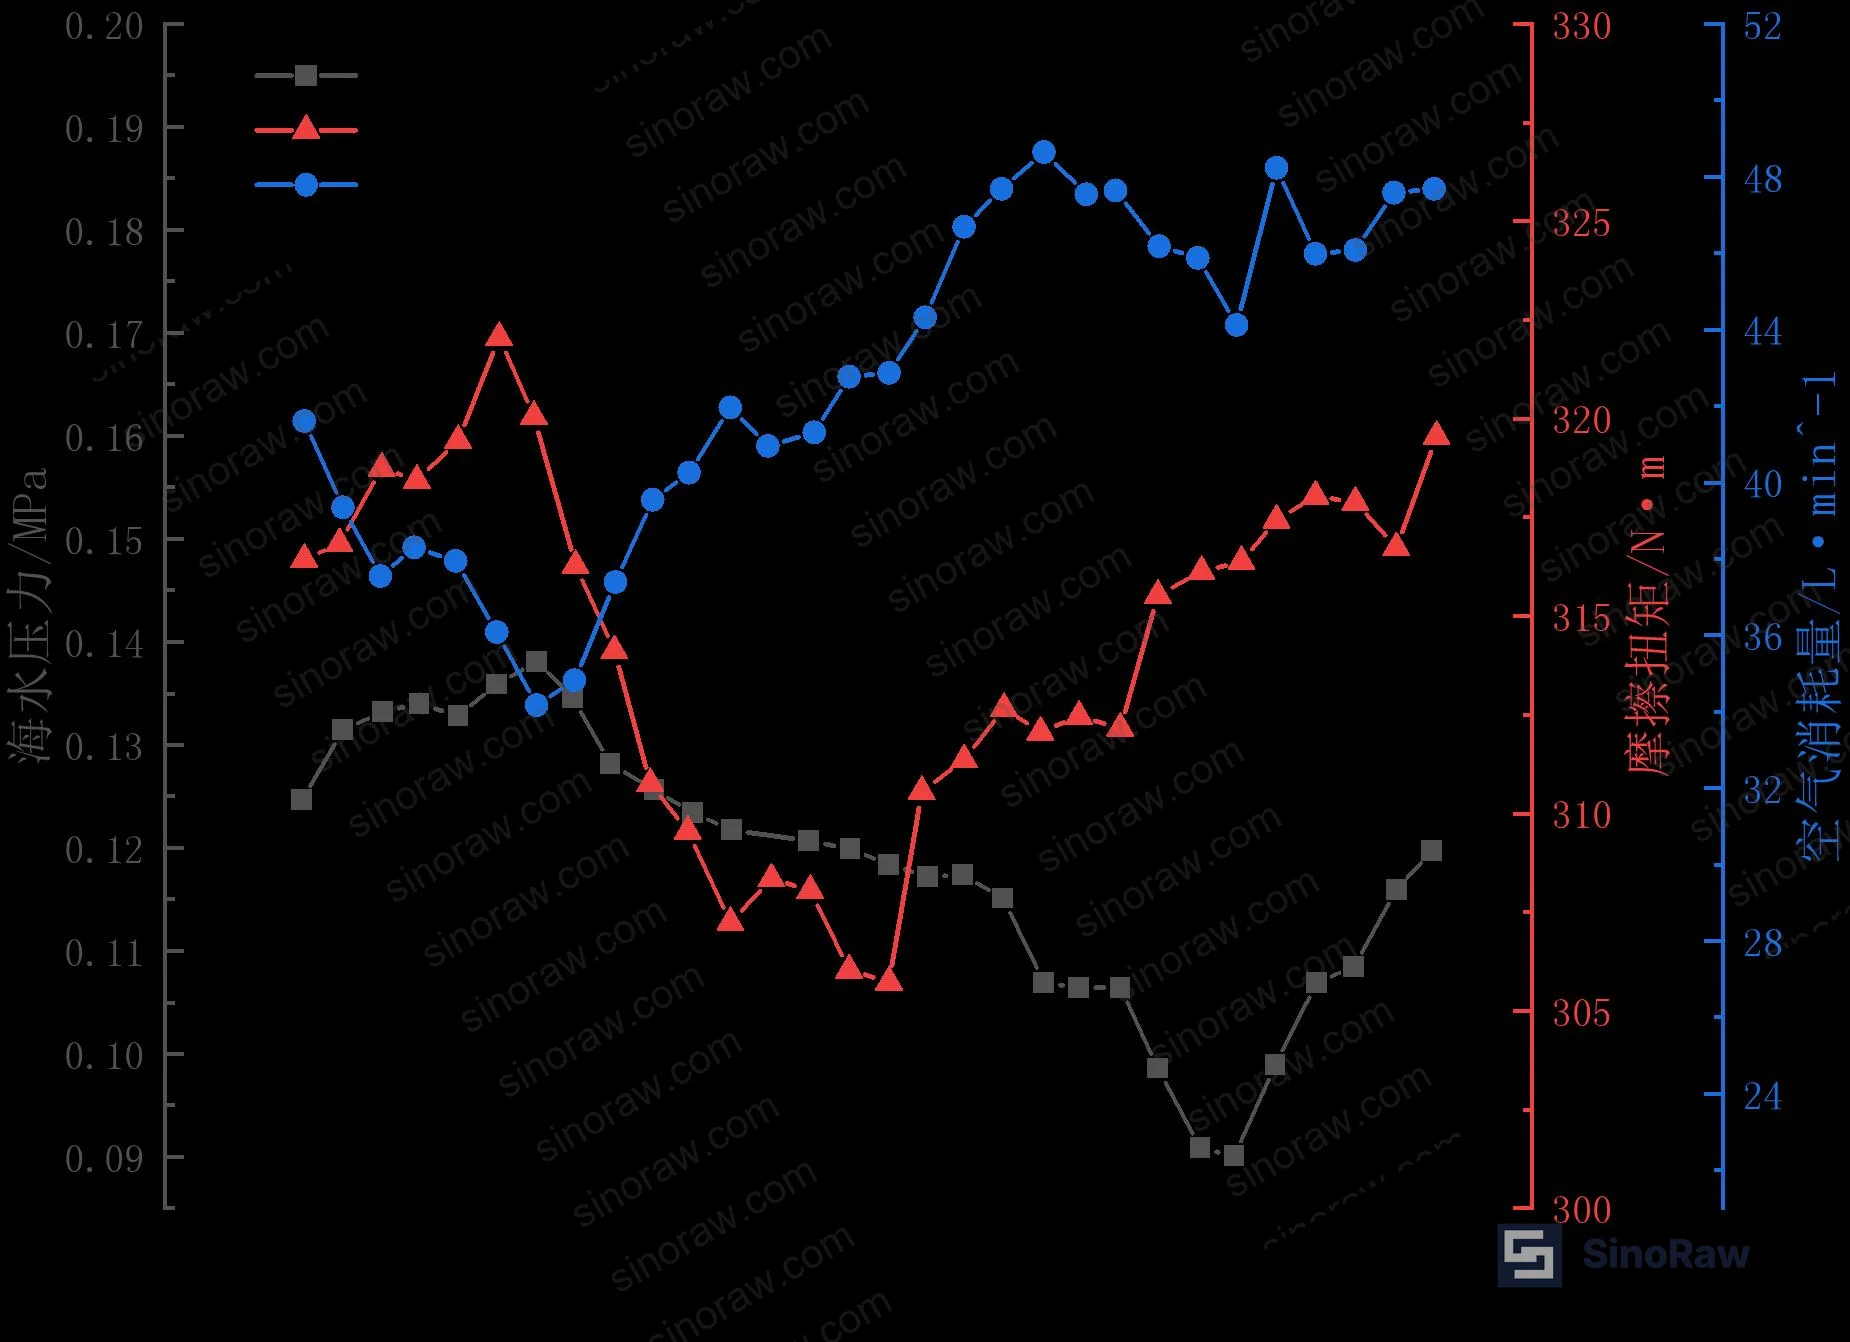
Cyclic pressure tests imposed sinusoidal seawater pressure variations of ±0.01 MPa and ±0.03 MPa amplitude around a 12 m baseline depth, with 30-second periods simulating wave action or ice floe impacts. Under ±0.01 MPa fluctuation, friction torque oscillated between 16 and 19 N·m with air consumption varying from 38 to 42 L/min—modest swings well within the seal’s operating envelope. Increasing fluctuation amplitude to ±0.03 MPa widened the response band to 14–22 N·m torque and 32–48 L/min air flow, but in all cases the seal remained open and leak-free. The system exhibited slight hysteresis: torque response lagged pressure change by approximately 3 seconds, likely due to elastomer compliance and air cavity volume acting as a damper.
This dynamic stability is critical for ice-class service, where propeller-ice interactions generate impulsive loads that propagate through the drivetrain as pressure spikes in the pod casing. A seal that closes momentarily during a pressure surge allows seawater intrusion into the lubricant, accelerating bearing corrosion. The test results confirm that the air cushion design maintains positive sealing even during 3-meter instantaneous depth excursions (±0.03 MPa), equivalent to a pod drive experiencing a 30-ton ice block impact that momentarily deforms the casing. For buyers, this means specifying that suppliers must demonstrate continuous sealing under cyclic pressure loading per ASTM D882 Standard Test Method for Tensile Properties of Thin Plastic Sheeting principles adapted to rotary seal validation—though note that ASTM D882 is written for films, the concept of documenting mechanical response to repeated strain cycles applies directly.
Pressure surge testing also revealed that air consumption peaks lag pressure peaks, indicating that the air regulation system must be tuned with sufficient bandwidth to track rapid depth changes. A slow-response regulator will allow cavity pressure to dip below opening threshold during the downward pressure swing, causing transient seal closure. Specify pressure regulators with response time under 1 second and flow capacity at least 2× steady-state consumption to handle transient demand spikes. This is one area where sinoraw.com helps overseas buyers identify suppliers capable of matching these dynamic performance requirements—our sourcing team maintains a database of manufacturers who have demonstrated compliant transient response in third-party testing, shortening your qualification cycle from months to weeks. Need help identifying qualified suppliers for rotating seal systems with verified pressure-surge performance? Talk to our sourcing team →
Shaft Eccentricity Tolerance: Quantifying Installation Alignment Requirements #
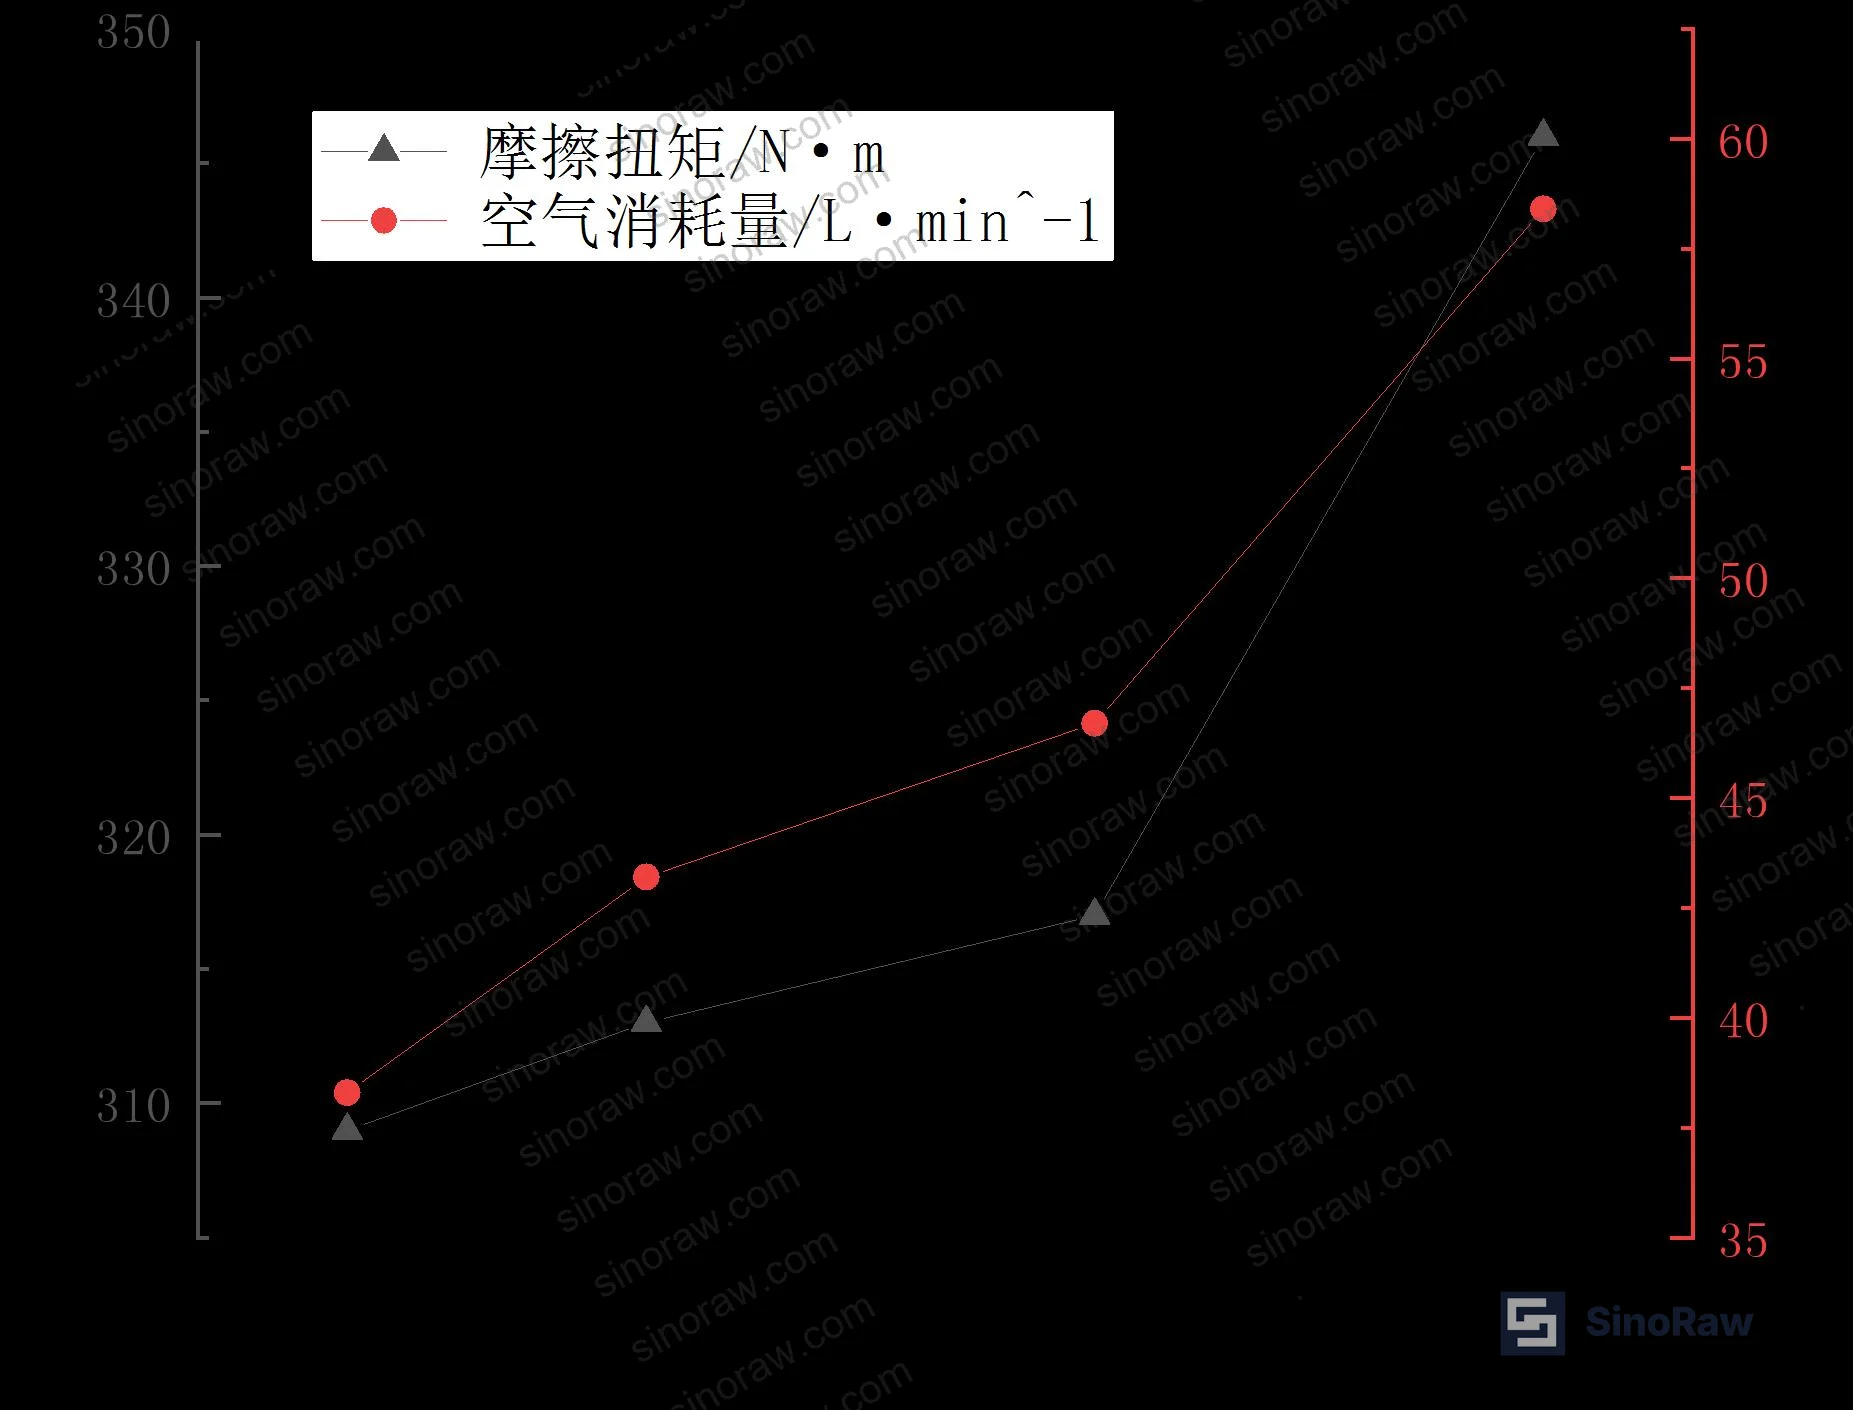
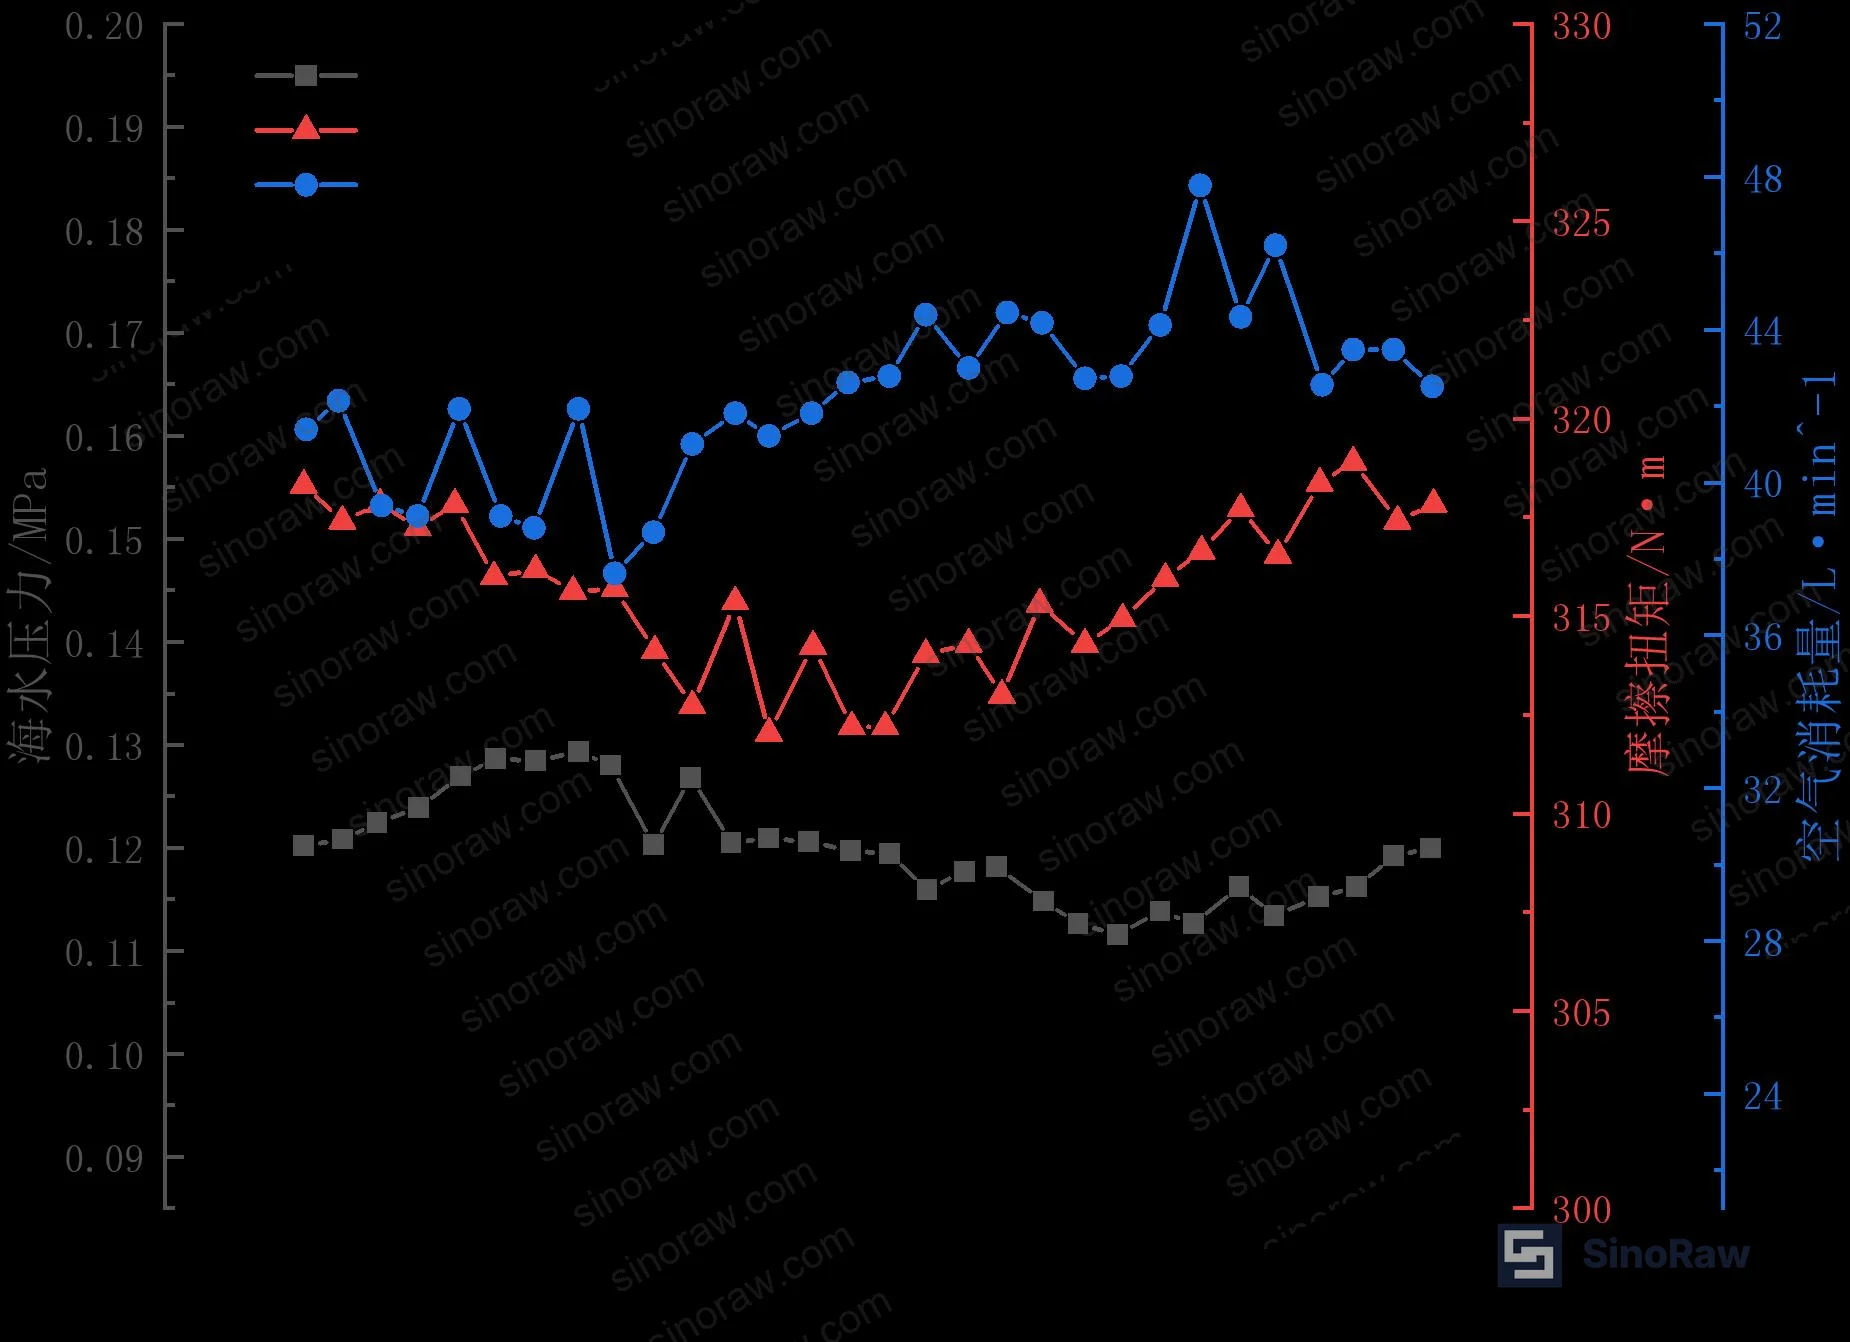
Deliberate misalignment tests imposed radial shaft offsets from 0.05 to 0.20 mm while monitoring seal performance at 300 rpm and 12 m depth. Friction torque increased nearly linearly with eccentricity at a rate of 320 N·m per millimeter of runout. At 0.05 mm offset—typical for a well-aligned installation—friction was 17 N·m; at 0.20 mm, it reached 81 N·m, a 376% increase. Critically, air consumption remained essentially constant across the eccentricity range (41–44 L/min), demonstrating that the seal maintained opening and leak-tightness even under severe misalignment.
The friction-eccentricity linearity provides a straightforward design rule: for every 0.1 mm of permissible shaft runout, accept a 32 N·m increase in steady-state friction torque. If your drive motor has 50 N·m margin above propulsion load, you can tolerate up to 0.15 mm runout before risking motor overload. Conversely, if alignment budget is tight—common in retrofit installations where existing bearings constrain geometry—you must hold eccentricity below 0.08 mm to keep friction under 25 N·m. This quantification removes guesswork from alignment specifications and allows you to trade off machining cost against motor sizing.
In practice, achieving sub-0.1 mm runout over a 2-meter shaft span in a marine environment is challenging. Ice impacts, thermal expansion, and bearing wear all contribute to dynamic misalignment that exceeds static alignment measurements taken during installation. One mitigation strategy: specify Pump & Valve Seals with wider lip contact bands that distribute load over a larger area, reducing peak contact pressure when the shaft is off-center. Another approach is to install condition monitoring that tracks friction torque trends and triggers an alarm when torque exceeds the baseline by 25%, indicating progressive misalignment before it causes seal failure.
The test data also implies a practical inspection interval. If field experience shows that shaft runout increases by 0.02 mm per 1000 operating hours due to bearing wear, and your friction budget allows 0.10 mm total runout, you have roughly 5000 hours before reaching the limit—suggesting annual alignment checks for a system running 4000 hours/year. Compare this derived schedule against the supplier’s recommended maintenance interval; if they specify 2000-hour checks without justifying why, they either have undocumented failure data or are sandbagging the interval to sell more service contracts.
Practical Guidance for Buyers #
Start qualification by requesting depth-pressure curves covering your operational envelope plus 20% margin—if you expect 15 m maximum depth, demand test data to 18 m. Don’t accept single-point opening pressure specs. Next, insist on temperature-corrected friction and air consumption data spanning the coldest and warmest seawater your vessel will encounter; a 30°C range is typical for seasonal polar operations. If the supplier provides only room-temperature data, assume they haven’t validated low-temperature performance and factor in 50% higher friction torque as contingency, which may force motor upsizing.
For systems incorporating Fluid Control components in the lubrication circuit, verify that the oil cooler and filtration loop are sized to handle the heat load from worst-case friction torque, not just average conditions. Use the friction data to calculate thermal input: for example, 25 N·m at 300 rpm (31.4 rad/s) generates 785 W of heat, which must be removed continuously. If your cooler is rated for 500 W, you’ll boil the oil during prolonged low-speed, high-load operations in warm water. Cross-check lubricant flow rate, heat exchanger capacity, and friction torque estimates before finalizing the thermal management design—this integrated validation step is where many projects stumble because mechanical and thermal engineers work in silos.
Regarding seal materials, avoid generic “marine-grade elastomer” specifications. Demand specific polymer type (NBR, FKM, FFKM), hardness range (Shore A 65–75 typical), and compression set limits (<25% per ASTM D395 Method B, 70 hours at 100°C). For critical applications, request batch traceability and require the supplier to archive samples from each production lot for 10 years in case field failures necessitate forensic analysis. This level of rigor is standard in aerospace and subsea oil/gas, but still rare in commercial marine—implementing it now differentiates your procurement function and reduces total cost of ownership by catching material deviations before they cause downtime.
Finally, align your test acceptance criteria with actual service conditions. If the test rig runs at 300 rpm but your operational profile includes frequent 100 rpm maneuvering, require the supplier to demonstrate leak-free operation at your minimum speed for the same 2-hour duration used in the research. Similarly, if ice impacts in your operational area can impose ±0.05 MPa pressure swings in under 5 seconds, specify that the supplier must replicate those transients on their test stand. The goal is not to make testing harder arbitrarily, but to ensure that passing a qualification test actually predicts field reliability. Too many buyers accept generic test protocols that don’t match their duty cycle, then act surprised when seals fail prematurely in service.
Supplier Qualification Questions #
- What is the seal opening pressure at 20 meters water depth and 5°C seawater temperature, and what is the corresponding air consumption rate in liters per minute at 250 rpm shaft speed?
- Provide friction torque measurements over a 0–40°C temperature range at constant 300 rpm and 12 m depth, demonstrating that torque increase does not exceed 100% between temperature extremes.
- Can you supply test reports showing zero oil-water leakage during continuous 2-hour operation under ±0.03 MPa cyclic pressure variation with 30-second period, and what was the maximum measured air consumption during pressure peaks?
- What is the friction torque increase per 0.1 mm of shaft radial runout at your recommended operating air cavity pressure, and up to what total eccentricity does the seal maintain leak-free operation?
- Provide batch-specific Shore A hardness data and compression set test results per ASTM D395 Method B for the seal elastomer compound used in production units, including upper and lower control limits and the process for rejecting out-of-spec batches.
Sourcing Checklist #
- ☐ Test reports demonstrate linear seal opening pressure increase of 0.010 ± 0.002 MPa per meter water depth across 4–24 m range
- ☐ Friction torque data provided for minimum, cruise, and maximum shaft speeds, with values documented at 0°C, 20°C, and 40°C seawater temperatures
- ☐ Supplier confirms zero leakage after 2-hour continuous operation at each test condition (static, variable speed, variable depth, temperature extremes, pressure cycling, shaft eccentricity up to 0.15 mm)
- ☐ Air compressor capacity specified at 2× steady-state consumption measured at maximum operating temperature to handle transient demand
- ☐ Pressure regulator response time validated at <1 second using step-input testing per ISO 2859-1:1999 Sampling procedures for inspection by attributes methodology
- ☐ Lubricant viscosity grade confirmed compatible with coldest expected temperature, with pour point at least 10°C below minimum seawater temperature
- ☐ Seal elastomer compound includes batch-specific material certification with Shore A hardness within 65–75 range and compression set <25% per ASTM D395
- ☐ Shaft surface finish on contact area maintained at Ra <0.4 μm and runout held to <0.10 mm over bearing span per manufacturer's alignment procedure
Key Specifications Table #
| Parameter | Recommended Value | Verification Method |
|---|---|---|
| Seal Opening Pressure Gradient | 0.010 ± 0.002 MPa/m depth | Static pressure ramp test at 2 m intervals from 4–24 m, observe bubble release, record air cavity pressure at opening threshold |
| Friction Torque at 300 rpm, 12 m, 20°C | 15–22 N·m | In-line torque sensor measurement during 2-hour steady-state operation, log maximum, minimum, and mean values |
| Air Consumption at Opening Pressure | 40–55 L/min | Thermal mass flow meter in air supply line, measure steady-state flow after 30-minute stabilization period |
| Temperature Sensitivity | Friction torque increase <100% over 0–40°C range | Repeat friction measurement at 10°C intervals, plot torque vs. temperature, calculate % change between extremes |
| Eccentricity Friction Coefficient | 280–360 N·m per mm radial runout | Incrementally offset shaft in 0.05 mm steps up to 0.20 mm, measure friction at each step, linear regression slope |
| Pressure Transient Response | Seal remains open during ±0.03 MPa, 30 s period cycling | Apply sinusoidal seawater pressure variation for 20 cycles, monitor air flow and leakage, confirm zero oil-water intrusion |
Can’t find a supplier meeting these specs? Submit your requirements and we’ll match you within 48 hours.
References #
Data source: Dynamic Performance Validation of Rotary Seals and Lubrication Systems for High Ice-Class Podded Propulsion Shafts, G. Li et al., Journal of Marine Engineering & Technology, 2024
Frequently Asked Questions #
Why does seal opening pressure depend on water depth but not rotational speed?
Opening pressure is determined by the force balance between air cavity pressure pushing the seal lip outward and seawater pressure pushing it inward. Water depth directly controls seawater pressure. Rotational speed affects friction and hydrodynamic lift in the oil film, but these are secondary effects that don’t significantly alter the static force balance required to lift the lip. The test data confirms that opening pressure at 12 m depth varied by only 0.01 MPa across 100–500 rpm.
Can I use the same seal design for both Arctic and tropical service?
Material selection becomes critical. Standard nitrile rubber (NBR) seals work well from -10 to +40°C, but repeated thermal cycling between those extremes accelerates fatigue. For vessels operating year-round in both polar and equatorial regions, specify fluoroelastomer (FKM) or perfluoroelastomer (FFKM) compounds that tolerate wider temperature swings without degrading. Expect to pay 3–5× more for FFKM, but seal life increases by a similar factor under cycling duty, making lifecycle cost roughly equivalent.
How much shaft misalignment can a lip seal tolerate before failing?
The test data shows that seals maintained leak-free operation up to 0.20 mm eccentricity, though friction torque increased linearly at 320 N·m per millimeter. Practical limit depends on your motor’s torque margin and bearing design. If friction torque rise will overload the motor or cause excessive bearing heating, hold runout below 0.10 mm. If you have torque headroom, accepting 0.15 mm runout simplifies installation alignment and reduces machining cost. Always verify with your motor manufacturer what parasitic torque their drive can absorb continuously without derating.
What maintenance schedule should I use for podded drive seals?
Base inspection interval on shaft runout growth rate and friction torque trend. If vibration analysis or alignment measurements show runout increasing by 0.02 mm per 1000 hours, and your friction budget allows 0.10 mm total, plan for alignment correction every 5000 hours. Also monitor lubricant contamination—finding water in the oil means a seal has leaked, requiring immediate replacement. Calendar-based replacement every 24 months is common for systems lacking condition monitoring, but trend-based maintenance triggered by measured torque increase is more cost-effective.
Do I need pressure transient testing if my operational area has no ice?
Even ice-free operations experience pressure transients from wave action, propeller ventilation, and emergency maneuvers. A research vessel conducting deep profiling might change depth 10 m in 30 seconds, imposing ±0.10 MPa pressure swings. Cargo vessels in heavy seas see similar transients. Pressure-surge validation proves that your seal won’t momentarily close and admit seawater during these events. Testing to ±0.03 MPa covers most non-ice scenarios; if your mission profile includes more severe transients, scale the test amplitude accordingly and confirm the supplier’s design can handle it.
Published by sinoraw.com Technical Team | Request a sourcing quote


