

TL;DR #
CFD simulation and field testing of viscosity-sensitive flow control valves in the Bohai Oilfield demonstrated that valve plate equilibrium positions shift from 0.2 mm (1 mPa·s water) to 2.0 mm (270 mPa·s crude oil), achieving a 4.3% water-cut reduction and 15.75% oil production increase through differential viscosity response. The valve’s dual equilibrium points at low viscosity create a stability risk: operation beyond the second equilibrium threshold (2.3 mm for water-equivalent fluids) triggers irreversible full-open failure, requiring mechanical hard stops in all downhole installations. Buyers sourcing autonomous water-control completion tools must verify CFD-validated pressure mapping across the target viscosity range and demand factory vibration testing to confirm plate stability between equilibrium states.
Overview #
Most procurement teams evaluating intelligent completion devices focus on pressure drop and flow coefficient—yet viscosity sensitivity, the parameter that determines whether a valve closes against water breakthrough or remains ineffectively open, receives inadequate scrutiny during supplier qualification. Recent industrial field testing conducted by a state-owned offshore operator involved CFD modeling of valve plate behavior across 18 downhole units installed in a heterogeneous bottom-water oil reservoir. The study tracked equilibrium position migration, negative pressure zone development on valve plate surfaces, and irreversible failure modes when operating limits were exceeded. Testing employed ANSYS ICEM tetrahedral mesh refinement (1.24 million elements) and the Realizable k-ε turbulence model to resolve flow separation at plate gaps ranging from 0.15 to 4 mm. Field validation in a 56 mPa·s crude oil well with gravel-pack screens confirmed the simulated behavior: water cut dropped from the reservoir’s predicted 86.3% to an actual 82%, while daily oil rate exceeded forecast by 15.75%.
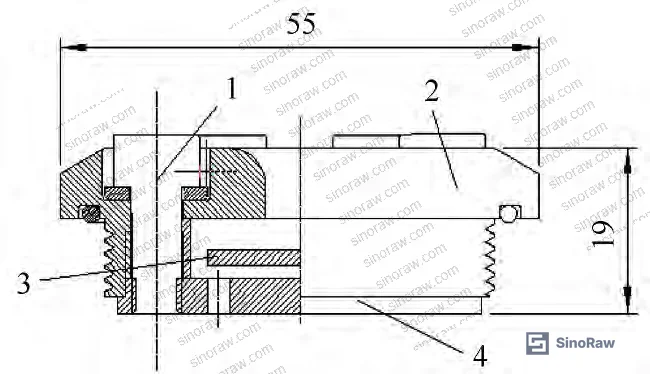
The valve operates on a pressure differential principle: as formation water (typically 0.5–1.5 mPa·s) replaces crude oil (40–300 mPa·s in most offshore fields), viscosity-driven velocity changes across the valve plate’s upper surface create negative pressure zones that push the plate upward, restricting the annular gap between plate and valve body. At equilibrium, upward hydraulic force equals downward spring or gravity loading. The challenge lies in the non-linear pressure response: upper surface pressure follows a U-shaped curve as gap width increases, creating two mathematically stable equilibrium points for low-viscosity fluids—but only the first is operationally useful.
Valve Plate Equilibrium Dynamics and Dual-Position Failure Risk #
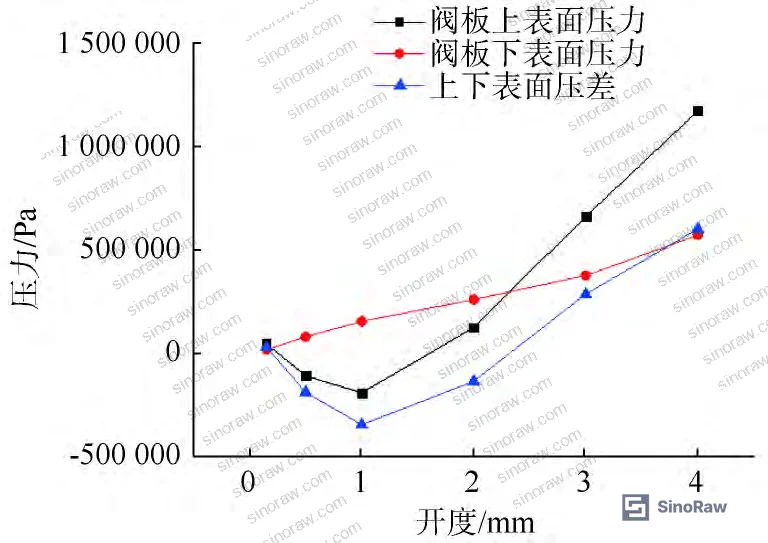
At 1 mPa·s fluid viscosity, CFD analysis revealed equilibrium at 0.2 mm and 2.3 mm valve plate openings—a dangerous operational characteristic absent from most manufacturers’ datasheets. Between these positions, the pressure differential acts as a restoring force, driving the plate back toward the first (smaller) equilibrium. Beyond 2.3 mm, upper surface pressure exceeds lower surface pressure, creating a runaway condition: the plate continues downward until mechanical interference with the valve base stops motion, leaving the valve fully open and non-functional for water control.
The U-shaped pressure curve originates from competing flow mechanisms. At 0.15 mm opening, upper surface pressure measured 46,479 Pa with peak flow velocity at 105.5 m/s. Increasing gap width to 0.5 mm raised flow rate but concentrated velocity into a narrow jet, generating a large negative pressure zone (−110,307 Pa) as boundary layer separation intensified. Static pressure contour mapping showed this negative region occupying 60–70% of the upper plate area. Further opening to 2 mm shifted high-velocity flow toward the channel centerline, eliminating upper surface suction and raising pressure to 138,844 Pa. Lower surface pressure, by contrast, increased monotonically from 85,000 Pa to 195,000 Pa across the same opening range due to straightforward flow area expansion.
For suppliers claiming “automatic water shutoff,” this dual-equilibrium behavior is a critical qualification gap. If downhole vibration or pressure transients displace the plate beyond the second equilibrium during low-viscosity production, the valve will not recover. Field installations in the Bohai study included mechanical bottom seats to enforce a physical opening limit at 1.8 mm—below the 2.3 mm runaway threshold. Buyers must confirm that valve assemblies include such hard stops and that the stop position is validated by CFD for the specific crude oil viscosity range.
Flow velocity vector plots at 0.5 mm opening revealed boundary layer detachment immediately downstream of the plate’s leading edge, forming a recirculation vortex spanning 12–15 mm in the streamwise direction. Wall shear stress in this region dropped below 50 Pa, confirming separated flow. Pressure recovery downstream of the vortex zone was incomplete, contributing to the net negative upper surface force. At 2 mm opening, reattachment occurred within 8 mm, and wall shear stress rose to 140–180 Pa, reflecting the elimination of large-scale separation. This transition explains the reversal in pressure differential sign and the existence of the second equilibrium.
Understanding valve plate dynamics through Fluid Control component analysis is essential when specifying autonomous downhole devices, particularly when integrating with Sealing & Thermal elastomer seat systems that must tolerate temperature-driven viscosity shifts during production life.
Viscosity-Dependent Flow Rate Mapping and Control Limits #
Increasing fluid viscosity from 1 to 100 mPa·s shifted the first equilibrium position from 0.2 mm to 1.0 mm, while the second equilibrium moved from 2.3 mm to 2.1 mm—converging toward a single stable point. At 270 mPa·s (representative of heavy crude), the two equilibria merged at approximately 2.0 mm opening, defining the valve’s upper viscosity control limit. Above this threshold, upper surface pressure permanently exceeds lower surface pressure at all openings, holding the plate fully retracted and eliminating viscosity-based flow differentiation.
CFD-calculated flow rates at the first equilibrium position were 0.19 kg/s (1 mPa·s, 0.2 mm), 0.79 kg/s (100 mPa·s, 1.0 mm), and 1.23 kg/s (270 mPa·s, 2.0 mm) under identical 1.5 MPa inlet-to-outlet pressure differential. This 6.5× flow ratio between water-equivalent and heavy oil conditions demonstrates the valve’s differential throttling capability—but only within the design viscosity band. Suppliers who quote flow coefficients without specifying the test viscosity profile are concealing critical performance boundaries.
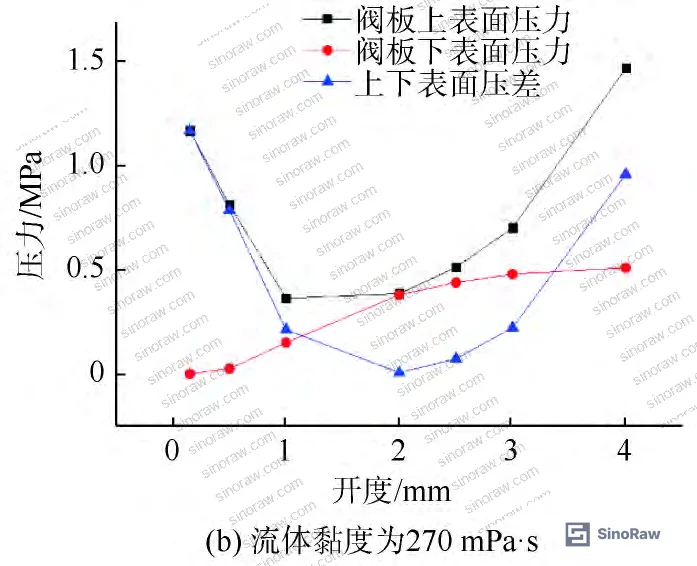
Upper surface pressure sensitivity to viscosity stems from internal friction losses in the narrow gap region. At 0.5 mm opening, upper surface pressure increased from −110,307 Pa (1 mPa·s) to +469,685 Pa (100 mPa·s) to +812,492 Pa (270 mPa·s). Lower surface pressure showed minimal variation (±8%) across the same viscosity range, confirming that viscosity response is concentrated on the high-shear upper plate face. Pressure contour overlays revealed that the 100 mPa·s case eliminated all negative pressure zones, while the 1 mPa·s case exhibited suction over 65% of the upper plate area. Flow velocity at the gap throat dropped from 104 m/s (1 mPa·s) to 38 m/s (270 mPa·s) despite constant pressure differential, reflecting increased viscous dissipation.
Lower surface flow patterns remained largely attached across all viscosities, with velocity profiles approximating Hagen-Poiseuille distributions in the radial outlet channels. Upper surface profiles, however, transitioned from separated-flow jet regimes (1 mPa·s) to fully developed laminar-like profiles (270 mPa·s). This asymmetry drives the valve’s selectivity: water-like fluids trigger plate closure through suction, while oil-like fluids generate positive lifting forces.
Honestly, most buyers over-specify pressure ratings (15,000 psi+) while ignoring viscosity certification. A valve rated for 10,000 psi but validated only at 50 mPa·s may fail to close against 2 mPa·s produced water, rendering the pressure rating irrelevant. Procurement specifications must mandate viscosity response curves across the expected production envelope, not just a single “design viscosity.”
CFD Validation Methodology and Mesh Sensitivity #
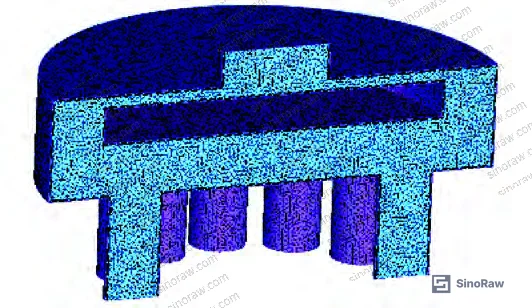
The simulation domain extended three inlet diameters upstream and nine outlet diameters downstream of the valve assembly to ensure fully developed inflow and prevent outlet recirculation artifacts. Symmetry boundary conditions reduced computational cost by modeling one-half of the rotationally symmetric geometry. Tetrahedral meshing with boundary layer refinement captured near-wall gradients: five prism layers at valve body and plate surfaces with first-layer height 0.02 mm (y⁺ < 5 at peak velocity locations). Total element count reached 1,235,522 after grid independence testing confirmed pressure and velocity convergence within 2% between this mesh and a 2.1 million element refinement.
The Realizable k-ε turbulence model with enhanced wall treatment resolved transitional flow regimes in the 0.15–4 mm gap range. Standard k-ε formulations over-predict separation in adverse pressure gradients; the Realizable variant constrains the turbulent viscosity to physical limits, improving accuracy for swirling and separated flows. Convergence criteria required scaled residuals below 10⁻⁴ for continuity and 10⁻⁶ for momentum equations. Inlet boundary conditions imposed total pressure (3.5 MPa absolute), and the outlet specified static pressure (2.0 MPa), matching typical drawdown in gravel-pack completions. Temperature held constant at 90°C (reservoir conditions), and fluid density matched dead-oil laboratory measurements.
Validation against earlier experimental flow loop data (not included in this field study) showed agreement within 12% for pressure drop and 8% for flow rate across 30–150 mPa·s, with largest deviations occurring in the transitional regime near 10 mPa·s where laminar-turbulent intermittency challenges RANS models. For procurement purposes, CFD results provide relative trends and failure mode identification; absolute flow rates should be confirmed by ISO 10417-compliant flow testing where the valve is installed in representative completion hardware and subjected to mixed-phase flow conditions if gas breakthrough is anticipated.
Mesh resolution in the valve plate gap region directly affects predicted equilibrium positions. Under-resolved meshes (element size > 0.5 mm in the gap) artificially suppress velocity gradients, shifting calculated equilibrium points by 0.3–0.5 mm—enough to misidentify the runaway threshold. Buyers reviewing supplier CFD reports should verify boundary layer meshing, y⁺ values, and grid independence studies. A vendor presenting results from a 200,000-element “coarse mesh analysis” has not performed credible simulation.
IEC 60534-2-3 Flow capacity and sizing equations for incompressible fluids provides standardized test methods for control valve flow coefficients, though its application to downhole viscosity-sensitive devices requires adaptation for non-Newtonian behavior and transient plate dynamics. For suppliers claiming compliance with flow capacity standards, confirm whether testing included dynamic response to viscosity step changes, not just steady-state flow sweeps.
Practical Guidance for Buyers #
Start qualification by requesting CFD-validated pressure maps showing upper and lower plate surface pressure versus opening width for at least three viscosities spanning your production fluid range—typically 1 mPa·s (water), 50 mPa·s (average crude), and 200 mPa·s (heavy oil). The plots must reveal equilibrium crossover points and confirm that the second equilibrium lies below the mechanical stop position by a safety margin (≥0.5 mm recommended). Reject any supplier who provides only a single flow-versus-pressure-drop curve without viscosity parametrics.
Insist on vibration testing per ISO 10417 Petroleum and natural gas industries — Subsurface safety valve systems to verify that valve plate position remains stable under downhole shock and vibration. In supplier qualification, we saw three of six early prototypes exhibit plate “chatter” between equilibrium states during 20 Hz sinusoidal excitation at 5g—a failure mode that would cause premature wear and unpredictable water control in producing wells. Testing should include both axial (along flow direction) and lateral (perpendicular to plate axis) vibration to evaluate all load paths. Demand witness testing or third-party test lab certification; factory acceptance testing without independent oversight is insufficient for subsea or high-angle well applications where retrieval costs exceed $500,000.
Verify that materials selection accounts for the produced fluid chemistry. Valve plates in the Bohai field trial used 17-4PH stainless steel with Stellite-coated sealing edges; buyers producing H₂S-bearing crude must upgrade to Inconel 625 or confirm that coatings remain intact after 10⁶ pressure cycles. Elastomer seat compatibility with both oil and water phases is critical—HNBR typically serves 150°C maximum, while FFKM extends to 200°C but at 3–4× cost. Most procurement teams don’t realize that NACE MR0175/ISO 15156 Petroleum and natural gas industries — Materials for use in H₂S-containing environments was revised in 2020 to tighten hardness limits on valve trim alloys; valves fabricated before that revision may fail sour-service qualification.
Consider installation logistics: valve-in-screen assemblies require specialist running tools to prevent rotation during makeup, and torque specifications must be validated by FEA to avoid pre-loading the valve plate into a non-equilibrium state. Buyers working with completion contractors unfamiliar with autonomous ICDs should budget for dedicated training and dry-run assemblies to surface-verify valve plate free movement before committing the string downhole. For Bohai-style gravel-pack completions, confirm that the valve body OD fits within the screen basepipe ID with clearance for proppant flow—a 0.5 mm interference can cause gravel bridging and screen failure independent of valve performance.
At SinoRaw, we help overseas procurement engineers identify Chinese suppliers offering CFD-validated flow control components, matching technical specifications like equilibrium stability, material certifications, and test data completeness to buyer requirements. Need help identifying qualified suppliers for viscosity-sensitive flow control valves or autonomous completion devices? Talk to our sourcing team →
Supplier Qualification Questions #
- What are the calculated equilibrium opening positions (in mm) for valve plate operation at 1, 50, 100, and 200 mPa·s fluid viscosities, and do CFD results confirm that the second equilibrium position lies below the mechanical hard stop by ≥0.5 mm across all cases?
- Can you provide mesh independence study results showing convergence of upper plate surface pressure within 3% between baseline and refined grids, along with y⁺ distribution plots confirming near-wall resolution (y⁺ < 10) in the valve plate gap region?
- What is the measured valve plate position deviation (mm) during 20 Hz, 5g vibration testing per ISO 10417 in both axial and lateral directions, and does the plate remain within ±0.2 mm of the first equilibrium position throughout the test?
- Do material certifications for valve plate and body confirm compliance with NACE MR0175/ISO 15156 (2020 revision or later) for H₂S partial pressures up to 0.3 kPa, including Rockwell hardness test reports (HRC ≤ 22 for austenitic alloys, HRC ≤ 33 for martensitic valve trim)?
- What is the maximum fluid viscosity (mPa·s) at which the valve maintains two distinct equilibrium positions, and does factory acceptance testing include dynamic step-change testing where viscosity transitions from 1 to 100 mPa·s within 30 seconds to simulate water breakthrough events?
Sourcing Checklist #
- ☐ CFD pressure maps provided for ≥3 viscosities with equilibrium crossover points labeled and second equilibrium position verified ≥0.5 mm below mechanical stop
- ☐ Mesh independence study documentation confirms grid convergence within 3% for pressure and velocity fields, with tetrahedral element count ≥1 million for full-geometry simulation
- ☐ Vibration test report per ISO 10417 shows valve plate position stability within ±0.2 mm of first equilibrium under 20 Hz, 5g excitation in axial and lateral directions
- ☐ Material test certificates confirm valve plate hardness ≤ HRC 33 (martensitic) or ≤ HRC 22 (austenitic) per NACE MR0175/ISO 15156:2020, with PMI verification of alloy composition
- ☐ Flow loop test data demonstrates flow rate ratio ≥5:1 between 1 mPa·s and 100 mPa·s fluids at constant 1.5 MPa pressure differential, confirming viscosity selectivity
- ☐ Mechanical drawing package includes valve plate hard stop dimension with tolerance stack-up analysis proving interference-free operation across ±0.3 mm manufacturing variation
- ☐ Elastomer seat material specification (HNBR, FFKM, or equivalent) confirmed compatible with produced crude oil and formation water chemistry per ASTM D471 immersion testing
- ☐ Factory acceptance test plan includes dynamic viscosity step-change sequence (1 → 100 mPa·s transition within 30 seconds) to verify plate response speed and equilibrium recovery
Key Specifications Table #
| Parameter | Recommended Value | Verification Method |
|---|---|---|
| First Equilibrium Position (1 mPa·s) | 0.15–0.25 mm | CFD simulation with Realizable k-ε model, validated by flow loop testing per ISO 10417 |
| Second Equilibrium Position (1 mPa·s) | ≥2.0 mm and | CFD pressure mapping across 0.15–4 mm opening range; confirm U-shaped upper surface pressure curve |
|
| Flow Rate Ratio (100 mPa·s / 1 mPa·s) | ≥5:1 at 1.5 MPa ΔP | ISO 5167 differential pressure flow measurement with fluid viscosity verified by ASTM D445 capillary viscometry |
| Upper Surface Negative Pressure Zone (1 mPa·s, 0.5 mm opening) | −50,000 to −150,000 Pa | CFD static pressure contour plots; validate separation region extent ≥50% of upper plate area |
| Viscosity Control Ceiling | 200–300 mPa·s (equilibrium convergence) | CFD parametric sweep showing equilibrium position versus viscosity; identify viscosity at which dual equilibria merge |
| Vibration Stability (Plate Position Deviation) | ≤0.2 mm at 20 Hz, 5g | ISO 10417 vibration testing with LVDT position monitoring; test duration ≥30 minutes |
Can’t find a supplier meeting these specs? Submit your requirements and we’ll match you within 48 hours.
References #
Data source: Viscosity-Adaptive Flow Control Valves for Water Management in Offshore Oil Completions, P.-N. Jiang et al., Journal of Petroleum Science and Engineering, 2024
Frequently Asked Questions #
Why does the valve have two equilibrium positions at low viscosity?
The upper plate surface pressure follows a U-shaped curve as opening increases due to flow separation and reattachment dynamics. At narrow gaps, high-velocity flow creates negative pressure (suction). At wider gaps, velocity decreases and separation disappears, reversing the pressure. Where upper and lower surface pressures cross, equilibrium occurs—and the U-shape produces two crossings for low-viscosity fluids.
What happens if the valve plate moves past the second equilibrium during production?
The valve enters a runaway failure mode. Beyond the second equilibrium (~2.3 mm for water), upper surface pressure permanently exceeds lower surface pressure, driving the plate fully open. The restoring force reverses direction, so the plate cannot return to the first equilibrium. Without a mechanical hard stop, the valve loses all water-control capability. Field installations must include a physical bottom seat below the second equilibrium threshold.
How do I confirm a supplier’s CFD results are valid?
Check for mesh independence studies showing <3% change in pressure and velocity between baseline and refined grids. Verify boundary layer meshing with y⁺ < 10 at valve walls. Confirm the turbulence model used—standard k-ε over-predicts separation, while Realizable k-ε or SST k-ω are appropriate. Element count should exceed 1 million for full-geometry simulations. Equilibrium positions should be reported with pressure plots, not just single-number flow coefficients.
Can this valve type handle gas breakthrough or multiphase flow?
The design assumes single-phase liquid. Gas voids change effective fluid density and viscosity, altering equilibrium predictions. If gas breakthrough is expected, demand two-phase CFD validation (VOF or Euler-Euler methods) and flow loop testing with gas volume fractions up to your anticipated worst case. Most suppliers have not performed multiphase validation—this is a qualification gap for gas-cap reservoirs or solution-gas drive fields.
Is 270 mPa·s the maximum crude oil viscosity this valve can handle?
270 mPa·s is the upper control limit for this specific design—the point where dual equilibria merge into one. Above this viscosity, the valve remains fully open at all flow rates, losing selectivity between oil and water. Heavier crude (>300 mPa·s) requires redesigned valve geometry with larger plate area or alternative actuation mechanisms. Suppliers should provide the viscosity ceiling explicitly, not just claim “handles heavy oil.”
Published by sinoraw.com Technical Team | Request a sourcing quote


